Entering the market from 50,000 to 100,000 to 302,000.
In the third year, it reached 590,000.
In the fourth year, it reached 3.78 million.
November reached over 7 million.
Until a few years ago, it was easy to withdraw 30 million in the cryptocurrency market.
During this period, I hit rock bottom. At that time, I reached a peak of around 4 million. At that moment, I thought I could be considered a big player in the cryptocurrency market, resolutely quitting my job to focus on trading cryptocurrencies, even borrowing money to trade. However, reality gave me a harsh slap, the financial crisis made me not only give back all my profits but also owe a mountain of debts, ultimately forcing me to sell my house, and my wife and children almost left me.
That period was my darkest moment. In just a few months, I experienced a fall from the peak to the bottom. But this also made me realize that the previous smooth sailing was not without an element of luck.
Thus, I believe that if I truly want to continue on the trading path, I need to immerse myself in learning. Besides understanding the basics, I should also analyze news and study technical indicators. If I do not conduct in-depth research and reasonably plan to manage my finances, I will only end up exhausting my funds. Ultimately, as a retail investor without a solid foundation, I will only be happy to enter and leave the market in disappointment.
After the next three years, I cut off all contact with classmates and friends, stayed at home, and worked hard day and night to analyze past trades. When I got tired, I would sleep on the keyboard. I finally achieved financial freedom through trading cryptocurrencies.

A single move can let you predict the future trend of Bitcoin!
In the cryptocurrency market, whether it is spot trading or contracts, we should be clear that most of the time we are making money from trends!
This sentence is easy to understand. For example:
For spot trading, in an upward trend, buying low and selling high will make money! In a downward trend, selling high and buying low will also yield profits. The same applies to contract trading.
This sounds simple, but the problem lies in how to determine the trend, right?
This article will elaborate on this issue in the future. I believe that after you finish reading the content of this article, your ability to predict trends will qualitatively improve.
Trend: I believe as long as you are not foolish, you can understand what is going on!

Looking at this K-line chart above, is the current trend upward, downward, or neither up nor down? Everyone can see this, right?!
When it comes to trends, it's ultimately about cost.
An upward trend is the process of the market's average dynamic cost continuously increasing, while a downward trend is the process of the market's average dynamic cost continuously decreasing.
The trend is very clear on the K-line chart: upward, downward, or no obvious direction (consolidation). We can distinguish it with our naked eyes. More often, we need to use some tools to assist in observation, and that is the moving average.
We all know that 'prices fluctuate around value', but in the cryptocurrency market, it is more appropriate to say 'prices fluctuate around cost.'
The cost I am referring to is market cost! Why not value? There are thousands of coins on exchanges; what value do they have? I digress; in the cryptocurrency market, market prices are driven by cost, and this cost refers to market average cost (short-term cost, medium-term cost, long-term cost).
Cost has a dragging effect on price. This means that when this cost slowly rises, if the price is too high compared to market cost, the price will be pulled down; if the price is too low compared to market cost, the price will also be pulled up.
Furthermore, an upward trend is the process of moving averages continuously rising, while a downward trend is the process of moving averages continuously declining, and consolidation is the process of moving averages fluctuating horizontally.
Therefore, judging a trend to some extent is about judging the movement of moving averages. For us traders, moving averages are our friends; the key point is to have a forecast of the direction of moving averages.
The role of moving averages
The role of moving averages is to discern the direction of trends.
We redefine the price level of moving averages as the average cost of holders over a period of time. When the moving average is rising, it indicates that holders are generally profitable during this period; when the moving average is falling, it indicates that holders are generally at a loss.
In principle, an upward moving average represents a bullish trend, while a downward moving average indicates a bearish trend. In actual trading activities, predicting the movement direction of moving averages is equivalent to predicting the trend direction.
Only when the moving average of a certain period is moving upward do we consider going long. At this time, we can employ strategies like 'buy when there is a pullback but it does not break the moving average; buy again when it falls below and rises above the moving average.' Conversely, when the moving average of a certain period is moving downward, we consider going short. At this time, we will have strategies like 'go short when the rebound does not exceed the moving average; go short when the rebound breaks and falls below the moving average.'
Please note the premise of these two strategies — over a certain period!
Predictable trends
Moving averages represent trends, but some say they are lagging indicators, and they only make sense after prices move. However, moving averages can be predicted!
First, let's understand the algorithm for moving averages (excerpted from Baidu).

MA moving average, this is the most commonly used price average line. Taking the 3-day moving average as an example;
Today's MA3 = (today's closing price + yesterday's closing price + the closing price from two days ago) / 3.
Let's look at an actual example. Suppose the closing prices for the last 3 days are: 3U, 2U, 1U.
So today's MA3 = (3 + 2 + 1) / 3 = 2U.
Assuming tomorrow's closing price is 4U,
So tomorrow's MA3 = (4 + 3 + 2) / 3 = 3U.
That is, tomorrow's MA3 > today's MA3, the trend is upward!
Assuming tomorrow's closing price is 1U,
So tomorrow's MA3 = (1 + 3 + 2) / 3 = 2U.
That is, tomorrow's MA3 < today's MA3, the trend is downward.
Here is a very interesting and important phenomenon; please pay close attention:
Today's MA3 = (today's closing price + yesterday's closing price + the closing price from two days ago) / 3;
Tomorrow's MA5 = (tomorrow's closing price + today's closing price + yesterday's closing price) / 3;
The red parts of the two equations can be offset, leading to a conclusion:
If tomorrow's MA3 is to be greater than today's MA3, then tomorrow's closing price must be greater than the closing prices from the last two days. This phenomenon is called the 'deduction phenomenon.'
In these two equations, the closing prices from the previous two days are also called deduction prices. As long as the next price is greater than the deduction price, the trend remains intact; otherwise, it may weaken or even reverse.
Assuming a coin's current MA20 (20-day moving average) is in an upward trend, as long as tomorrow's closing price is greater than the closing price from 20 days ago, the trend can be guaranteed to continue.
Of course, the deduction price can also be extended to MA60, MA120, and can be used in any time period.
It is precisely because of the existence of the deduction phenomenon that we can predict changes in trends.
So to expand, the deduction price not only needs to observe tomorrow's closing price but also needs to observe the day after tomorrow, the day after that, and even further closing prices.
By advancing with the corresponding deduction prices, you can completely predict which positions might encounter trouble and which positions will be smoother during future trend changes.
So the deduction price corresponding to future closing prices will decrease (deduction price < current closing price), which will greatly benefit the strengthening of the upward trend.
Let's consider a specific example:

In this chart, I have marked the deduction price positions for the current closing price N days ago. 20 days use black labels, 60 days use red labels, and 120 days use blue labels. The yellow label is the current day's closing price.
From the chart, it can be seen that unless there are unexpected developments, Bitcoin's closing price today is still expected to be higher than the closing prices from 20 days ago, 60 days ago, and 120 days ago. Therefore, tomorrow's trend is still expected to be upward. (The automatic program on the chart is shared for free by members.)
Due to the current lack of a bullish trend, there are no particularly obvious examples in daily-level analysis. We will apply the theory at the hourly level. Learn to apply what you've learned!
Let's take another look at this chart:
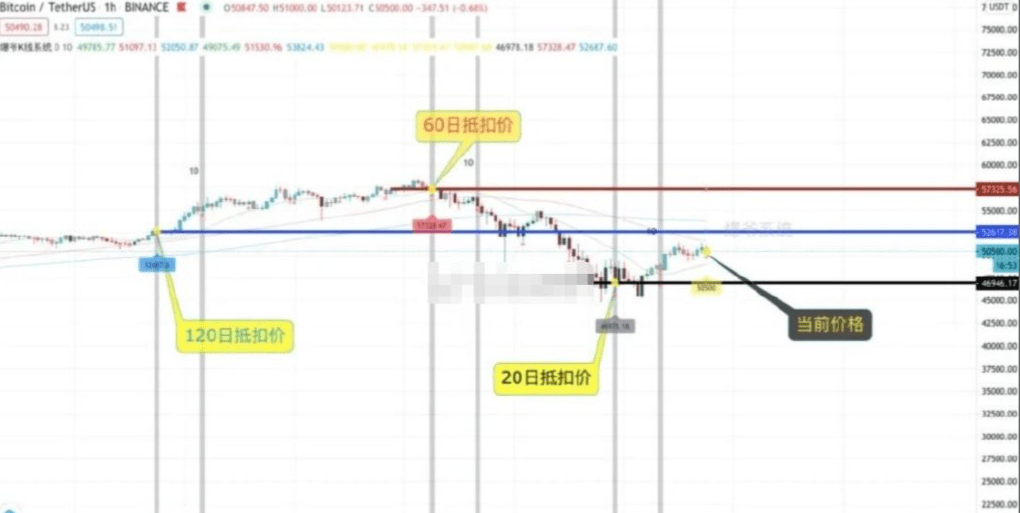
In this chart, I have marked the deduction price positions for the current closing price N hours ago. 20 hours use black labels, 60 hours use red labels, and 120 hours use blue labels. Yellow labels indicate the current hourly closing price.
Currently, the price is above the 20-hour deduction price, and below the 60-hour and 120-hour deduction prices. It can be inferred for the next hour on the hourly K-line chart:
Current price > MA20 deduction price, MA20 line, running upward.
Current price < MA60 deduction price, MA60 line, running downward.
Current price < MA120 deduction price, MA120 line, running downward.
From the chart, we can see that the 60-hour deduction price is gradually moving downward, while the 120-hour deduction price is also gradually moving downward. Therefore, if the current hour's Bitcoin price rises above 57,325, the MA60 line will accelerate and turn upward. If the current hour's Bitcoin price rises above 46,946, the MA60 line will continue to move downward. The MA120 will also continue to move downward.
Accurate to a terrifying degree, ten key points for trading coins.
1. You really don't have to be too greedy, because money in the cryptocurrency market is not endless.
2. You really don't have to be too afraid, because the major players won't let Bitcoin crash.
3. The main force also finds it difficult as they are also afraid of not being able to sell off their positions.
4. Pay attention to coins that show increased volume at the bottom during a decline, regardless of whether they have truly broken through.
5. Maybe just hold on a little longer; the washout will end.
6. Mid-line mentality, heavily invested in one coin, keep a little, sell some on highs, buy some on lows, rolling operation is the best strategy.
7. The most important factors in short-term trading are the K-line, sentiment, heat, and rising speed.
8. Buying coins that are building a base is the safest.
9. Buying coins that are gradually accelerating in price is the most correct.
10. The most valuable application is the divergence of technical indicators, rather than the values of those indicators.

If your account is below 1 million and you want to make money in the short term, there is indeed a timeless trading strategy in the cryptocurrency market, which is also a repeatedly tested 'foolproof technique' that retail investors can easily apply after a glance. I tested it this year!
You don't have to worry about whether you can learn this; if I can seize this opportunity, so can you. I'm not a god, just an ordinary person. The difference between others and me is that others overlook this method. If you can learn this method and pay attention to it during future trading, it can help you earn at least 3 to 10 percentage points more in profit every day.
1. Invest in batches and multiple times: Suppose you have 10,000 yuan, divide it into five parts, and use only 2,000 yuan for each transaction.
2. Test investment: first use 2,000 yuan to buy a coin to test the waters.
3. Add to your position after a decline: if the coin price drops by 10%, add 2,000 yuan to your position.
4. Lock in profits when the price rises: if the coin price rises by 10%, promptly sell part to secure profits.
5. Repeated cycles: continuously repeat buying and selling until funds run out or coins are sold out.
6. Strategic advantages: the benefit of this strategy is that even if the coin price falls, you can respond calmly. By buying in batches, you avoid the risk of a one-time investment. Even if the coin price drops by half, you only gradually increase your position. And each time you sell, you can lock in a 10% profit. For example, if you have 100,000 yuan, each time you invest 20,000 yuan, you can earn 2,000 yuan each time.
Main techniques include:
1. Technical analysis: use charts and indicators to identify trends;
2. Fundamental analysis: pay attention to news and macroeconomic factors;
3. Risk management: set stop-loss orders and diversify investments;
4. Trading strategies: determine entry and exit points and use different strategies;
5. Psychological factors: maintain discipline and patience;
6. Practice and learning: simulated trading and continuous learning;
7. Choose a reliable trading platform.
Short-term trading in cryptocurrencies carries a high risk; be sure to conduct thorough research and risk assessment before trading.
If you plan to trade cryptocurrencies long-term but don't understand the technology and haven't found effective trading tips, you might as well try this super simple 'foolproof' strategy. Even if you are a complete novice, you can easily get started with a success rate of up to 80%. Whether buying or selling coins, just follow the instructions.
First, you need to pick those coins that are rising or at least stable. Those that are falling or have a clear downward trend should be passed on directly.
Then, divide your money into three parts. When the coin price breaks through the 5-day moving average, cautiously buy one-third first. Wait until it breaks through the 15-day moving average, then buy another one-third.
If it can break through the 30-day moving average, buy the remaining one-third. This step must be strictly enforced; do not be lazy. Next, if the coin price, after breaking the 5-day moving average, lacks the strength to continue pushing towards the 15-day moving average and instead drops down, as long as it does not break the 5-day moving average, just hold steady. If it breaks, sell immediately.
Following the same reasoning, if the coin price breaks the 15-day moving average and then lacks the strength to continue rising, as long as it does not break the 15-day moving average, just hold on. If it breaks, sell one-third first; if the 5-day moving average's portion remains stable, continue to hold it.
If the coin price breaks through the 30-day moving average and then drops, follow the above rules and sell when necessary. Conversely, do the same when selling coins.
If the coin price is high and breaks the 5-day moving average, first sell one-third.
If it stops falling, continue to hold the remaining 60%.
But if the 5-day, 15-day, and 30-day moving averages have all been broken, you need to liquidate everything without hesitation. This foolproof strategy is simple, but the key is to stick to the rules. Once you buy, you must set the rules for buying and selling. Only by strictly following the rules can you make money!

Can trading digital currencies for the short term make money?
Many people say that short-term trading in cryptocurrencies doesn't make money, but in reality, most of the time it is because short-term trading requires a certain amount of time to watch the market and a lot of review work. Additionally, in the cryptocurrency market, both buying and selling incur trading fees, meaning the exchange will deduct a certain fee for both transactions. In this case, we need to consider these costs before calculating returns.
Moreover, in short-term trading, if you misjudge the market, it is easy to turn short-term trades into medium or long-term positions, or even into beliefs. The vast majority of people do not have systematic trading habits, making it difficult to strictly adhere to their own habits, leading to immediate withdrawal once profits are realized. This is not the case; in short-term trading, there are two ways to ensure we can exit safely.
a. We will use a cryptocurrency trading robot to trade, automatically executing 24 hours a day.
b. Set strict buy and sell principles for yourself. Sell immediately when profits reach 30%, buy when it drops 30%, operate manually, and strictly enforce it. As long as you follow trading rules, you won't find yourself in a passive or trapped situation. Of course, the same applies to spot and contract trading; both require strict execution and the establishment of our personal trading system.
Tips for trading digital currencies in the short term:
1. Do not bring any subjective or human directional sense before trading. For every entry, set a stop-loss point or stop-loss condition in advance. Do not care about profits or losses or price levels when entering or exiting the market. For 'ultra-short', only choose the 'hottest varieties' that have the largest trading volume, increasing open interest, and are leading in a rising trend or leading in a falling trend. Do not look at or trade varieties with insufficient trading volume.
2. For 'ultra-short', only look at instant charts, 1 or 3-minute charts, buying and selling order prices, trading volume, and order consumption situation (do not look at any other technical indicators, do not care about price levels).
3. The moving average parameters for the instant chart are: for the 1 or 3-minute chart, the moving average parameters are 5 or 55, 113, and the trading volume line is 5, 34. You can also adjust according to different varieties.
4. Observe the instant chart and grasp the trend of the day:
(1) When the average price line (yellow) is sloping upwards, and the price line (white) is above the average price line, with each wave rising higher than the last, it indicates a current rising trend, and we will primarily go long (only when the price line is too far from the average price line can we consider going short, or give up short opportunities during a rising trend).
(2) When the average price line is sloping downwards, and the price line is below the average price line, with each wave moving lower than the last, it indicates a current downtrend, and we will primarily go short (only when the price line is too far from the average price line can we consider going long, or give up long opportunities during a downtrend).
(3) When the average price line is horizontal and the price line crosses above and below the average price line, it indicates a consolidation or oscillation trend. Do not enter the market, or take both long and short positions.
(4) When you see the price line crossing above the average price line, go long (or close short positions); when it crosses below the average price line, go short (or close long positions). It's best to have a 1 or 3-minute chart, order consumption situation, and trading volume working together at the moment of 'crossing.'
5. Specific entry and exit points depend on the 1 or 3-minute charts and the order consumption situation:
(1) When the instant chart is in a 'rising trend', patiently wait for 1 or 3-minute charts to appear where 'the last candle is a bearish K-line, and it flips to a bullish K-line' or 'while the bearish flips to bullish, the 3 moving averages turn upward.' Enter the market decisively to go long. At this time, sell orders are continuously consumed by buy orders. Even if there are sell orders going down, they are not large or cannot be sustained.
(2) When the instant chart is in a 'downtrend', (shorting is the opposite of going long, and I won't elaborate further here).
(3) Close long positions. If you enter the market when the first 3-minute bearish K-line flips to a bullish K-line, prepare to close the position immediately. The closing timing is: close as long as there is a profit, or if the bullish K-line's rise is diminishing, or if there is a long upper shadow, or if there have been two consecutive bullish K-lines of more than 3 minutes, or if sell orders above suddenly increase, or if there are large sell orders consuming buy orders, while buy orders continuously decrease, or if the 3-minute K-line just had its first bearish flip to bullish, or if it flips to bearish while the 3 moving averages turn downward. At this time, decisively close long positions.
(4) Close short positions (the opposite of closing long positions).
(5) When the instant chart is in a 'oscillation trend', as long as the 3-minute chart shows a bearish flip to bullish, and the 3 moving averages turn upward, go long; if it shows a bullish flip to bearish and the 3 moving averages turn downward, go short.
Follow Su Ge closely, using precise strategy analysis, with large sums of AI big data carefully selected to keep yourself in an invincible position? The market never misses opportunities; the question is whether you can seize them. By following experienced and reliable people, we can earn more!


