


Key indicators: (4 PM May 26 - 4 PM June 2 Hong Kong time)
BTC down 4.4% against USD ($110,200 to $105,400), ETH down 2.7% against USD ($2,580 to $2,510)
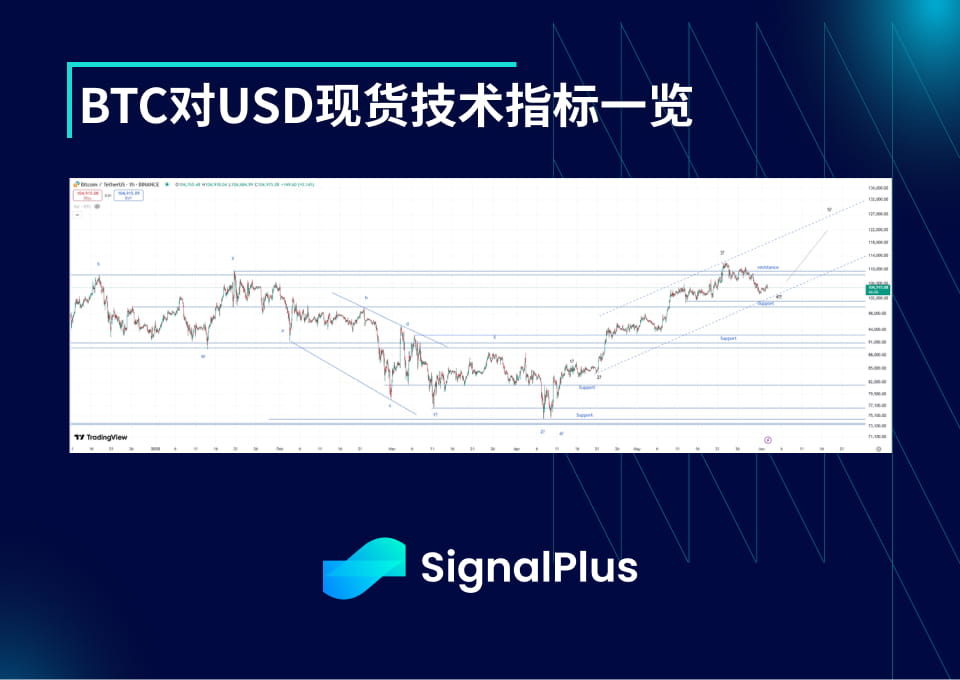
Despite Bitcoin's pullback from its highs over the past week, the price has generally been in a sideways correction and has not affected the overall upward trend. We continue to believe that the market will attempt to break upwards again in the coming weeks or months, potentially pushing us towards the final target of $120,000 to $130,000. Of course, the specific timing is difficult to determine, and if the support level of $99,000 to $101,000 is not maintained, the completion of this upward movement may be delayed until late summer. Currently, we believe that strategically increasing long positions or re-entering can be done at slightly below the support level. If the price does indeed break below $99,000, it may drop to the range of $93,000 to $94,000. Above the price, the first resistance level appears at $108,000 to $109,000, followed by a new high at $112,000.
Market themes
Last week, the U.S. International Trade Court ruled that the Trump administration's use of the International Economic Emergency Powers Act (IEEPA) to impose comprehensive tariffs was illegal, leading to a brief rise in the risk market. However, the stock market did not continue to rise, and this risk rebound that began in early April seems to have reached its limit. Meanwhile, the volatility of various assets has hit new lows, further confirming that the market is exhausted and has undergone significant deleveraging. Overall, the market is looking forward to the upcoming summer holidays, not worried about any possible surprises, while also turning a blind eye to some negative news (such as Trump's tweet on Friday claiming that China violated the trade agreement).
Bitcoin's impressive gains finally lost momentum last week, ending the week with a decline for the first time in two months (based on New York's Friday closing time). In May, total inflows into IBIT ETFs exceeded $6 billion. This downward adjustment was mainly technical, accompanied by some short-term leveraged longs being liquidated, but overall actual volatility remains at a low level. As long as this situation continues, we should continue to see passive inflows during slight declines, especially considering the softness in dollar-related markets due to uncertainty in U.S. policy.
BTC ATM implied volatility

The week before last, the price broke key resistance levels to reach historical highs, followed by a rapid decline due to Trump's comments on EU tariffs, which led to a brief spike in actual volatility. Last week, however, actual volatility continued to decrease. Despite the wide range of price activity last week, the high-frequency actual volatility was only at levels seen in mid-30s. As the price returns to the $103,000 to $106,000 range that had trapped us for several weeks, we anticipate that unless there is an unexpected catalyst, price activity will remain quiet, continuing to suppress actual volatility, ultimately putting pressure on implied volatility and leading to double selling of strike prices outside the price activity range, resulting in the market holding more long Gamma.
The term structure remains steep, and the market is still struggling to support the short positions from June to September with short-term shorts. Meanwhile, as the Las Vegas conference failed to produce any unexpected surprises, actual volatility is also very quiet, and short-term expiration dates have significantly dropped again. This makes it more difficult to continue selling front-end support forwards and further pressures the volatility for June/July.
BTC skew/kurtosis
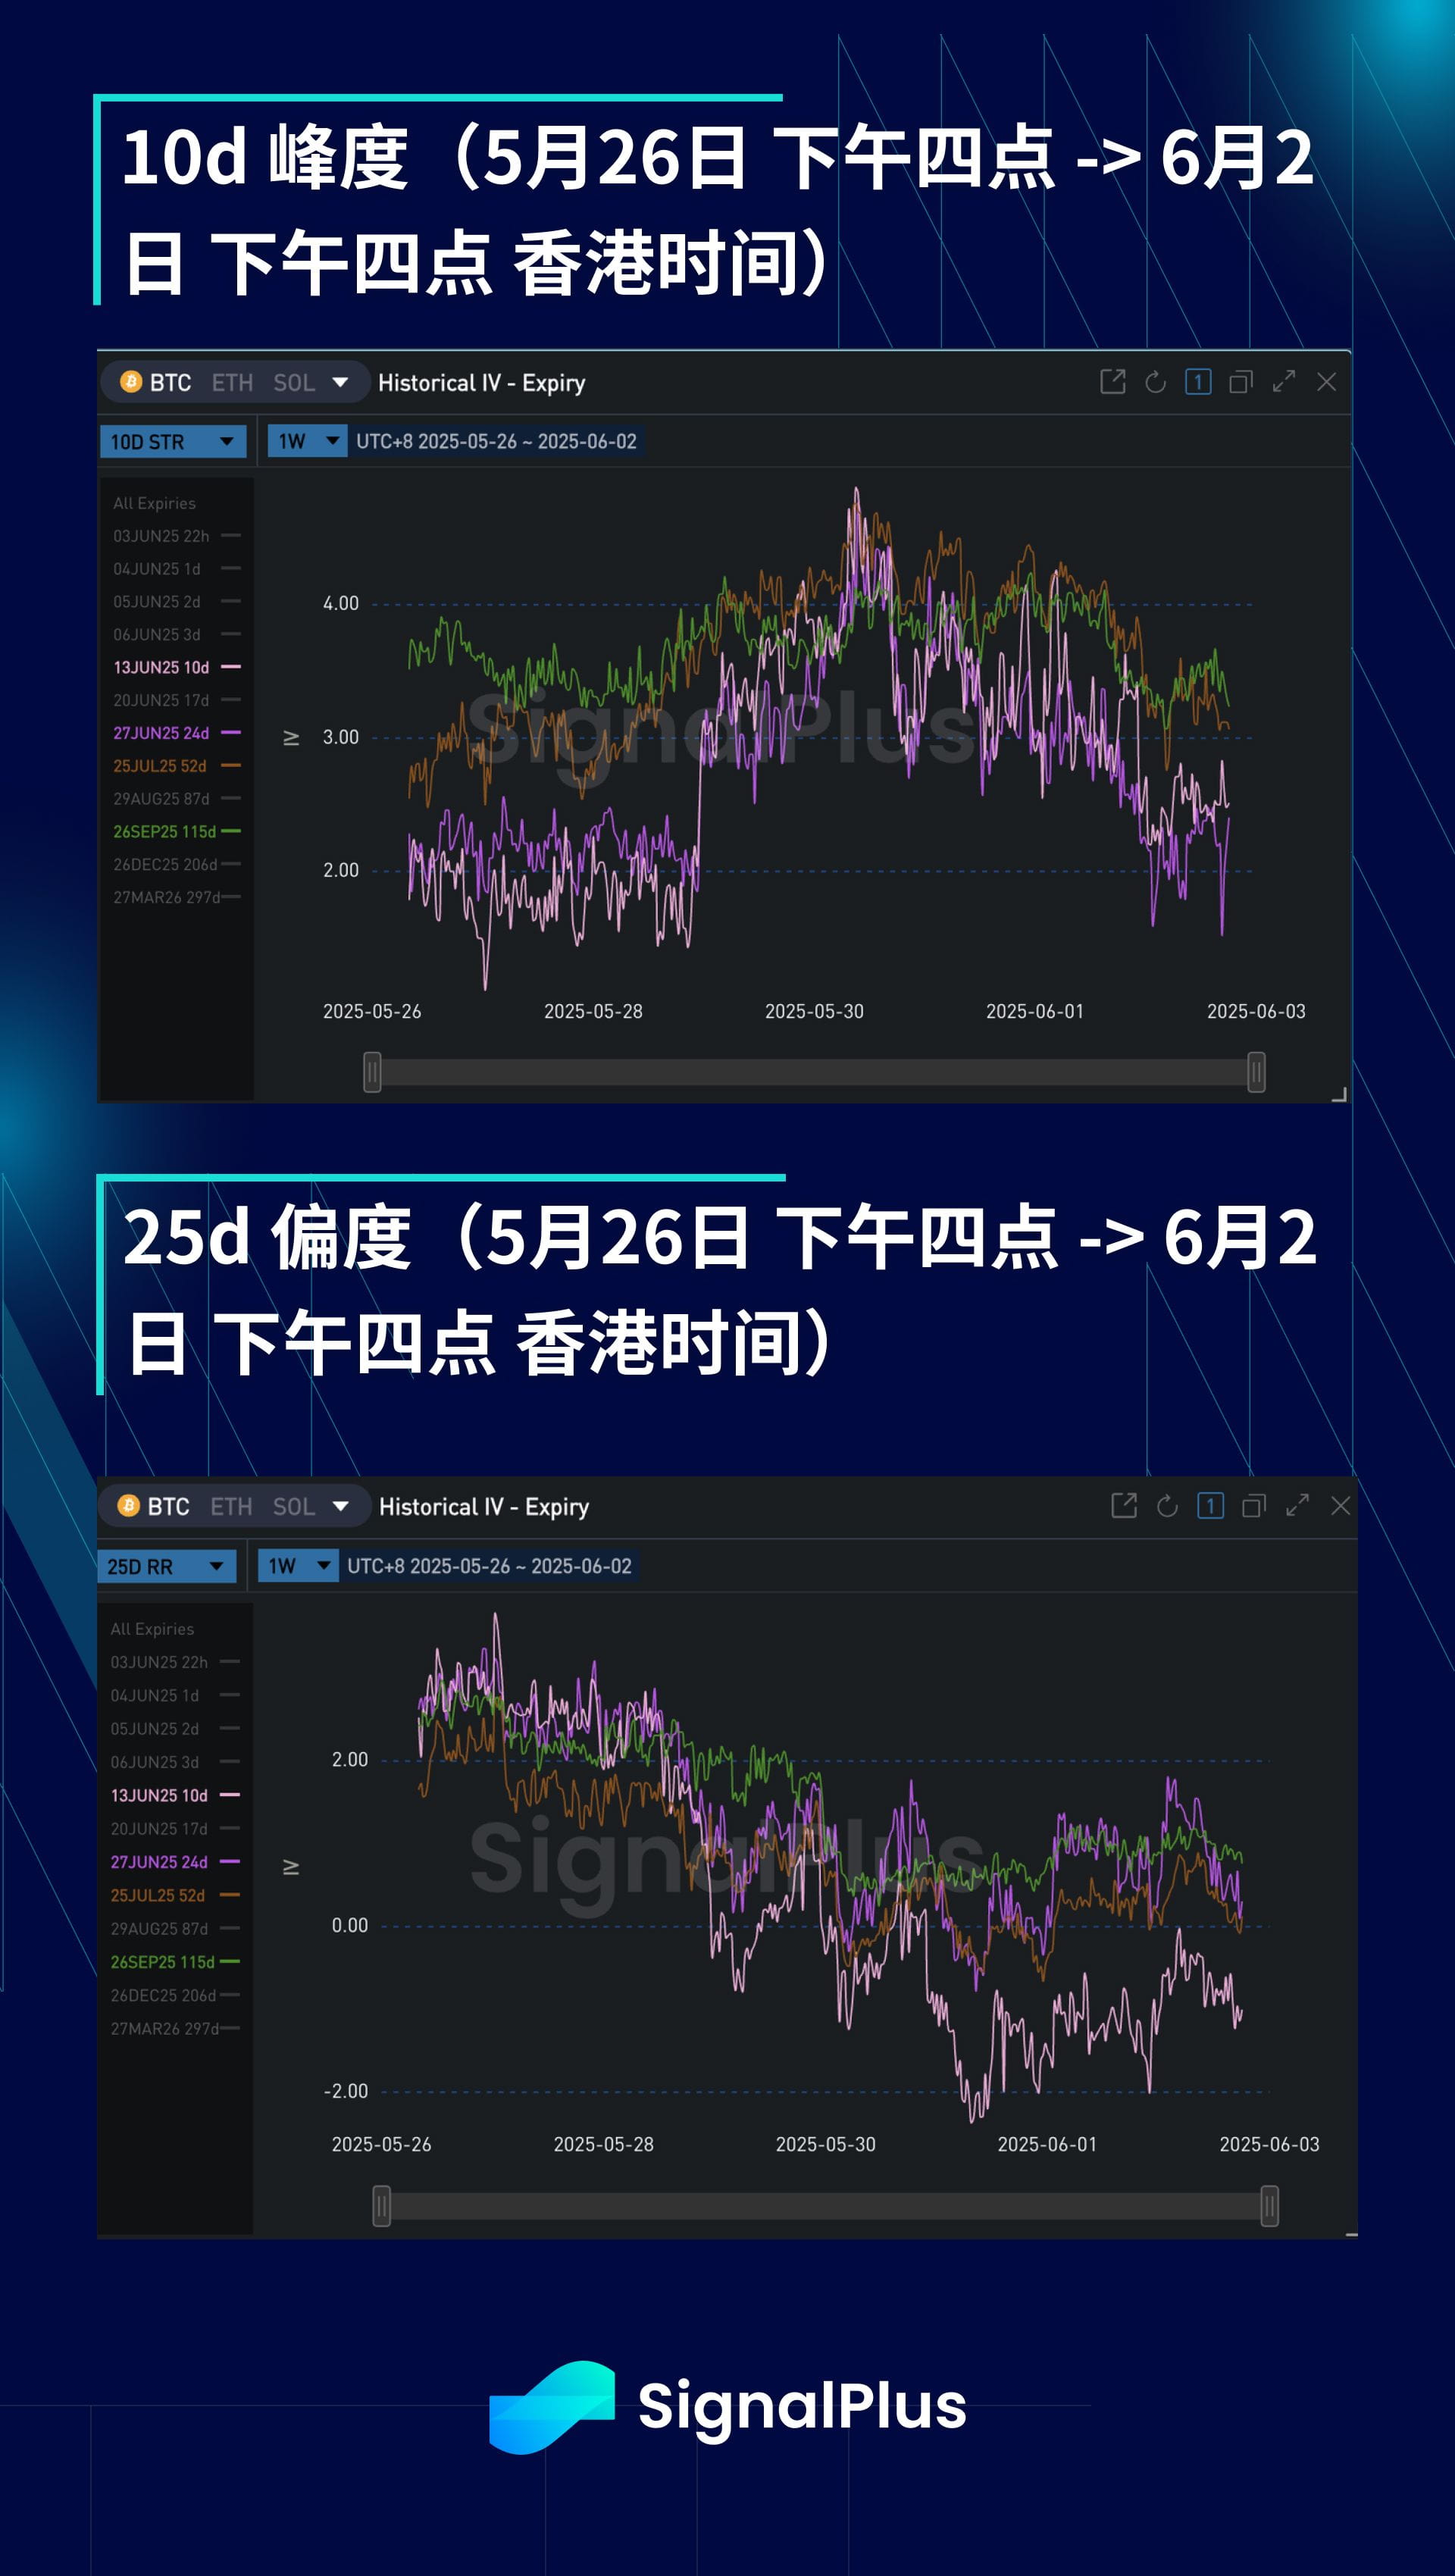
The skew is more downward this week, in line with the short-term market momentum shift. Even when reaching historical highs, the market has shown little interest in buying upside options while continuously selling to reduce exposure during slight price increases. These two factors combined have led to the market's unwillingness to pay a premium for call options. Meanwhile, the market has recognized the danger below the price; if the price breaks below the support level of $99,000 to $101,000 or if the sentiment in risk assets shifts, the price movement could become very volatile.
The kurtosis has generally been sideways over the past week, slightly declining. As there continues to be selling on the wings of the strike prices, the market is struggling to support both the middle strike price and long positions on either side of the price, thus willing to slightly lower sell on both sides to mitigate Theta losses. Considering the currently quite restrained price movements and the sharp rise in actual volatility (as well as implied volatility, skew) after breaking the range, we believe it is very worthwhile to hold long wing positions at this time.
Wishing everyone good luck this week!


