June 2, 2025 On-chain Data Sharing
#BTC #On-chain Big Whales #On-chain Data
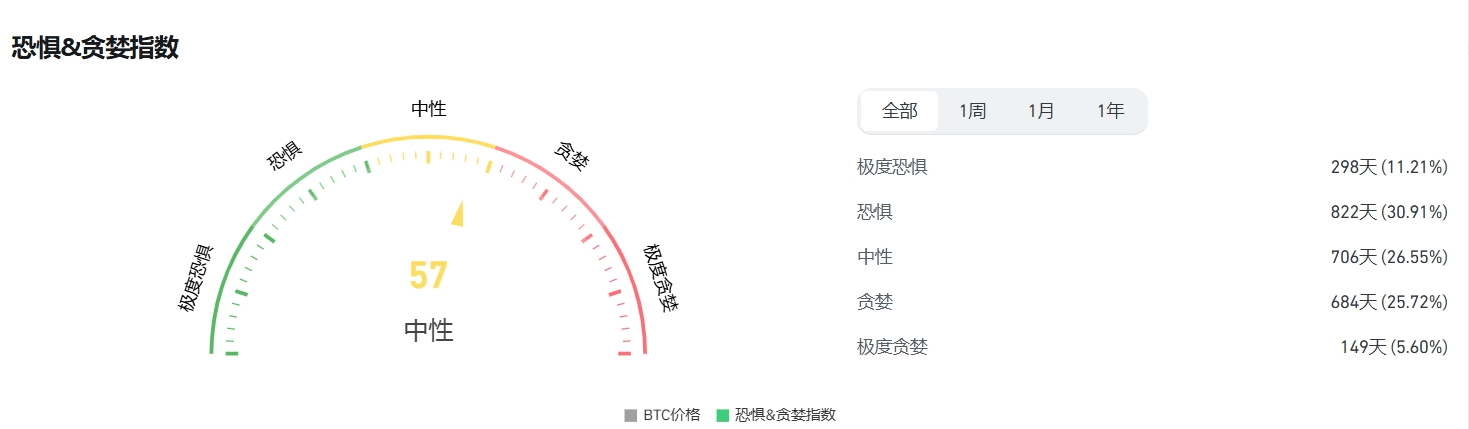
1. Greed and Fear Index Today: 57 Neutral
**Greed and Fear/Greed Index Interpretation
The behavior of the cryptocurrency market is highly emotional. When the market goes up, people tend to be greedy, generating a fear of missing out; when the market goes down, they irrationally sell their cryptocurrencies.
By using the Greed and Fear Index, we aim to help partners avoid making irrational judgments influenced by their own emotional factors.
There are two states:
Extreme fear indicates that investors are overly worried, which may be a buying opportunity.
Overly greedy indicates that investors are overly excited, and the market may undergo a correction.
2. Bitcoin Total Market Share 62.95
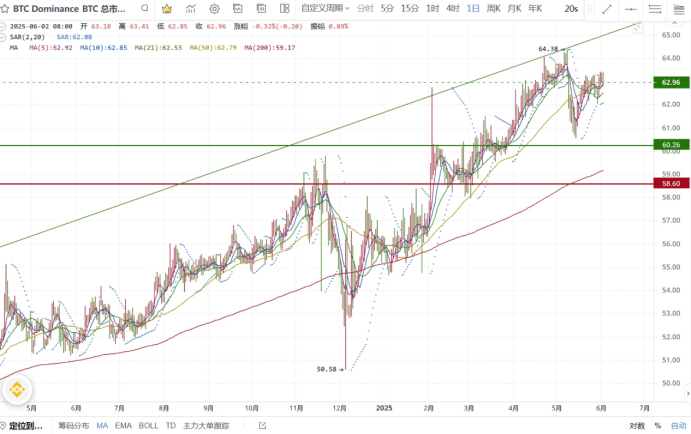
**Bitcoin Total Market Share is a core indicator measuring Bitcoin's relative influence in the entire cryptocurrency market. This indicator not only reflects Bitcoin's short-term market position but also reveals changes in capital rotation, investor sentiment, and macro trends.
Bitcoin Market Share is a 'weather vane' for judging market phases:
Early Bull Market: Market share increases, funds prioritize allocation to Bitcoin.
Late Bull Market: Market share declines, capital rotates to altcoins, triggering 'Altcoin Season'
Market Thermometer: >60% = Risk-off Dominance; <40% = Altcoin Frenzy Period.
Capital Flow Chart: Reveals institutional and retail allocation preferences (Bitcoin → Stable, Altcoins → High Risk High Return)
3. Bitcoin and Ethereum Trading Pair 0.024387
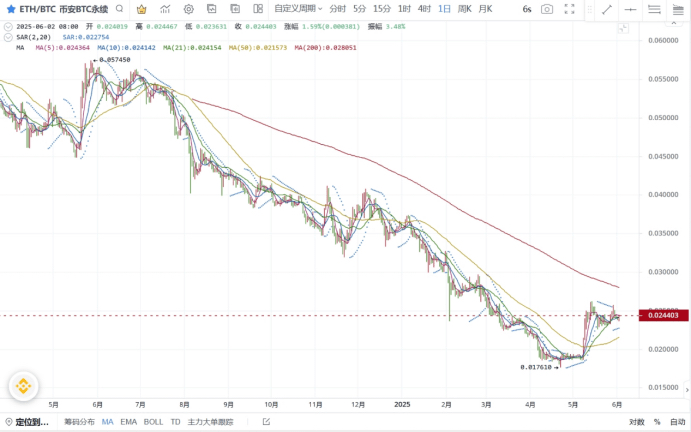
**The Bitcoin/Ethereum trading pair is the 'risk thermometer' of the cryptocurrency market:
Ratio Increase → Market prefers high-risk assets (Signal for Altcoin Season to start);
Ratio Decrease → Capital seeks safety in Bitcoin (Bear Market or Early Bull Characteristics).
4. ETF Inflow and Outflow Data ETF data shows net outflow
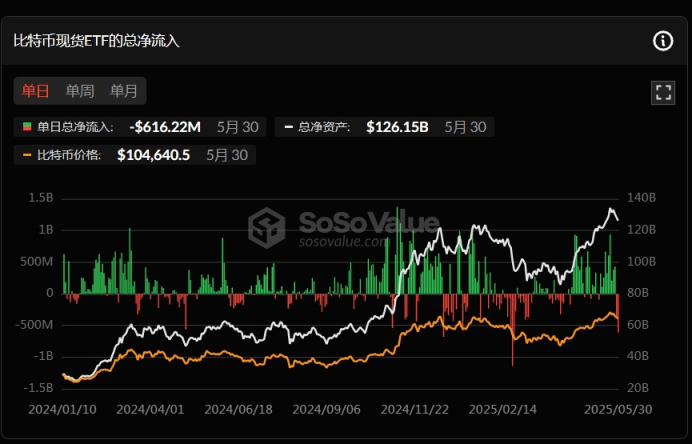
**ETF Inflow and Outflow Data Explanation: The inflow and outflow data of Bitcoin ETF is a core indicator for tracking institutional sentiment, market trends, and capital rotation.
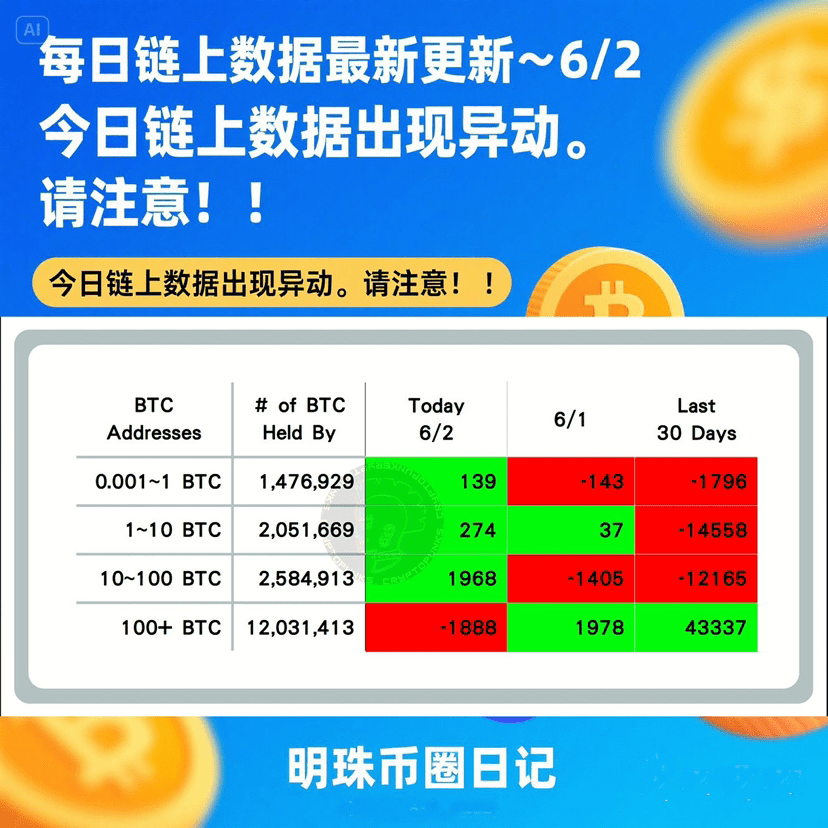
5. On-chain BTC retail, large holders, and institutional buying and selling data statistics Net outflow from big whales
Today's Bitcoin On-chain Data 2025/6/2👇 $BTC100+ Big Whales Net Outflow of BTC -1888, all retail large holders bought in (extreme market sentiment), when extreme market sentiment occurs, it needs to be closely monitored!!!
Thanks to @TradingPunk for providing data organization and sharing
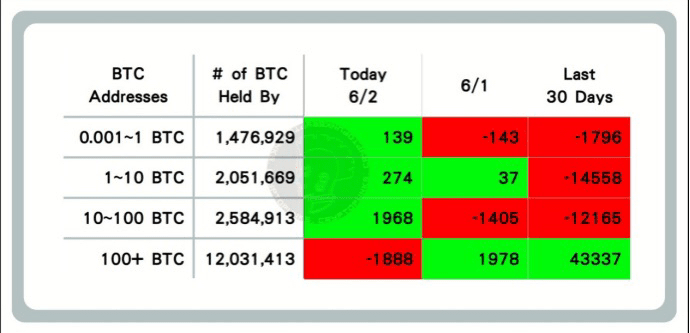
Data Explanation: Represents the increase or decrease of on-chain flow for ≤ 1 BTC, 1—10 BTC, 10—100 BTC, 100+ BTC. This data can reflect market sentiment of retail, large holders, and institutions.
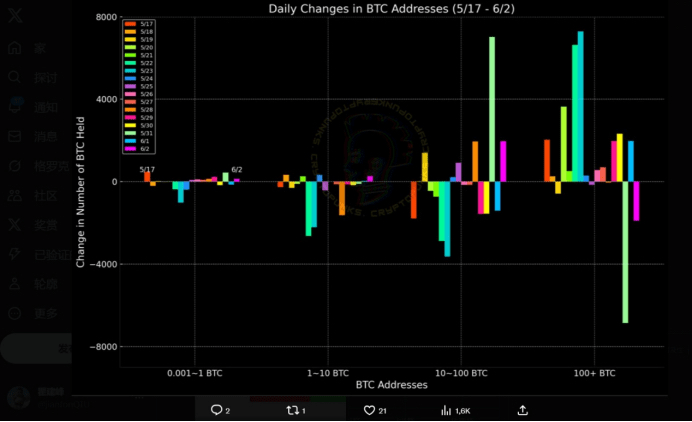
Data Explanation: This data reflects the increase or decrease of on-chain flow for ≤ 1 BTC, 1—10 BTC, 10—100 BTC, 100+ BTC within a week. This data can intuitively reflect the BTC flow trends of retail, large holders, and institutions.
When on-chain data shows an extreme situation, a reversal often occurs (e.g., if there is a large buy-in from big whales holding over 100 BTC while others are selling, the probability of Bitcoin rising greatly increases, and vice versa). This should also be analyzed in conjunction with other on-chain data and technical indicators.
6. MVRV Realized Market Value Ratio MVRV > 1
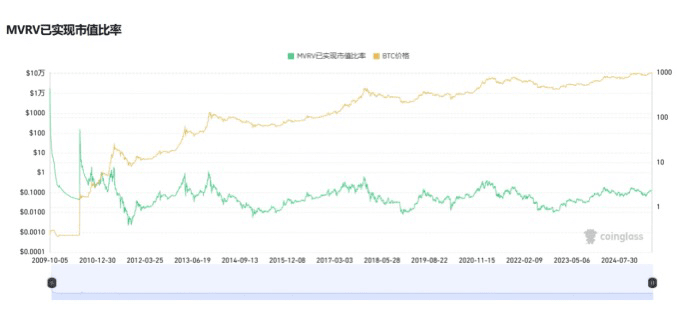
**MVRV Realized Market Value Ratio Indicator Explanation: The MVRV Realized Market Value Ratio is an indicator used to assess the cryptocurrency market (especially Bitcoin). This indicator helps partners determine whether assets are overvalued or undervalued and identify potential market cycle tops and bottoms.
MVRV > 1
When the ratio is greater than 1, it indicates that the market price is above the realized price, meaning that most holders are in a state of profit. This may indicate that the market is overheated, especially when the MVRV reaches historical highs, which may signal a market top.
MVRV < 1
When the ratio is less than 1, it indicates that the market price is below the realized price, meaning that most holders are in a state of loss. This may indicate that the market is undervalued, especially when the MVRV reaches historical lows, which may signal a market bottom.
7. Altcoin Season Index 18 Is it Altcoin Season: No
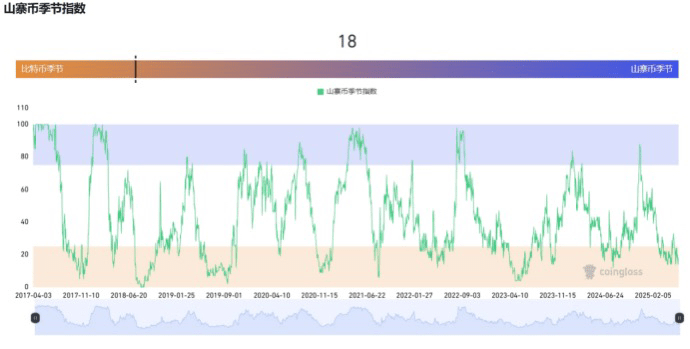
**Altcoin Season Index Explanation: The Altcoin Season Index is an indicator used to measure the performance of non-Bitcoin cryptocurrencies in the cryptocurrency market. It is typically used to determine whether altcoins are outperforming Bitcoin over a specific period, helping investors understand market trends and investment opportunities.
8. USD Inflow into Cryptocurrency Market Net Inflow
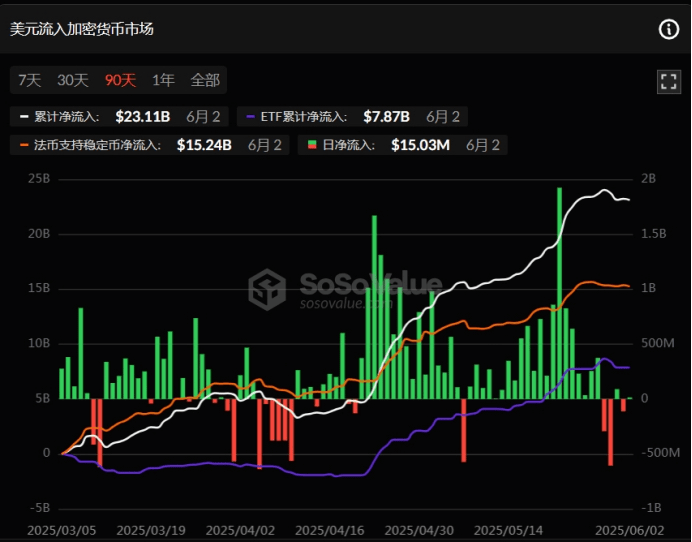
9. Fiat Currency Supporting Stablecoin Net Inflow (USD Stablecoin with Market Cap >100M) Net Inflow

The above data represents a perspective from on-chain data to predict BTC volatility trends and market sentiment, not representing any investment advice. Please make careful decisions!!
I am a pearl, 🎶 follow me, I share on-chain real-time data and dynamics every day, helping partners predict decisions, exciting moments you can't miss, welcome to comment and discuss.