
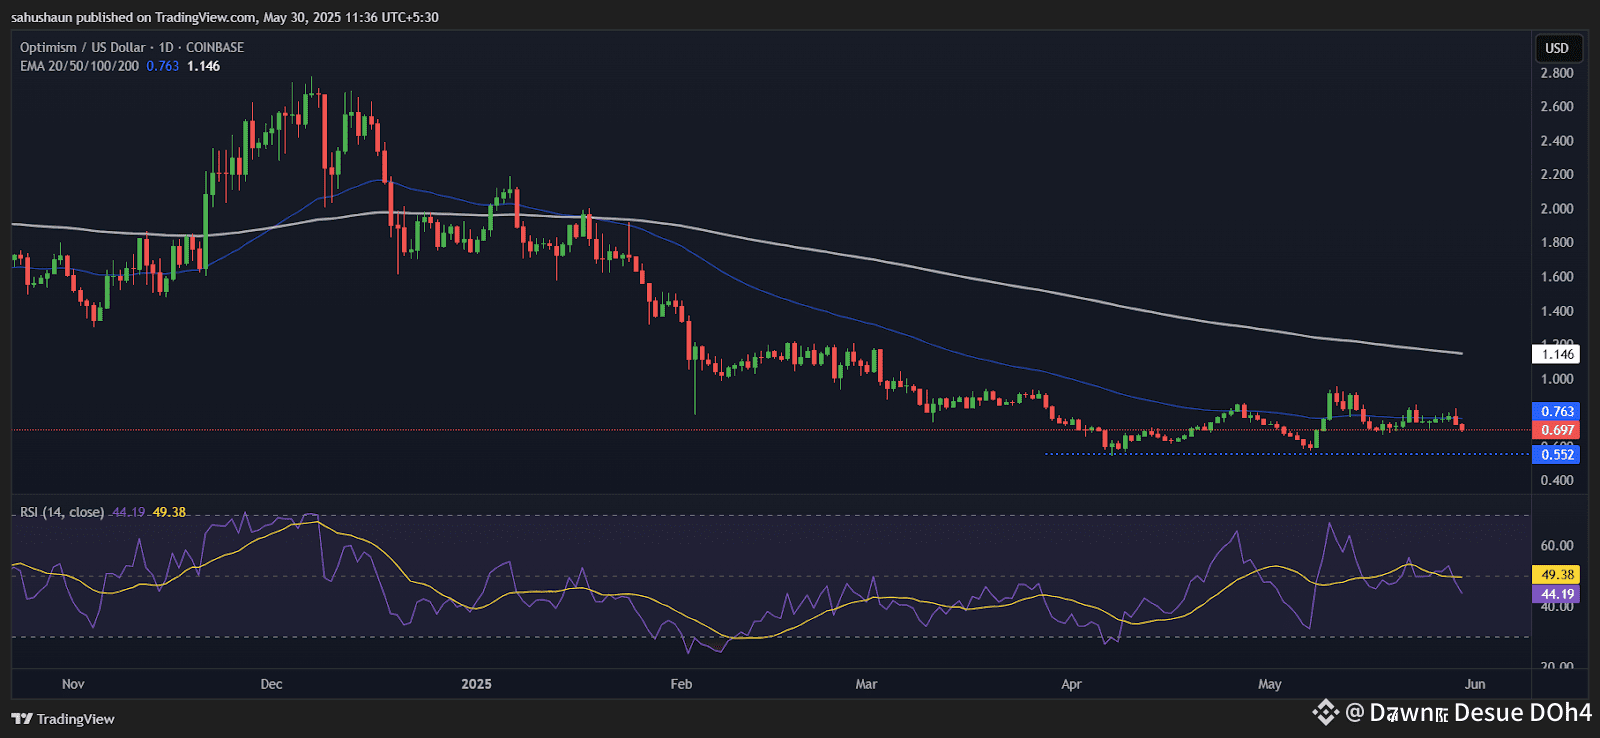
OP remains trapped in the descending channel since the late 2024 peak, currently at $0.696
All EMAs are positioned above the price, with a 50 EMA at $0.763 acting as immediate resistance.
RSI at 44.19 shows limited bullish conviction while MACD hovers near the zero line.
OP is trending downward, the cryptocurrency has been declining steadily since reaching $2.50 in late 2024. Optimism price has formed a clear descending channel that has continued into 2025.
All moving average indicators are currently showing a bearish pattern. The 50-period EMA is at $0.763 and above the current price. On the other hand, the 100 and 200-period EMAs are all falling, with the 200 EMA at $1.146.
The presence of this alignment signals that sellers are still leading the market in the medium to long run. The fact that the price hasn’t bounced above the shortest-term moving average means it is likely to remain weak in the short term.
Moreover, according to CoinMarketCap data, at the time of writing, OP price is trading at $0.696 with an intraday decline of 11%, indicating bearishness. The daily trading volume is at $251.38 million, and the volume-to-market ratio is 21.17%.
What’s Next in Optimism (OP) Price?
The RSI is currently at 44.19, which is in a neutral range and has recently moved away from oversold territory. It means that April’s relief from selling pressure did not lead to a major shift in the market’s favour. The RSI has not crossed above 50 during recent attempts to recover, which suggests weakness is still there.
The MACD histogram is showing a mixed signal, as the indicator is close to zero at -0.005. Although the sharp drops earlier in the year are less frequent now, the absence of a bullish crossover means buyers have not yet gained control. The social sentiment indicator also shows that people are feeling pessimistic about the asset, as the indicator is -0.217.
Resistance levels to watch out for are found at $0.763 (50 EMA), then at $1.00, and finally at $1.146 (200 EMA). There is not much support, as the price is now at its lowest level in many months. If the price falls below $0.65, it might lead to more selling and a drop to $0.50.
If OP wants to reverse, it must regain the $0.80 level. It should show strong buying for some time above the 50-period moving average and see improvements in momentum and social indicators.
