2025 Bull Market, Investment Strategy for Altcoins! As altcoins show subtle movements and market sentiment fluctuates, the altcoin season becomes the focus again. Historical patterns show that when Bitcoin's dominance (BTC.D) declines, funds flow into altcoins, driving a bullish trend.
1. Factors Triggering the Altcoin Season
Bitcoin's dominance is decreasing: As Bitcoin's growth slows, funds are flowing into altcoins, and when BTC.D falls below 50%, the altcoin season effect becomes more pronounced; current funds are already shifting towards altcoins.
Market sentiment switch: As Bitcoin's growth stabilizes, investor risk appetite increases, chasing high-return altcoins, with the MEME craze and surges in coins like TURBO attracting significant funds in the second half of the year.
Funds reallocation: After Bitcoin's market stabilizes, funds flow into DeFi, NFT, Web3, and other areas, with tokens from projects like AAVE being favored.

2. When does the altcoin season arrive?
Reference indicators: BTC.D below 48% and the altcoin season index approaching 95 indicate an emerging trend of funds flowing into altcoins, signaling the onset of the altcoin season.
Monitoring hot fund flows: The rise of MEME coins brings in funds, with older coins like XLM also increasing, and short-term fluctuations in sentiment release signals for the altcoin season.
3. Methods to seize opportunities in the altcoin season
Focusing on sector leaders: Leading projects in areas like DeFi, NFT, AI, such as UNI, $SOL, etc., with strong fundamentals and innovation, are likely to attract funds and perform well during the altcoin season.
Diversifying investments to mitigate risks: Avoid concentrating investments in MEME coins without application support; prioritize projects with technological innovation and community backing to spread risk.
Combining technical and fundamental analysis: Utilize technical indicators like RSI and volume alongside fundamental analysis of projects to screen for promising altcoins, balancing market trends with long-term value.
Tracking emotional dynamics: Monitor market sentiment in real-time through social media, news, etc., and adjust investment strategies promptly, maintaining flexibility during rapid fund inflows.
Reducing exposure at high levels for profit preservation: Altcoins can be highly volatile, so set profit-taking and stop-loss levels; especially control risks for short-term surging coins and lock in profits.
4. Recommended Potential Tokens
$PEPE: Representing the MEME coin in 2024, has increased over 1000% in a few months. With a strong community and high attention, it still has room to rise.
$TURBO: Also a MEME coin, has increased over 500% this year, with an active community and market interaction bringing investment potential.
$ARB (Arbitrum): Represents Ethereum Layer 2 solutions with immense potential under the backdrop of increasing Ethereum transaction volume.
$AAVE (DeFi): A leading token for the DeFi lending platform, expected to enter a new cycle as demand for DeFi grows with the market.
$UNI (Uniswap): The largest decentralized exchange token, has not yet reached its historical peak, with room for growth as trading demand rises.
$SOL (Solana): Fast transaction speeds and low fees, performing well in the DeFi and NFT space, still has upward potential from its historical peak.
$BNB: The native token of Binance, with a wide range of applications, supported by the platform, still has potential as DEX and DeFi demands grow.
$SUI: An emerging Layer 1 project known for strong scalability and fast transactions, attracting attention from developers and investors, expected to shine in the smart contract field.
$GOAT: An emerging MEME coin with high user engagement and increased market attention, though speculative, it is worth noting.
5. Risks and Opportunities
The opportunities in the altcoin season are plentiful, but risks are also high, as many altcoins lack long-term value support and exhibit extreme price volatility. Investors should prioritize tokens with real applications, community support, and technological innovation, and avoid blindly chasing prices.
Having traded in the crypto space for over ten years and experiencing three bull-bear cycles, I can confidently say that the best time to make significant money in the crypto space is during a bull market! Just catching one wave is enough. Last month, I turned 4 million into 10 million with just one opportunity!

How to confirm a bull market in the crypto space? What signals indicate a potential end? Let the veteran tell you.
History may not repeat itself, but it is often strikingly similar. Looking back at the bull markets of 2017 and 2021, each bull-bear cycle corresponds with Bitcoin halving events.
According to this pattern, 2025 will be a crazy bull market, and 2026 will enter a bear market. But could the ETF change the cycle and bring the bull market early?
Currently, there is no indication. Only when Ethereum also breaks through the historical high of 4800, and Bitcoin stabilizes around 70,000, can we confirm that the bull market has begun.
Once the bull market is confirmed, please remember not to change positions.
1. Why not switch back and forth based on market conditions in real-time?
Firstly, most people's operations really can't keep up, so don't doubt it; secondly, for beginners, as long as they select the right target, not changing positions is already great wisdom.
2. Previously, when a coin was stagnant, some people began to feel anxious, asking why it wasn't rising while others were.
If a coin is one of the hot leaders in a bull market, stagnation does not necessarily indicate a problem; it could simply mean it rose too quickly earlier, leading to stagnation or even a significant pullback.
3. At this time, rather than being anxious, one should instead enter heavily - the longer the pullback lasts, the more impressive the subsequent performance.
As expected, just a few days after the anxiety, it began to explode. As long as you choose coins according to the above requirements, as long as the bull market hasn’t ended, it can’t stagnate. 4. If there’s a short-term stagnation, that’s a great buying opportunity, just like a spring being compressed - the tighter it is pressed, the greater the force afterward. The so-called sector rotation and catching up all follow this logic.
5. If something is good, you can see it, and others can see it too; just wait patiently. When the time comes for it, the previous stagnation will just place it in a value gap, and at this time the incoming funds will be particularly large; this is the correct explanation of 'the longer horizontal, the higher vertical.'
Only buy, don’t sell. 1. In a bull market, any selling or short-term trading will ultimately lead to regret. The coins you hold will definitely decrease because the cash you hold will increasingly be unable to buy the original amount.
2. Large fluctuations seem to have a lot of profit potential, leading to impatience to trade short-term. However, due to the possibility of sudden surges in a bull market, when it first starts, you won't want to miss the opportunity and will hope to wait for it to drop before entering, ultimately missing the entire bull market for small profits.
3. In fact, a bull market is very simple: buy on dips, stop when it rises, control your hands, only buy and don’t sell. A bull market usually lasts for several months; I don't believe this amplitude won’t be enough for you. For the coins that are meant for short-term trading, trade them; for long-term ones, hold them well.
So how does a bull market end? From the external public opinion: 1. News headlines. Someone gets out of jail and becomes a billionaire, just because he hid 108 bitcoins in his fingernails.
A certain big influencer announces he is Satoshi Nakamoto and claims he has lost his private keys... Bitcoin, the crypto space, and wealth myths flood the headlines.
2. Global popularization. Various uncles and aunts, taxi drivers, all begin to explain blockchain, discuss Satoshi Nakamoto, talk about L2, and encryption algorithms... Major media outlets start discussing Bitcoin's value and the role of blockchain.
From the on-screen perspective...
A bull market roughly divides into several stages:
1. BTC dominance rises, draining altcoins; BTC and the Bitcoin ecosystem will continue to be strong.
2. ETH takes over and skyrockets, with hot altcoins rising alongside Ethereum, such as AI, Web3, L2, blockchain games, the metaverse, new public chains, and BTC ecosystem sectors.
3. All coins rise, with scenarios where assets double overnight; the MEME performance season sees countless altcoins, dog coins, and air coins soar to the point of questioning life.
Daily dozens of times, various wealth myths, more than small ads, FOMO reaches its peak.
4. A full-blown collapse, major coins experience significant pullbacks, altcoins crash, dog coins go to zero, entering the bear market phase.
Lastly, please remember, during the early stages of the bull market, do not sell coins. Being stuck lasts at most about half a year; when the bull market comes, even rubbish can soar to the sky. The overarching principle of the entire cycle is to ensure that you have cash in the bear market and coins in the bull market.
This set of 'smart money' strategies in the crypto space, verified through my years of practical experience, has achieved an average win rate of 80%, which is quite a rare achievement in the crypto trading sphere.
Without further ado, let’s get straight to the valuable content!
Price action is a very simple yet practical technical analysis technique that seeks to identify the dominant forces in the market by reviewing the exchange of buy and sell orders behind the price. In recent years, some Western traders have refined the concept of 'smart money' to improve price action analysis, marking a milestone innovation in the price action analysis system.
'Smart money' refers to institutional investors or large retail investors who often conduct more thorough research before making decisions, sometimes possessing insider information that can significantly influence outcomes, hence the term 'smart money.'
In the smart money strategy, the fair value gap (hereafter referred to as FVG) is a core concept that plays a crucial role in confirming breakouts, retracements, etc. In today's article, I will introduce the logic behind FVG and its practical application.
FVG: A temporary state of imbalance between buyers and sellers.
FVG is also known as the imbalance zone, consisting of three candlesticks, with the middle candlestick typically being a large candlestick with a long body and short wicks. When it appears in a downtrend and is a bearish candlestick, it is a bearish FVG; conversely, it is a bullish FVG. The type of the first and third candlesticks does not matter.

From the above chart, two typical features of this pattern can be observed: First, candlestick 2 is a large bullish or bearish candlestick; second, there is no overlapping wick between candlesticks 1 and 3, and this area is referred to as FVG.
The logic behind FVG is as follows:
When a certain sudden favorable news occurs in the market, investors rush to go long, leading to an excessive number of long positions relative to short positions (buyside imbalance sellside inefficiency, or BISI), which leaves a large number of unfilled long orders. When the price touches the FVG again, these unfilled long orders will be executed, triggering a price rebound.
Conversely, when a certain sudden negative news occurs, investors rush to sell, leading to an excessive number of short positions relative to long positions (sellside imbalance buyside inefficiency, or SIBI), which leaves a large number of unfilled short orders. When the price touches the FVG again, these unfilled short orders will be executed, triggering a price drop.
In other words, when the price adjusts back to the FVG area, there is a high probability that it will return to the trend that existed before the adjustment.
To deepen everyone's impression, I have identified several typical FVGs using technical indicators:
The daily chart of USOIL shows several typical bearish FVGs in the black areas indicated by the arrows. The first FVG is composed of two bearish candlesticks and one bullish candlestick. The second consists of three consecutive bearish candlesticks, with the area between candlesticks 1 and 2 forming an FVG.

The daily chart of the Nasdaq index shows a typical bearish FVG in the blue area indicated by the arrows. During the downtrend, three consecutive FVGs appeared:

The daily chart of gold shows the blue area as a bullish FVG and the black area as a bearish FVG.

After understanding the FVG pattern, we will explore its practical use from the perspectives of breakouts and reversals.
FVG's trend-following operation: confirming breakouts and seeking better entry prices.
When an FVG appears, it signifies a significant imbalance in the market, and the direction has become relatively clear. If the FVG area encompasses structural breakouts at previous swing highs and lows (break of structure, abbreviated as BOS), we can be more confident that an effective breakout has occurred here:

In the above chart, effective FVG areas are formed when the price breaks through swing highs A and B, which are two typical uses of FVG in practice.
The first use involves the price breaking through swing highs while forming an FVG, confirming an effective breakout. However, it is essential to note that the breakout point must be included in the FVG area, meaning the non-overlapping part of the wicks of candlestick 1 and candlestick 3. If it appears within the wicks of candlestick 1 or 3, it cannot be considered a BOS or FVG overlap.
The second use helps us find better entry prices for retracements. When an FVG appears, the price is likely to retrace, and the target price for the retracement is the FVG area. In the above chart, the lowest point of the price retracement just happened to be near the bottom of the FVG area.
Similarly, the bearish FVG in a downtrend has similar uses:

In the above chart, the price broke below swing lows A and B, forming an effective FVG area, with points A and B both contained within the FVG area, and the impactful parts of candlesticks 1 and 3 not overlapping. In the subsequent rebound, particularly in FVG-A, the price rebounded to this area before turning down again. In FVG-B, the price quickly pulled back to the FVG area after breaking through and then continued to decline.
However, it should be noted that price adjustments do not always reach the bottom or top of the FVG area; for instance, in recent interpretations of the gold market, we also used the FVG area to point out resistance positions, and this time the rebound did not reach the top of the FVG area.

Here we can also pay attention to whether the price has returned to the FVG-B area in the chart; can this area better serve as a resistance?
In theory, when the price first touches the FVG, the resistance/support is often strong, but when it touches a second time, the resistance/support tends to weaken as unfilled orders have been digested. Historical trends show that price movements often align with this theory.
In practice, we also need to pay attention to the mutual confirmation of FVG across different cycles. Sometimes, price retracements to FVG may not be reflected on a larger time frame, but may have occurred on a smaller time frame. The following chart is the daily chart of GBPUSD, where we can see the FVG area between 1.2691-1.2741.

If you open the 4-hour chart, you can find another FVG area, located between 1.2707-1.2733. Here we observe that during the recent retracement, the price rebounded right after touching the bottom of the FVG area at 1.2733, which acted as support twice.
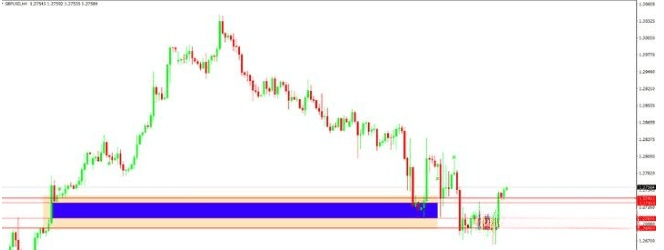
Attentive investors may have noticed that the FVG area in GBPUSD, as well as the FVG area on the earlier 4-hour gold chart, has now been filled. So, how should we operate when such an FVG area is broken or filled? This leads us to the next topic: IFVG.
IFVG: Seeking high-probability reversal trading opportunities.
IFVG stands for inverse FVG, meaning the price has filled the previous FVG area. Once an FVG area is filled, the market structure may show changes; the previously resistant FVG area turns into support, so IFVG can be seen as a basis for entering reversals or exiting the original direction.

The above is a 1-hour chart of gold (the FVG area appears on the 4-hour chart, but for ease of observation, we are using the 1-hour chart for analysis), where an FVG area appears between 2401-2405.
The price failed to test the area at point A, but soon after made an effective breakout. It is worth noting that when the price broke through point A, it did so in an FVG manner (the black area, between 2392-2403), which then led to a rebound.
However, it is important to note that not all IFVGs will constitute reversal trading opportunities, as FVG is merely an auxiliary signal, not the main signal. There is a very important prerequisite for conducting IFVG reversal trades:
Has the price structure changed? For example, in the above 1-hour gold chart, after breaking the swing high A, the price shows higher highs and higher lows, indicating a trend reversal, known as a CHOCH in smart money strategy, where the chances of a reversal trade are higher.
Next, we will continue using the 1-hour gold chart as a case study.

In the above chart, the price of gold shows progressively higher lows, and the swing high is broken, meeting the conditions for CHOCH. Meanwhile, the price has broken the previous FVG area, forming an IFVG. Will gold continue to rise after this pullback? This is something to keep an eye on.

What strategies are there for hoarding coins in the crypto space?
There is a phenomenon in the crypto space where traders account for a significant proportion, while those who hoard coins are few. However, in the end, those who can truly profit in the crypto space are often the hoarders.
Essentially, trading coins involves buying and selling for price differences through short-term transactions, while hoarding coins involves recognizing the investment value of a certain coin, continuously buying and waiting for appreciation.
Due to the low barrier to entry for trading coins and the simplicity of operation, many investors, especially beginners, prefer trading coins over hoarding them. This phenomenon is prevalent across the entire investment market, where most people choose short-term trading.
Once they taste a bit of success, they become obsessed with trading coins. People inherently have a gambler's mentality; just earning a little makes them overconfident and increase their positions. Conversely, losing a bit makes them anxious, their mindset nearly collapses, leading to a vicious cycle, ultimately resulting in liquidating their positions.
Hoarding coins requires more skill, needing a correct judgment and understanding of market trends; once the timing for hoarding is right, significant profits can follow, although the transition from a bear market to a bull market may take longer, requiring patience.
Today, I, A Gui, will talk about strategies for hoarding coins.
First, do not hoard too many types of coins; try to keep it under six; ideally hoarding three to four super mainstream coins that are unlikely to die off. If you really can’t decide or don’t know how to choose, just hoard Bitcoin.
Second, hoarding should be moderately diversified; don’t hoard just one type; consider three to six types to avoid the risk of black swan events.
Third, refer to the types of coins that big players are hoarding; they can provide some reference value because many of these big players have experience from 2012 to 2013.
Fourth, the method of hoarding coins should ideally involve dollar-cost averaging, starting to invest during Bitcoin's long-term low-volume consolidation or the early stages of its arc bottom, while trying to avoid downward trends.
Fifth, maintain a pessimistic expectation when hoarding coins; hoarding during the bear market or early bull market is about buying the dips and being trapped, so the perspective should be long-term, aiming for a large harvest in the bull market two years later. Thus, use spare money that does not affect your daily life. Even with Bitcoin, a drop of 40% to 80% is possible. However, as long as you are hoarding Bitcoin, there will be a day when it rises back up.
Sixth, do not use leverage or only use very little leverage for hoarding coins. Currently, the contract leverage on centralized exchanges is rife with unfairness and insider issues; hoarding coin fans should avoid leverage, as it can easily lead to sudden liquidation. If you must use leverage, make sure it is in spot trading.
Three things long-term hoarders should avoid at all costs
1. Jumping in all at once, hoarding coins at too high a price.
To hoard long-term, a good mindset is crucial. If you do not dollar-cost average but instead make a single high-position purchase, no matter how you comfort yourself about it being long-term investment, the anxious mood before floating losses is still hard to shake off.
2. Self-doubt and giving up halfway.
Every bear market sees very few people entering the market. Even if Bitcoin's asset value is 'cut in half' or even 'cut at the feet,' the number of people willing to buy Bitcoin at $3,000 is far fewer than those willing to buy at $10,000. Dollar-cost averaging also faces trials. The biggest problem in such situations is not that the market is bearish, but whether entering the market was a result of one's own thoughtful decision or just hearing about the 'success stories' of big players or friends. For long-term investors, it is essential to have your own views, execute according to your plan, and not fear swimming against the tide. Recognizing the situation while integrating your own understanding for judgment is critical, ultimately validating your insights through actions.
3. Poor custody leading to lost private keys.
Many long-term hoarders eventually forget their private keys. Although Bitcoin is valuable today, millions of Bitcoins are unrecoverable due to various reasons.
The difference between trading coins and hoarding coins is akin to the difference between short-term and long-term stock trading. Holding onto a stock for the long term typically carries less risk than short-term trading. Long-term holding of Bitcoin is likely to be profitable, while short-term trading carries significant risks and can lead to total loss. Hence, it is said that 'trading coins is not as good as hoarding coins;' trading coins involves secondary market short-term transactions, while hoarding coins involves buying spot at low prices and selling high.
Trading is not about getting rich in one go, but rather about achieving reasonable profits sustainably, allowing one to continuously generate wealth.
Professionals create value, and details determine success or failure. If you currently feel helpless or confused while trading in the crypto space, I hope my insights can provide you with some inspiration and assistance!
Continuously monitor: $SOPH TRB WCT