Patterns for buy or sell signals
1. Ascending Flag 📈

After a strong increase, price will consolidate in the shape of a flag. When it breaks up, buy! Stop loss just below the flag.
2. Measuring Move Up 🔁

After a strong increase, wait for a correction. When price continues to rise again, buy! Stop loss under the correction.
3. Ascending Flag 🚩

A brief consolidation in a triangle after a price increase. A breakout is your entry signal. Stop loss below the flag.
4. Cup and Handle ☕

Looks like a cup shape. When price breaks above the handle, buy! Stop loss below the handle.
5. Ascending Edge 🌙

A curved pattern with higher lows. When price breaks this curve, it’s time to buy. Stop loss at the lowest point.
6. 3 Ascending Valley ⛰️

Three consecutive higher bottoms, indicating bullish strength. Enter when breaking above the third top.
7. Symmetrical Triangle 🔺

Price tightens into a triangle. When it breaks up, buy! Stop loss just below the triangle.
8. Ascending Triangle 📊

Flat top with rising bottoms — very bullish. Buy when price breaks above the upper line. Stop loss below the trend line.
9. Double Bottom 🅱️
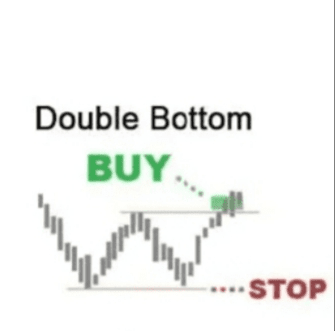
‘W’ shape. Buy when price breaks above the neck line after the second bottom. Stop loss at the second low.