Today's Bitcoin price prediction remains cautiously bullish, as despite failing to break through the resistance at $110,000, BTC still stays above $108,000.

Bitcoin price fell back to $108,200 on Sunday, failing to break through the $110,000 mark again. Two key factors seem to be constraining the next bull market: RSI overbought and a sharp decline in whale trading volume. With bulls retreating, Bitcoin's surge has paused below $110,000.
Bitcoin price briefly rose to $109,400 on Sunday before retreating to $108,000, hovering below the key resistance level of $110,000. Despite a calm market over the weekend, Bitcoin price continues to set new lows, confirming a bullish consolidation after breaking through the historical high of $106,100 on May 20.
CoinGecko data confirms that the closing price has been above this threshold for five consecutive trading days, which is a bullish signal indicating that most holders who entered above the previous peaks are still unwilling to exit.
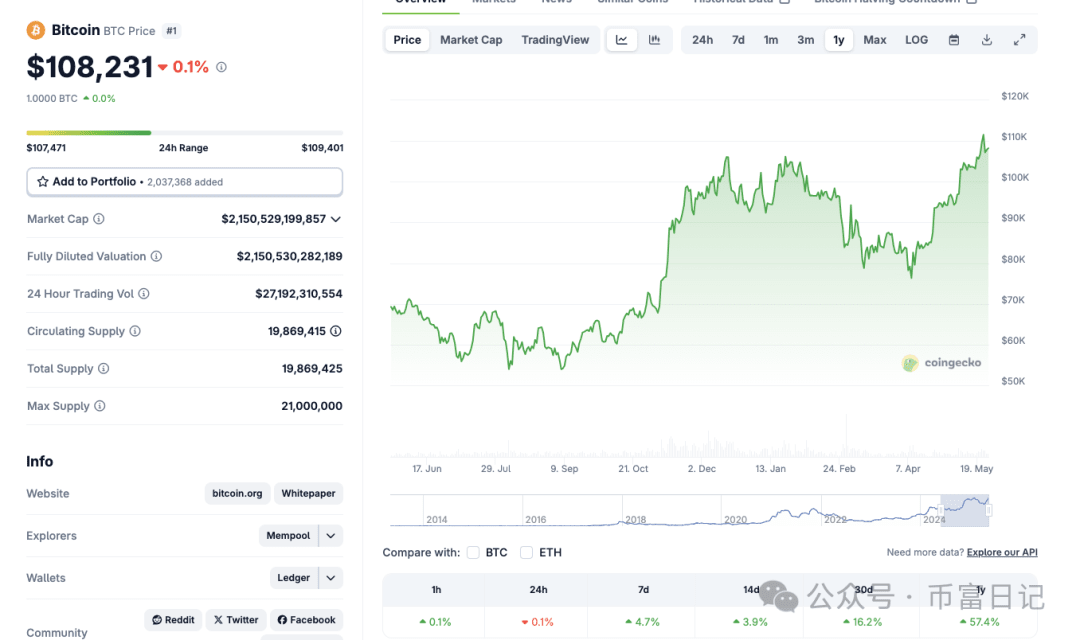
As of the time of writing, Bitcoin price is at $108,200, with a narrow trading range, but the mid-term structure remains strong.
Low weekend liquidity seems to hinder Bitcoin's continued rise. Bitcoin price opened higher on Sunday, briefly reaching $109,400, but retreated again at the $110,000 mark.
As trading volume decreases, the upward momentum gradually fades, with total trading volume over 24 hours dropping to $26 billion, nearly a 70% decline from Thursday's peak of $75 billion, while BTC had set a global record last week.
Bitcoin bulls are losing momentum near $110,000, with whale trading volume down 57%.
According to CoinGecko, Bitcoin whale trading volume has sharply declined in the past 48 hours, raising new concerns about trend exhaustion near $110,000. On May 22, BTC price hit an all-time high of $110,624, with whale trading volume soaring to $112.6 billion, marking the highest single-day trading volume in the past month.
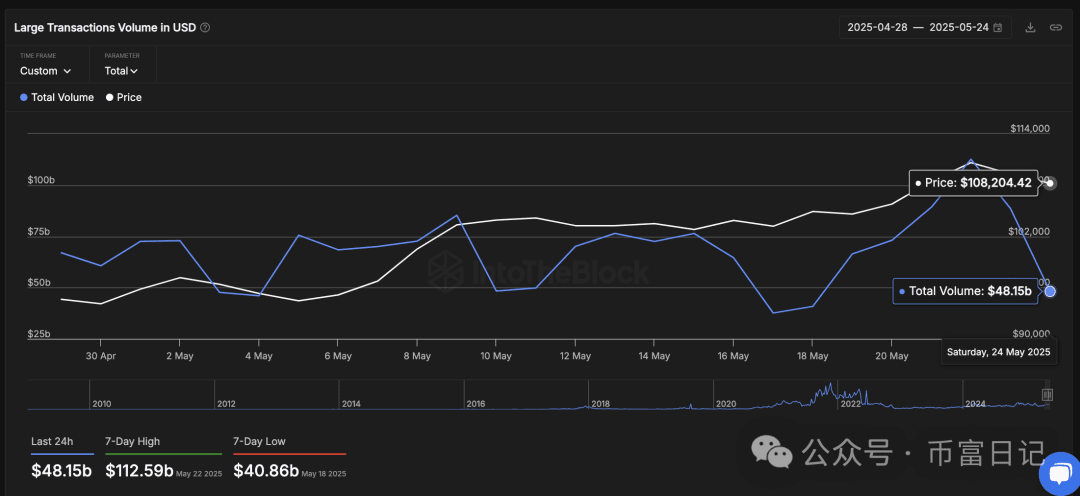
However, market activity quickly reversed. On May 23, large transaction volume dropped to $88.5 billion, and by May 24, it further plummeted to $48.15 billion. In just two days, Bitcoin price fell by 57.2%, closely mirroring the drop from $110,000 to $108,200 at the time of this article's publication.
This reflects signs of whale fatigue, especially after a significant rise between May 20 and 22, when trading volume surged from $73 billion to $112.6 billion, pushing BTC from $105,780 to above $111,800.
BTC price failed to break through $110,000, which corresponds with a decline in whale activity. This confirms the market's heavy reliance on corporate demand from Strategy (MicroStrategy), Metaplanet, and Bitcoin ETFs to maintain upward momentum.
If whale participation remains below the 30-day moving average trading volume (approximately $74 billion), Bitcoin may retest the support areas of $106,000 and $107,000 before attempting to break through again.
For bulls to regain control, the re-entry of large investors is crucial. Otherwise, the market may continue to fluctuate within a range, waiting for new catalysts.
Bitcoin price analysis: The RSI indicator cools down, but $106,000 remains a key bullish support level.
The short-term outlook for Bitcoin is cautiously optimistic, with the price stabilizing above $106,000 after falling to around $112,000 last week, this level currently constitutes a solid support. However, technical momentum is cooling.
The Relative Strength Index (RSI) has dropped from a recent high of around 74 to 63.39, indicating the market is no longer overheating, but also suggesting that bullish buying momentum is weakening.
This RSI level places BTC in a neutral to bullish zone, supporting sideways consolidation rather than an immediate breakout.
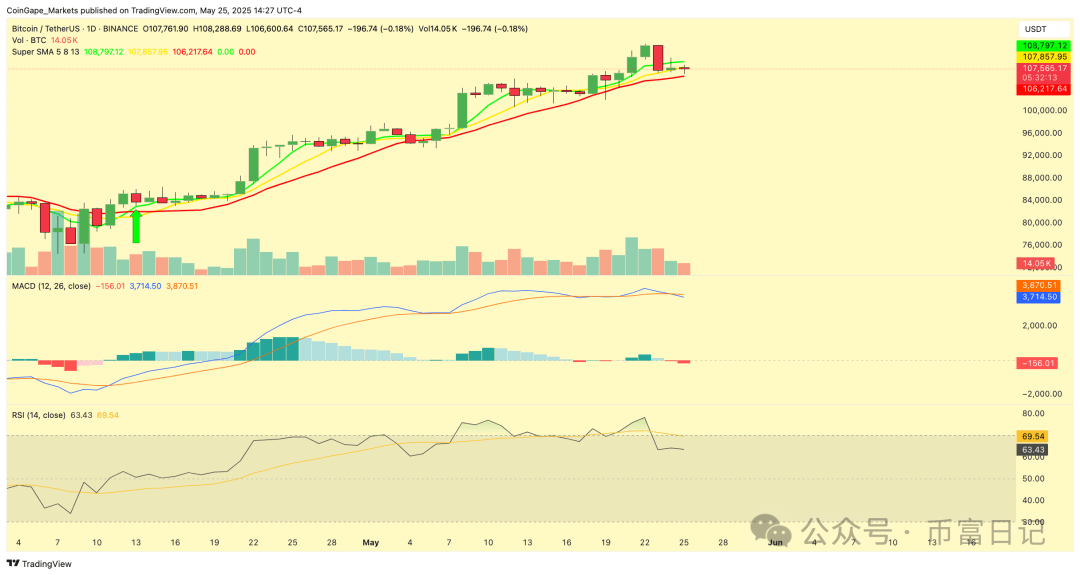
The MACD histogram continues to flatten, while the MACD line is slightly above the signal line. This indicates that bullish momentum is weakening but has not yet reversed. A bullish crossover could accelerate upward movement again, but any further weakness could evolve into bearish divergence.
Crucially, Bitcoin remains above the 5-day SMA of $107,856 and the 13-day SMA of $106,216, highlighting the importance of the $106,000 area.
If the daily closing price falls below this range, it could trigger further sell-offs, pushing the price towards the $104,000 and $105,000 range, where the breakout area and EMA's layered support converge.
Trading volume remains at a moderate level of 14.03K BTC, and traders will be watching for a return of stronger capital inflows to bet on the price breaking through the $110,000 area again.
