
Pi Network (PI) has once again taken center stage as its price surged 11% on the back of over 86 million tokens being withdrawn from OKX, sparking speculation of a coordinated supply squeeze. The move has heightened bullish sentiment, especially as technical indicators are beginning to align with price action.
Momentum indicators such as the DMI and EMA suggest that prices are strengthening, while a potential golden cross pattern suggests the possibility of a sustained breakout. However, not all signals have been fully confirmed - volume-based indicators such as the CMF still show that there is still uncertainty in the market, so the next few days will be crucial in confirming the direction of the PI.
Technical indicators support PI rise amid supply shock speculation, article source: public account Feng Baobao is baking sweet potatoes
Pi Network (PI) surged 11% after more than 86 million tokens were withdrawn from the OKX exchange, causing the platform’s PI reserves to be drastically reduced to just 21 million.
The sudden outflow of tokens has sparked speculation of a coordinated supply squeeze, with some investors interpreting the move as a strategic move by large holders to limit circulating supply and potentially drive up prices.
The Voice of the X community described the event as a “strong move” that demonstrates growing confidence in the asset’s future trajectory.
While this sparked bullish momentum and propelled PI to the top of CoinGecko’s trending list, questions remain about its long-term fundamentals, particularly its mainnet launch, exchange listings and broader use case development.

PI DMI. Source: TradingView.
From a technical perspective, the PI's Directional Movement Index (DMI) is showing signs of strengthening. The ADX, a measure of trend strength, has climbed from 12.46 to 16.6 over the past day, indicating that momentum is building. Typically, ADX values above 20 indicate a developing trend, while those above 25 indicate a strong trend.
Meanwhile, the +DI line, which tracks bullish pressure, is at 25.98, up from 20.14 yesterday but slightly below the peak of 29.15 earlier today. The -DI, which represents bearish pressure, has dropped sharply from 20.84 yesterday to 14.45.
This divergence suggests that bulls are gaining control while sellers are exiting, supporting the argument that Pi Network could be entering a more decisive uptrend if this momentum continues.
The PI CMF briefly spiked before retreating, suggesting that buying pressure is waning Despite the recent spike, the PI CMF currently stands at -0.03.
Chaikin Money Flow (CMF) is a volume-based oscillator that measures buying and selling pressure over a specific time period. CMF values range from -1 to +1, with readings above 0 indicating accumulation (buying pressure) and readings below 0 indicating selling (selling pressure).
The closer the value is to either extreme, the greater the pressure it reflects.

PI CMF. Source: TradingView.
Currently, the PI’s CMF is -0.03, a significant improvement from -0.17 two days ago, but down from +0.09 yesterday.
This shift suggests that while overall selling pressure has eased significantly, the recent drop back below the zero axis suggests that buyers are not yet fully in control. The CMF hovering near the neutral zone could mean the market is indecisive or pausing after a recent rally.
For the bulls to regain full momentum, the CMF ideally needs to move back into positive territory and stay there to confirm sustained capital inflows and support the case for continued gains.
PI's golden cross setup is building, but key resistance is still in play
The EMA lines of Pi Network are starting to form a bullish pattern and may be about to form a golden cross. A golden cross occurs when the short-term EMA crosses the long-term EMA upwards, signaling the possibility of a continued upward trend.
If this pattern is confirmed, PI price might gain enough momentum to challenge the $0.96 resistance level.
A break above this level could open the doors for further gains towards $1.30, and if the follow-through is strong, the price could even reach $1.67 – a level not seen in recent trading activity.
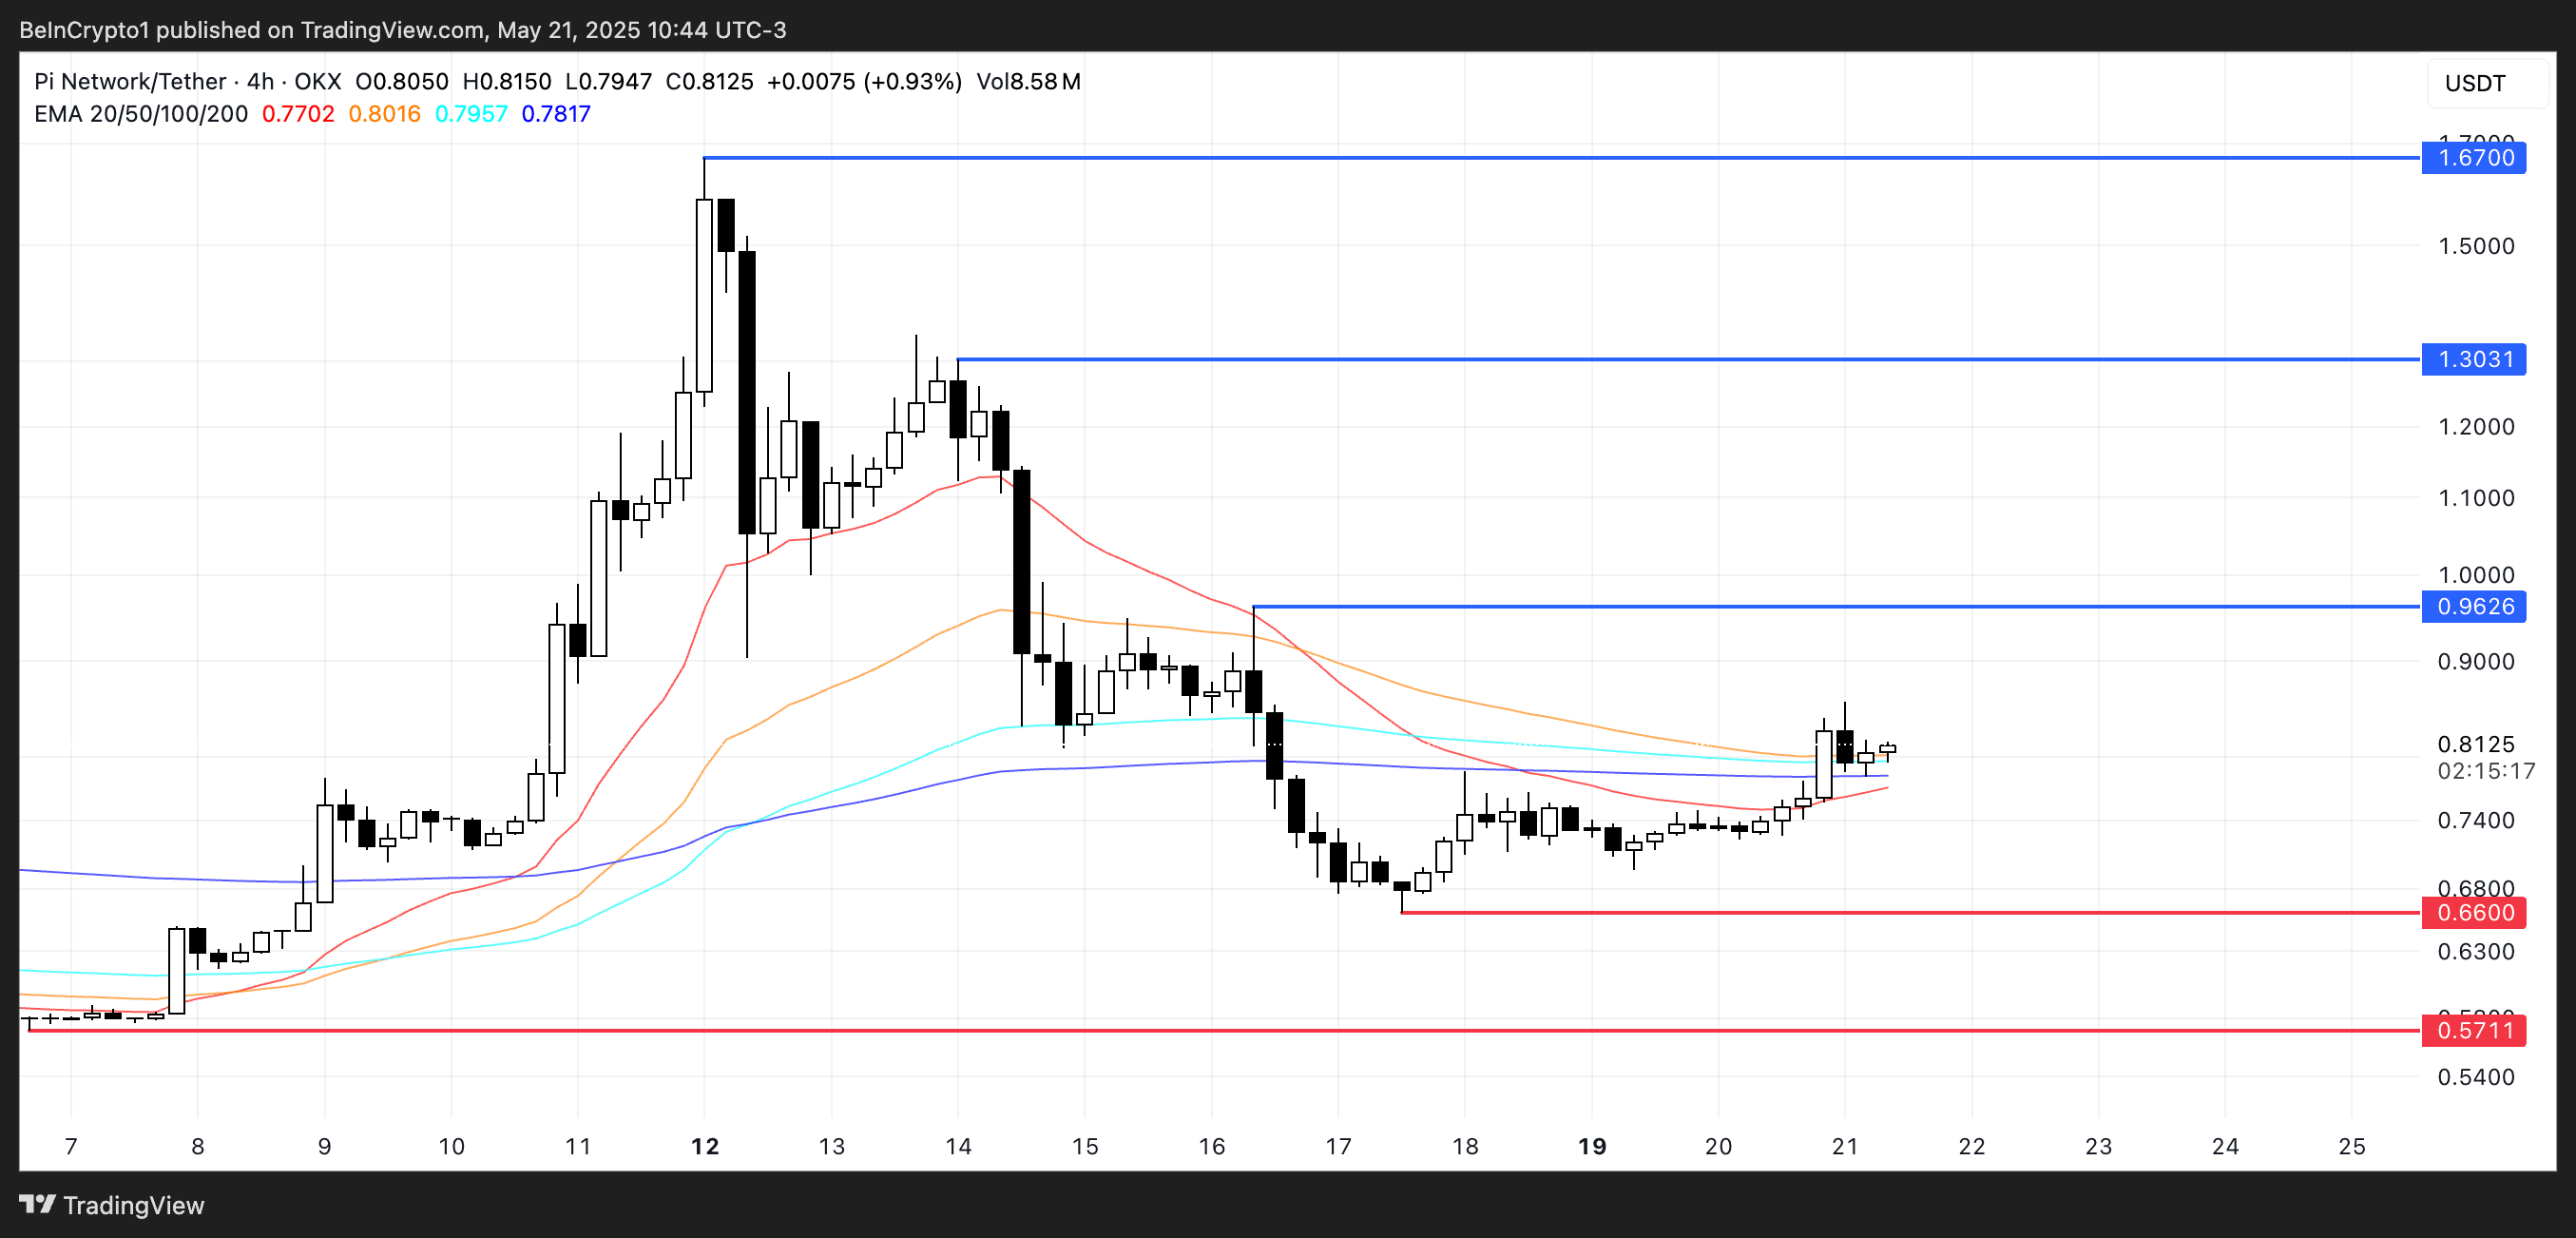
PI price analysis. Source: TradingView.
However, the bullish outlook is not guaranteed. If the current uptrend loses steam and buying pressure subsides, Pi Network could retrace to test the $0.66 support level.
A break below this level could lead to a more pessimistic sentiment, pushing the coin further down to $0.57.
While technical signals currently lean towards bullishness, traders will be watching closely to see if a golden crossover can materialize and if resistance levels can be cleared convincingly.