Bitcoin may be nearing the final phase of the current market cycle, characterized by a final strong price surge followed by a significant correction and ultimately a bear market. For many, this could be the peak that has been anticipated for the past four years, and the big players are preparing for it.
Since the end of 2024, the accumulation of Bitcoin whales has surged. Data from Glassnode shows that the number of addresses holding more than 100 BTC has increased by nearly 14%, reaching 18,200, the highest level since 2017. The largest players in the market seem to be positioning for what could be the final price surge of this cycle.
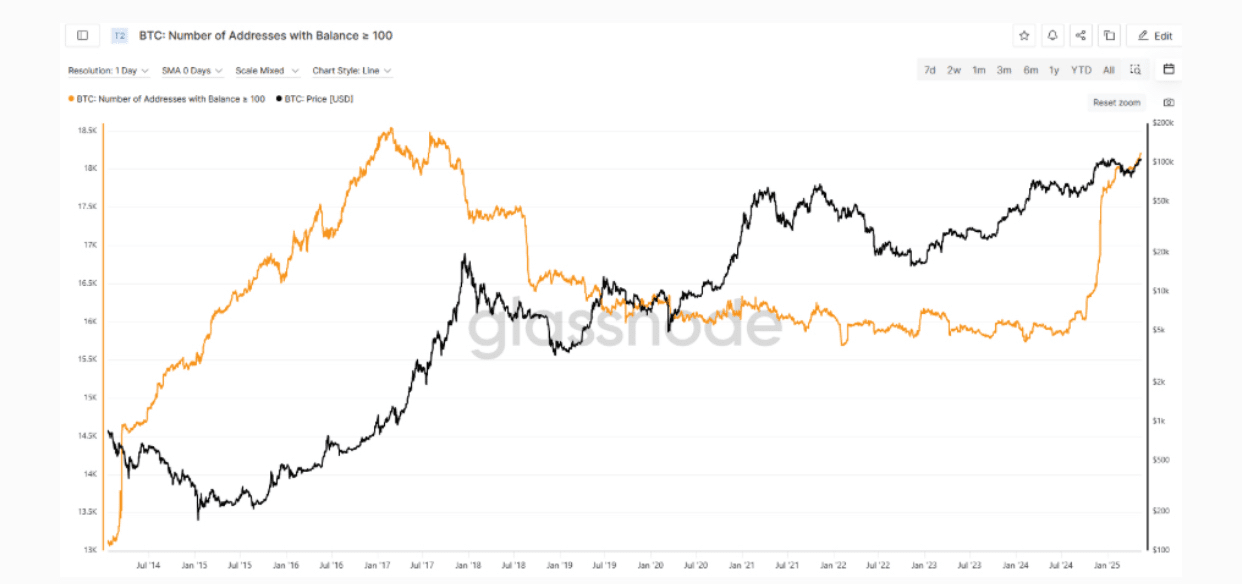
Number of addresses holding more than 100 BTC | Source: Glassnode
However, participating in swing trading is quite complex, and knowing when to exit the market is extremely difficult. Rising BTC prices drive FOMO, causing many investors to buy at the peak, only to face losses or even liquidation afterward.
So, how can traders and investors detect the peak before the market enters a downturn?
Bitcoin cycle peak markers
Typically, some on-chain technical indicators, such as MVRV Z-Score (Market Value vs. Realized Value), Pi Cycle Top, and the trend of trading volume, are reliable indicators signaling when Bitcoin is nearing its peak.
MVRV-Z Score compares Bitcoin's market value to its fair value and adjusts for volatility. High Z-scores indicate that Bitcoin is overvalued relative to its cost basis. Historically, when this indicator peaks, a bearish trend is likely to occur.
Pi Cycle Top tracks Bitcoin price momentum using moving averages. When the simple moving average of 111 days (111-SMA) doubles the moving average of 350 days (350-SMAx2), it signals overheating. In other words, when the short-term trend catches up with the long-term trajectory, the market peak will appear.
Historically, all previous Bitcoin price surges began with a strong increase in MVRV Z-Score and ended with the 111-SMA crossing over the long-term trend.

BTC: Pi Cycle Top + MVRV Z-score | Source: Glassnode
Additionally, lower trading volumes during price increases may serve as a warning sign, often indicating weakening momentum and potential reversal.
On-balance volume (OBV), which records cumulative volume, is the metric to monitor this process. When OBV diverges from price action, it is often an early reversal signal.
The second phase of the price surge in 2021 is an example. While BTC price set a higher peak around $68,000 (compared to the previous ATH of $63,170), trading volume moved in the opposite direction, decreasing from 710,000 BTC to 628,000 BTC. This created a bearish divergence between price and volume, indicating fewer market participants supporting the price surge, a typical sign of weakening momentum.

BTC/USD 1 day, OBV | Source: TradingView
Profit-taking metrics
When the market cycle reaches its peak, long-term holders and Bitcoin miners often begin to take profits. A few metrics to watch are the Puell Multiple and exchange inflows.
The Puell Multiple indicator considers miners' revenue against its 365-day average. High readings indicate that miners may begin to sell heavily and are often seen near market peaks.
Large inflows to exchanges are often a sign of distribution, as investors prepare to sell their assets.

Total BTC volume moving to exchanges and Puell Multiple | Source: Glassnode
When considered individually, these indicators may mark various changes in market trends. When combined, they often align with the cycle peak.
15% rule
Observing past price action also proves useful. Market analyst Cole Garner has shared his withdrawal strategy based on the behavior of whales. His roadmap consists of three steps:
Euphoria. Bitcoin moves vertically, surging for weeks, with daily candles exceeding $10,000.
The surprise hit. Bitcoin experiences the most significant correction in the bullish cycle. The parabolic trend support line is broken, a clear signal indicating a potential peak. Meanwhile, altcoins and memecoins may continue to rise a bit more.
Complacency. 15% lower than Bitcoin's ATH. This is the selling zone. Order books on major exchanges often display a sell wall around this level, likely the exit point for large institutions.
According to Garner, the 15% (or 16%) rule applies not only to cryptocurrencies but also to traditional markets.
Past sell-offs of: BTC, ETH, gold, Nasdaq, Nikkei, Broadvision, 3D Systems | Source: Cole Garner

No single indicator can precisely determine when to exit the market, especially in a changing macro environment. But when multiple signals align, they become something traders need to pay attention to.
The final phase of the Bitcoin bull market is exciting, but knowing when it may stop is the key to achieving optimal profits.
#DinnerWithTrump #SaylorBTCPurchase $BTC $ETH $XRP


