1. Core judgment of short-term trends
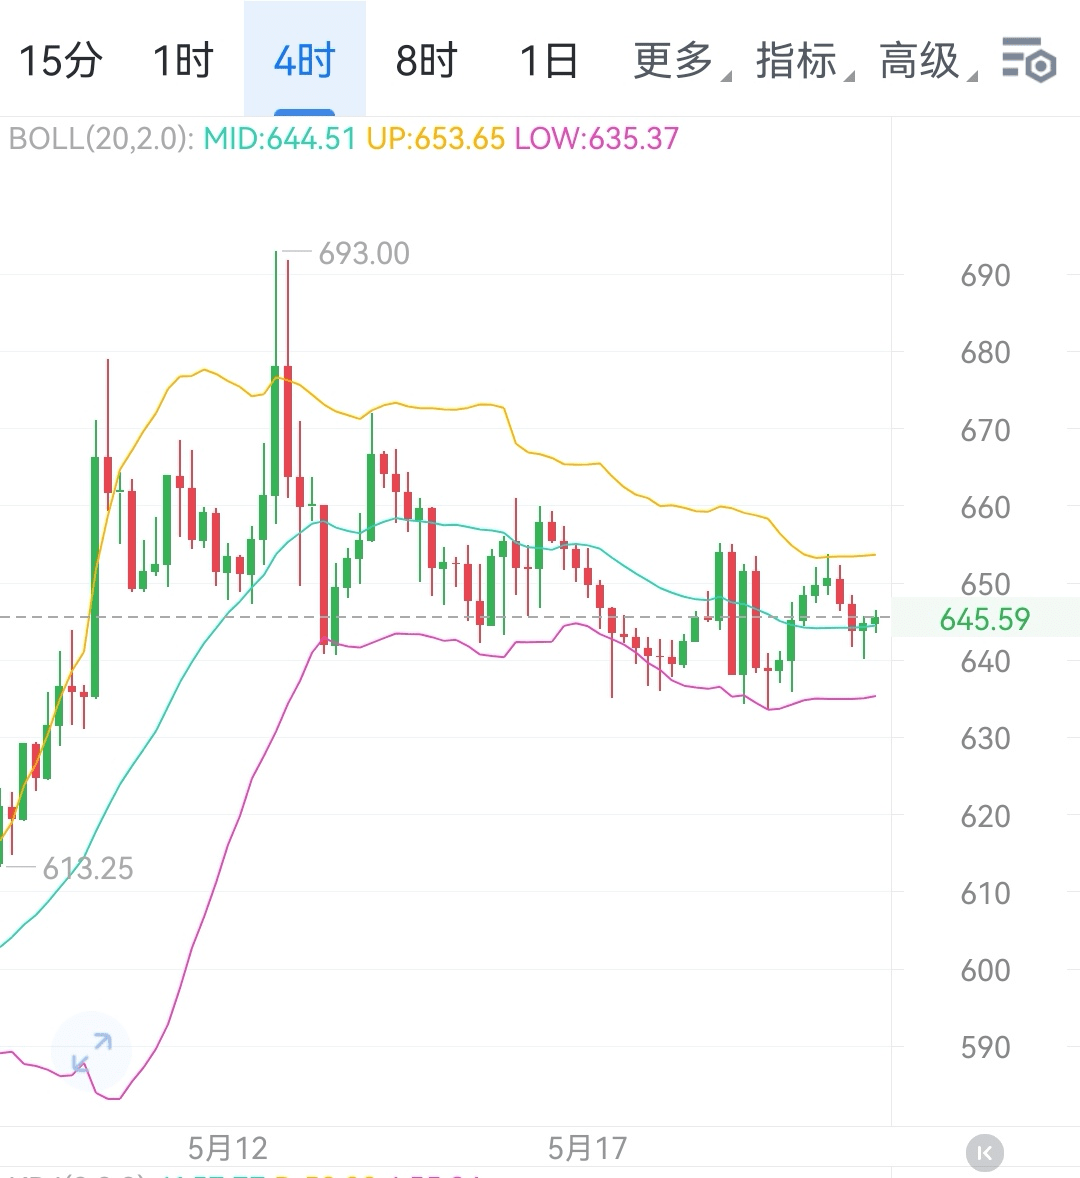
The core direction of the BNB market tonight focuses on the key price level of 645. The closing performance of the 4-hour candlestick will become an important basis for judging the subsequent trend of the market.
Bearish dominance signal
If the 4-hour candlestick closes below 645, it indicates that the pullback at the 4-hour level has officially started, with bearish forces dominating. At this time, market caution may rise, and investors' wait-and-see attitude will intensify. The following support levels need to be closely monitored: 640 serves as the primary support, formed by the convergence of short-term moving averages, which can initially buffer the bearish downward pressure; 636 is a key level that the price has tested multiple times, bearing significant psychological support; 633 lies in the convergence area of multiple moving averages, and if lost, it may trigger a deeper downward trend, causing panic in the market.
Bullish continuation signal
Conversely, if the 4-hour candlestick closes steadily above 645, and the subsequent periods continue to maintain this, it indicates that the bulls have regained market initiative, and a small-scale rebound may begin. This will effectively boost market confidence in going long, attracting additional funds to enter. On the upside resistance levels: 648 is at the upper edge of the recent fluctuation range, gathering a large amount of profit-taking and trapped positions; 654 is a key Fibonacci resistance level, exerting strong pressure on price upward movements; 660 coincides with an important moving average resistance area, and if these resistance levels can be successfully broken, the price of BNB may open up a new upward space.
2. Key level distribution and strategy reference
(1) Upside pressure levels
1. First resistance level: 648
This position is at the upper edge of the densely traded area of recent price fluctuations, where a large number of chips are gathered. When the price of BNB rises to this point, selling pressure will significantly increase, becoming the primary obstacle for the bulls to break upwards. To achieve an effective breakthrough, strong buying momentum is needed, combined with the market's active bullish sentiment.
2. Mid-term resistance level: 654
This point coincides with the key Fibonacci resistance level, exerting strong technical pressure on price upward movements. To successfully break through, the market’s bullish momentum must continue to strengthen, with sufficient funds to support it. Once broken, it may indicate that the market is entering a new rising phase.
3. Trend breakthrough level: 660
Once the price of BNB successfully stabilizes at 660, it will confirm its entry into a new upward channel, and the subsequent upward space is expected to be significantly opened. A new round of strong upward momentum can be anticipated. This breakthrough will greatly enhance market confidence and attract more investors to participate.
(2) Downside support levels
If the 4-hour level cannot stabilize above 645, a pullback will begin, with the following support levels below:
1. Primary support level: 640
As a support level formed by the convergence of short-term moving averages, this is also an important support area for previous price fluctuations, which can to some extent slow down the speed of price decline. If the price retraces here and gains effective support, it may stabilize and attempt to rebound upward.
2. Secondary support level: 636
As a key support level that has been validated multiple times, if it is lost, market panic may quickly spread, triggering larger-scale selling and accelerating price decline. After breaking this level, everyone needs to closely monitor market dynamics and adjust trading strategies in a timely manner.
3. Strong support level: 633
This point is located in the support zone of multiple moving average convergence, a strategic point fiercely contested by both bulls and bears, and its gain or loss directly affects the subsequent medium to long-term trend. If strong support can be found here, the market may welcome a turning point; if it breaks below, it may trigger a deep correction, changing the market landscape.
3. Summary
The struggle between bulls and bears at the key price level of 645 is at the core of BNB's night trend. If the 4-hour level can effectively stabilize above this position, the bulls are expected to challenge the resistance in the range of 648 - 660; if it cannot stabilize, then the risk of price retracing to the 640 - 633 area must be taken seriously. The volatility is severe and full of uncertainty. It is recommended that everyone closely monitor the changes in the 4-hour candlestick pattern, strictly implement stop-loss and take-profit strategies, and reasonably control positions!$BNB #BNB走势