People who play the cryptocurrency circle may see their money increase 50 or 100 times overnight, or they may lose everything in an instant.
Playing with contracts in the cryptocurrency world is thrilling and even more exciting than riding a roller coaster.
Have you ever experienced continuous losses and frequent liquidations?
Then you feel depressed and regret your decision?
You are eager to make a comeback, but end up getting deeper and deeper into trouble?
You fantasize about the scene of success again and again, but reality slaps you in the face again and again?
This is something that every trader has experienced, you and I are no exception!
The difference is that some people gave up in such torture, some lost all their capital, and very few people persisted. But what is the point of persistence without complete enlightenment?
I have read countless tutorials, learned the summaries of many traders, and analyzed countless reasons for failure! I have summarized the following points, which I believe can help you:
1. Mental and emotional management
Managing your mentality and emotions does not mean that you cannot be happy when you make a profit, or cannot be depressed when you lose money. It does not mean that you should be a robot without emotions!
Instead, it requires you to first firmly believe in your heart that you will succeed, believe that the current losses are only temporary, and truly develop a positive belief system. Secondly, it is crucial to be able to remain rational and calm when losses occur, not to place orders blindly, and to be able to analyze correctly and operate rationally!
2. Continuously improving the trading system
Remember, trading is not gambling, but it does have probabilistic attributes. You must constantly summarize and explore a trading system that suits you in long-term transactions. Specifically, you should establish your own trading rules in terms of indicator analysis, positions, take-profit and stop-loss, long and short cycles, etc. to restrain yourself and determine your own transactions instead of being blind. Otherwise, you will go into an unlimited dead loop!
3. Fund Management
There is a saying that goes, "If you have the green mountains, you will never be afraid of running out of firewood." You must not have a "all-in" mentality, which is very dangerous, because once you have this idea, in most cases, the market will help you and make you completely give up! You must strictly control this point, and manage your funds by summarizing your losses under the maximum number of consecutive losses, so that you must have a chance to turn the tables. This requires you to be extremely calm. Only when you still have chips, you will have a chance to be reborn!
4. Technical Analysis
This is so important. If you don't have any skills at all, then you must not place an order, because that is gambling on luck, and you will definitely fail, which is very scary! The learning of technical indicators is a process of gradual improvement, but once you rely too much on the judgment given by various indicators, you may often be confused, make mistakes frequently, and then doubt the technology. How to find the right indicators for you among so many indicators, so as to simplify it is very important. Commonly used naked K patterns, Bollinger, moving average, MACD, volume column, OBV, etc., comprehend the inner essence of simplicity!
Long story short
Perpetual contracts are also called perpetual futures contracts or perpetual futures. They are a type of derivative trading method. Users can use perpetual contracts to go long, short, and arbitrage to obtain trading investment returns that are many times higher than the investment principal.
Through perpetual contracts, you can not only make money from the rise in currency prices, but also from the fall in currency prices. You can also use leverage to use a small amount of capital to leverage large profits.
When using perpetual contracts for trading, if you mispredict the price trend, you may face the risk of liquidation, loss of all investment capital
Whether you are a novice investor or someone who has experience in cryptocurrency trading, you will have a deeper understanding of perpetual contracts after reading this article.
The principle of perpetual contract
The underlying logic of perpetual contracts is to allow investors to borrow virtual currency and buy or sell virtual currency at a specific price at a specific point in the future.
For example, Xiaoyu has 100 USDT, and Xiaoyu believes that the price of Bitcoin will rise from 100 to 200 tomorrow. Then Xiaoyu can borrow 900 USDT from the exchange, and then use this 1000 USDT to buy 10 Bitcoins, and then sell them when the price rises to 200 tomorrow. After selling, Xiaoyu will have 2000 USDT in his account, and after paying back the 900 USDT from the exchange, Xiaoyu will get a profit of 1000 USDT from this transaction.
If Xiaoyu only used his original 100U principal to trade, the profit would only be 100 USDT. So in this example, Xiaoyu used 10 times leverage and earned 10 times the profit by going long on Bitcoin.
However, if Xiaoyu mispredicts the price direction and the Bitcoin price drops to 50 the next day, then Xiaoyu’s 10 BTC will only be worth 500 USDT, and the nominal loss is 500 USDT. Therefore, when using leverage, perpetual contract trading can magnify both profits and losses.
Why is it called a “contract”?
Contract trading of virtual currencies is derived from traditional bulk futures trading. In traditional futures trading, traders really need to sign a contract when they go long or short a certain commodity price in the future, which is why it is called "contract" trading.
For example, if McDonald's predicts that the price of potatoes will rise sharply in June next year, in order to control costs, McDonald's will sign a potato futures contract for June next year through the exchange. No matter what the price of potatoes is at that time, it will purchase a batch of potatoes at the agreed price.
In this way, no matter how the potato price fluctuates, McDonald's can purchase potatoes at a stable price to ensure a stable supply of French fries. If the market price rises, McDonald's can still purchase according to the contract price to save costs. On the contrary, if the market price falls, although McDonald's needs to pay the contract price, the actual total cost of the enterprise will be lower. In fact, international companies such as McDonald's do use futures contracts to ensure supply stability and cost control in real life.
However, when the futures contracts of these commodities are derived into virtual currency transactions, although the exchange draws on the operation mode of futures contracts, it will not actually lend you money or currency. Instead, it will use similar calculation methods to intuitively tell you the leverage multiples, expected profits or losses, thereby lowering the threshold for contract trading and making it more convenient for more investors to use it.
What are the types of contracts?
Perpetual Contract: Perpetual Contract has no expiration date. Users can hold it indefinitely and close their positions by themselves.
Delivery contract: Delivery contracts have specific delivery dates, including weekly, next-weekly, quarterly, and next-quarter delivery contracts. When the specific delivery date arrives, the system will automatically deliver regardless of profit or loss.
USDT-margined contract: This means that you need to use the stablecoin USDT as a margin asset. As long as there is USDT in your account, you can conduct contract transactions in multiple currencies, and the profit and loss will be settled in USDT.
Currency-based margin contracts: The underlying currency is used as the margin asset. You need to hold the corresponding currency before trading, and the profit and loss are also settled in this currency.
The most stable way to play cryptocurrency contracts
Choose the right coin and be a good person. As a leveraged trader, volatility can be amplified by leverage multiples. The primary consideration in the trading process is not volatility but certainty.
In an uptrend, go long on the strongest currencies; in a downtrend, go short on the weakest currencies.
For example, at the beginning of a new quarter, eos and eth had the strongest growth. These two currencies were the first choice for long positions when the market fell back, and bitcoin was the first choice for short positions when the market fell. Even if the final result was that the mainstream currencies fell more than bitcoin, only shorting or chasing short bitcoin can avoid the risk of violent pullbacks to a great extent.
Most of the traders in the cryptocurrency circle are short-term traders. When trading, it is difficult for them to have the opportunity to hold on to the ideal point to close the position. At the same time, they are not very proficient in position control, and they cannot rely on shocks to do T to pull the average price. Based on this situation, for most traders, a good opening price is more important than anything else.
Once there is a profit, sell part of it first and lock in the profit, and set a stop loss at the cost price for the rest. This is what I have always emphasized in my own community.
The essence of contract trading strategy
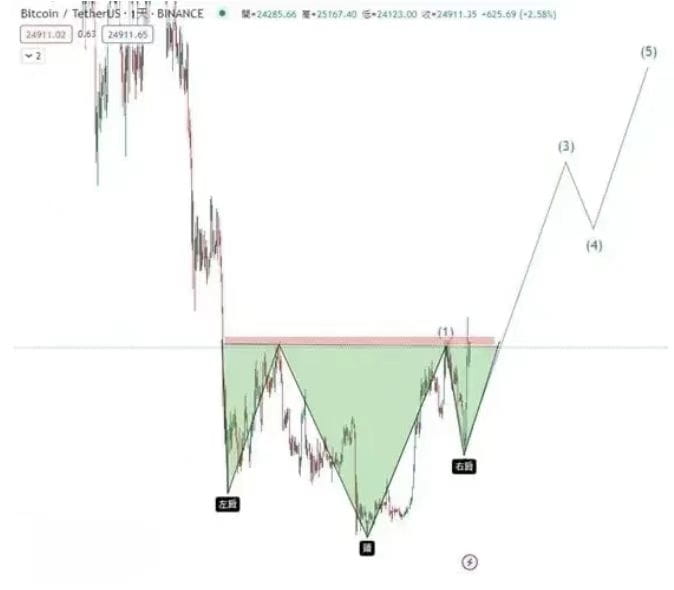
(1) Find out the main trend and enter the market following the main trend, otherwise do not enter the market.
(ii) If you are trading with the trend, the entry point is:
1. A new breaking point of the trend;
2. The sideways trend breaks through in a certain direction;
3. The pullback point of an upward trend or the rebound point of a downward trend.
(3) Positions that go with the trend will bring you huge profits, so don’t get out of the market early;
(IV) If the position building is in line with the general trend and the book profit has proved that you are right, you can use the pyramid technique to increase the position; (reference 2)
(V) Keep your position unchanged until the trend reverses and closes the position.
(6) If the market trend is opposite to the position you opened, stop loss and run.
In addition to adhering to the above strategies, you must also remember three qualities: discipline, discipline, and discipline!
The way of trading is to accumulate small amounts into large amounts, and compound interest is king. If you get out of the cost, you must not turn it back into a loss. If you make a profit, you must pocket part of it to avoid wasting time. In a nutshell: if you make a profit, go boldly, and if you make a loss, the rest will be the original price.
Tips for making money with perpetual contracts
1. Avoid full warehouse operation
How should funds be allocated? Fund allocation should be understood from two levels:
First, to understand fund allocation from the perspective of risk, we must first clarify how much loss our account can or is prepared to bear. This is the basis for our thinking about fund allocation. After this total amount is determined, we can then consider how many times we should lose to the market if we lose consecutively in the market, so that we can willingly admit our bad luck and failure.
I personally think that the riskiest method should be divided into three times. In other words, you should give yourself at least three chances. For example, if the total amount of account funds is 200,000, and the client allows you to lose up to 20% or 40,000, then the riskiest loss plan is: 10,000 the first time, 10,000 the second time, and 20,000 the third time. I think this loss plan is reasonable. Because if you do it right once in three times, you can make a profit or continue to survive in the market. Not being kicked out of the market is a success in itself, and there is a chance to win.
2. Grasp the overall market trend
It is much more difficult to follow the trend than the shock, because the trend is to chase the rise and sell the fall, and you need to have the determination to hold the position, and selling high and buying low is in line with human nature.
The more trading conforms to human nature, the less money you make. It is precisely because it is difficult that you make money.
In an upward trend, you should choose to go long on any violent pullback. Remember the probability I mentioned? So, if you are not on the bus or have gotten off, wait patiently, and if there is a drop of 10-20%, go long boldly.
3. Specify the stop-profit and stop-loss targets
Stop-profit and stop-loss can be said to be the key to whether we can make a profit. In several transactions, we must make the total profit greater than the total loss. It is not difficult to achieve this. Just do the following:
① Each stop loss is ≤ 5% of the total funds;
② Each profit>5% of the total funds;
③ Total transaction winning rate >50%
If the above requirements are met (profit-loss ratio greater than 1 and winning rate greater than 50%), you can achieve profit. Of course, you can also have a high profit-loss ratio and a low winning rate, or a low profit-loss ratio and a high winning rate. Anyway, as long as the total profit is positive, the total profit = initial principal × (average profit × winning rate - average loss × losing rate).
4. Be careful not to trade too frequently
Since BTC perpetual contracts are traded 24 hours a day, many novices trade every day. They wish they could trade every day for the 22 trading days in a month. As the saying goes: If you walk by the river, you will get your shoes wet. If you trade too much, you will always make mistakes. After making mistakes, your mentality will become bad. Once your mentality becomes bad, you may act impulsively and choose "retaliatory" operations: you may go against the trend or hold a large position. This will lead to one wrong step and another, which can easily cause huge losses on the books, and these losses may not be recovered for several years.
5. Contract entry timing
Many users open orders 24 hours a day, which is just like sending money. The purpose of the contract is to make a relatively stable profit strategy with controllable risks and relatively stable indicators, rather than clicking 100 times to buy and then get rich! Therefore, the timing of entering the contract is particularly important!
⑴: Do not open orders during periods of major positive or negative news, because the market is very chaotic at this time, and the spot price can fluctuate at a high speed between 1-3%. If you choose to gamble on the market at this time, you will easily be carried away by the Tiandizhen.
⑵: I usually choose to enter the market after the second bottoming out or rising after a large fluctuation, because after the second wave of market fluctuations, the market fluctuations will gradually stabilize. The risk factor in the subsequent interval is the lowest. The purpose of the contract is to make the most appropriate strategy in the smallest risk interval.
⑶: Enter the market within the indicator range, and never open an order if the indicator parameters do not meet your expectations. This can be understood as entering the market within your own strategy range, and ignoring the market if it does not reach your psychological price. Because the risk factor is also magnified when the contract amplifies the leverage, self-discipline is very important.
To sum up simply, when the market stabilizes and indicators are in place, the risk rate will be reduced by 50% and then orders can be placed.
Perpetual Futures Cons and Risks
Risk of liquidation
Liquidation means that when the loss of a position reaches a certain level and the margin is insufficient to support the position, the exchange will automatically force liquidation to protect the interests of the exchange and other traders.
We mentioned earlier that the underlying logic of contract trading is actually leveraged lending. For example, Xiaoyu has an investment capital of 100 USDT and uses 10x leverage to open a BTC long position worth 1,000 USDT. If the Bitcoin price is 100 USDT at this time, then the essence of this order is to borrow 900 USDT and purchase 10 BTC together with the principal, hoping to sell them for a profit after the Bitcoin price rises.
But if the price of Bitcoin drops all the way to 90 USDT per coin, the 10 BTC in hand is only worth 900 USDT according to the market price, which is exactly equal to the amount borrowed by Xiaoyu. If the price continues to fall, the value of these 10 BTC will be lower than the loan. The exchange will not let itself lose money, so the exchange will liquidate Xiaoyu's position when the price of Bitcoin drops by 10%, that is, when it drops to 90 USDT per coin, which is what we call "explosion".
After a margin call, not only will the user not make any money, but the margin (principal) used to open the position will also be lost. And the higher the leverage used, the easier it is to get a margin call. In the above example, if a 10x leverage is used, a margin call will occur if the price fluctuates 10% in the opposite direction; if a 100x leverage is used, a margin call will occur if the price fluctuates 1% in the opposite direction.
The above example is based on the calculation of 100% loss before liquidation. However, in actual transactions, each exchange calculates the liquidation loss % differently, and some exchanges calculate it as 90%. Therefore, in specific transactions, it is more accurate to directly refer to the forced liquidation price given by the exchange.
Pin risk
A spike is when the market experiences a sharp fluctuation for a moment and then quickly returns to normal levels. This situation may trigger stop-loss orders or cause liquidation, resulting in losses for investors. A spike may be due to insufficient liquidity on an exchange or the result of malicious market manipulation.
Funding Rate Wear
As we mentioned earlier, exchanges now require users who hold perpetual contract positions to pay a funding rate every 8 hours. Although it is only 0.000x% each time, if the position is large and held for a long time, the cumulative amount of funding rate each time is also a considerable fee.
The contract is risky, please be cautious when trading!
Combined with the MACD indicator, the winning rate can reach 70%, avoiding margin calls!
To put it bluntly, playing in the cryptocurrency circle is a contest between retail investors and bankers. If you don’t have cutting-edge news and first-hand information, you can only be cut! If you want to make a layout together and harvest the banker together, you can come to (Official Account: Trend Prediction) Welcome like-minded people in the cryptocurrency circle to discuss together~
Contract MACD practical tips:
1. MACD is above the zero axis. Every time a golden cross occurs, the currency price is about to reach a new high.
2. MACD is below the zero axis. Every time a dead cross occurs, the currency price is about to hit a new low.
3. MACD forms a golden cross below the zero axis, which indicates a downward trend rebound and will not participate until it reaches the zero axis.
4. MACD is above the zero axis and forms a golden cross, which indicates an upward trend and a bullish market. You can sell high and buy low to reach the top divergence. MACD sells small, the coin price rises, and the next wave of red columns is not as high as the previous wave, and it will fall.
6. If MACD is small, the currency price will fall or remain flat, and the next wave of green columns will not be as low as the previous one, which means it will rise.
7. MACD shrinks at a high level: After the currency price rises sharply, the red column of MACD moves away from the zero axis and shortens, and it moves away quickly.
8. MACD golden cross at a low level: After a sharp drop in the currency price, MACD will move away from the zero axis and will definitely rise. A second golden cross will show a more rapid rise.
9. MACD golden pit: the currency price rises for a wave and then falls back. MACD dead cross has a short green column within 7 days and golden cross, which means it rises.
The MACD indicator plays a very special role in technical analysis and can be said to be an indispensable part of learning technical analysis. Its importance lies in at least the following points.
1. The MACD indicator is the most effective technical indicator that has been tested by historical trends and is also the most widely used indicator.
2. MACD indicator is derived from the moving average indicator EMA, which has a good application effect in grasping the trend market. Trend investors basically refer to this indicator in actual combat.
3. The top and bottom divergence of the MACD indicator is the recognized and best-used method of "picking at the bottom and selling at the top". This method is an important tool for the concretization of trend theory and wave theory.
4. Many veterans have had this experience: they began to learn the MACD indicator when they first got started, and then slowly abandoned it. After a long period of study and comparison, especially after actual combat testing, they finally returned to the MACD indicator. This shows the special feature of this indicator.
5. The MACD indicator is also widely used in quantitative trading.
Because of these advantages, the MACD indicator has become the most commonly used technical indicator by professional traders.
The concept and algorithm of MACD indicator
MACD indicator, also known as the exponential moving average convergence divergence indicator, was created by Geral Apple and is a technical analysis tool used to track price trends and determine the timing of K-line buying and selling. This indicator is a commonly used indicator in market software and is known as the "king of indicators". As shown in [Figure 1].

The MACD indicator in the cryptocurrency market consists of the DIF fast line, the DEA slow line, the MACD bar line and the zero axis. Investors use the intersection, divergence, breakthrough, support and resistance of the three lines and one axis to judge prices. The fact that the MACD indicator can be listed as the preferred indicator by many market software shows its wide application, which also indirectly shows that this indicator is one of the most effective and practical indicators tested by history.
MACD Golden Cross and Death Cross
The "Golden Cross" pattern and the "Dead Cross" pattern are extremely important patterns in the technical indicator analysis method. The Golden Cross pattern can also be called the golden cross, which refers to the relatively short-term indicator line crossing from bottom to top and crossing the relatively long-term indicator line (the same type of indicator line), which often indicates the emergence of short-term buying opportunities. If the Golden Cross pattern appears after ①. a short-term rapid decline during the decline; ②. a wave of correction during the rise; ③. after a consolidation trend during the rise, that is, when the Golden Cross pattern appears at a staged low point, it is a more reliable buy signal.
The death cross pattern, also known as the death cross, refers to the crossover of a relatively short-term indicator line from top to bottom and across a relatively long-term indicator line (the same type of indicator line), which often indicates the emergence of a short-term selling opportunity. If the death cross pattern appears after ①. a consolidation trend on the way down; ②. a rebound and rise trend on the way up; ③. a short-term rapid rise trend on the way up, that is, when the death cross pattern appears at a staged high point, it is a more reliable sell signal.
After understanding the golden cross pattern and the death cross pattern, we can take a closer look at the golden cross pattern and the death cross pattern of the MACD indicator line. The golden cross and death cross appearing in different positions will reflect different market meanings.
Situation 1: Buying point of low golden cross
If the position of the golden cross of the DIFF line and the DEA line appears below the zero axis and far away from the zero axis, this golden cross is called a low-level golden cross. Investors can regard the golden cross at this time as just a short-term rebound in prices. As for whether the K-line can form a real reversal, it needs to be observed and confirmed in combination with other indicators.

As shown in the figure above:
On August 27, 2019, the BTC 10-minute K-line chart showed a low golden cross as the price pulled back, followed by a rebound of $200. Short-term investors can seize the opportunity to enter the market.
Case 2: Buying point of golden cross near zero axis
If an upward trend has been formed and the golden cross of the DIFF line and the DEA line occurs near the zero axis, then this is often an excellent time for investors to buy.
This is because, after the upward trend is formed, the golden cross near the zero axis indicates that the adjustment market has completely ended and a new round of upward market has started. At this time, if the golden cross of the average volume line is also accompanied, it means that the price increase is supported by the trading volume, and the buy signal will be more reliable.
Once this buying point appears, investors should never miss it, otherwise they will miss the big rally.

As shown in the figure above:
At 09:30 on August 19, 2019, the BTC 5-minute candlestick chart showed that Bitcoin broke through the 30-day moving average, indicating that the upward trend has been initially formed. For a period of time afterwards, the price has almost always been running above the 30-day moving average.
At 14:00 on August 19, 2019, the MACD indicator formed a golden cross near the zero axis, indicating that the market is about to see a large upward trend. Investors can buy decisively.
Situation 3: Buying point of high golden cross
If the golden cross of DIFF line and DEA line occurs above the zero axis and is in an area far from the zero axis, then the golden cross is called a high-level golden cross. The high-level golden cross usually appears in the consolidation trend of the K-line during the rise, indicating that the consolidation has ended and the K-line is about to resume the previous upward trend. Therefore, once the high-level golden cross appears, it is a good signal to increase positions and buy.
In actual combat, when an upward trend is formed, the K-line rises slowly and lasts for a long period of time, once the MACD indicator forms a golden cross at a high level, it is often a sign that the K-line is about to accelerate its rise.
Because of this, the high-level golden cross can also be used for swing trading. Investors can use the MACD indicator to continuously snipe the rising band in the rising trend.

As shown in the figure above:
On June 25, 2019, the BTC 3-hour K-line chart showed that the price of Bitcoin was in an upward trend. After consolidation, it rose again. At the same time, the MACD indicator showed a high golden cross. It shows that the callback has ended and the price will continue the previous upward trend. Investors should pay attention to seize this buying point.
Case 4: Selling point of low-level death cross
A low-level dead cross refers to a dead cross that occurs far below the zero axis. This low-level dead cross often occurs at the end of an upward rebound in a downward trend, so a low-level dead cross is a sell signal at the end of the rebound. At this time, investors who are not in the market should wait and see, and investors who are still holding positions and are deeply locked can sell first and buy back after the price drops to reduce costs.

As shown in the figure above:
On July 14, 2019, the LTC 3-hour K-line chart showed that the MACD indicator of Litecoin showed a low golden cross, and the price rebounded slightly, and then quickly fell.
Then, the MACD indicator formed a death cross below the zero axis, and the K-line began a new round of downward trend. Spot investors can sell positions at the death cross position and then cover them to reduce the cost of holding positions.
Situation 5: Selling point of dead cross near zero axis
If the previous market direction has been a downward trend, the cross formed by the DIFF line falling below the DEA line near the zero axis is called a dead cross near the zero axis. It shows that the market has accumulated more downward momentum near the zero axis. The appearance of a dead cross indicates that the downward momentum of the market has begun to be released, and the K-line will continue the original downward trend, which is a sell signal.

As shown in the figure above:
On August 12, 2019, the BTC 1-hour candlestick chart showed that the DIFF line of Bitcoin fell below the DEA line near the zero axis to form a dead cross. It shows that the market's downward momentum has begun to release, which is a sell signal. Investors must decisively sell their positions, otherwise they will be deeply trapped.
Situation 6: Selling point of high-level death cross
The cross formed by the DIFF line breaking the DEA line far above the zero axis is called a high-level death cross. This type of death cross pattern is sometimes accompanied by a top divergence of MACD. The manifestation is: the price trend continues to hit new highs in the process of continuous upward attack, but the DIF line and DEA line of the MACD indicator no longer continue to rise or continue to attack, but diverge from the price trend pattern and move downward wave by wave.
Above the zero axis, the DIF line crosses the DEA line to form a downward cross trend pattern, which is a death cross and a relatively reliable sell signal.

As shown in the figure above:
On August 23, 2019, TRX 1-hour K-line chart, after the wave of TRON currency rising, the price continued to hit new highs, but the DIF line and DEA line no longer continued to rise, and then formed a death cross, a sell signal.
Divergence between MACD and K-line
Divergence is a term used in physics to describe momentum. In technical analysis, it is a method of analysis with a high success rate and wide application. In a downward trend, when the price hits a new low, but the indicator line does not hit a new low, it is called a bottom divergence, indicating that the upward momentum is accumulating, which is a buy signal. In an upward trend, when the price hits a new high, but the indicator line does not hit a new high, it is called a top divergence, indicating that the downward momentum is accumulating, which is a sell signal.
Ⅰ. Bottom divergence
(1) Bottom divergence between MACD bar and DIFF line
The bottom divergence between the DIFF line and the price means that in a downward trend, when the price hits a new low, the DIFF line does not hit a new low. It shows that in the process of price decline, the decline of the DIFF line is smaller than the decline of the price, the upward momentum of the market is constantly accumulating, the price will stop falling, and the probability of rising in the next period of time is relatively high.
MACD bar is the MACD bar hidden behind the DIFF line, divided into red and green. Its divergence with the price is an important use of the MACD indicator, and is widely used in actual combat. The bottom divergence between the MACD bar and the price means that when the price hits a new low wave after wave, the MACD bar does not hit a new low. The upward momentum of the market is accumulating, and the price will stop falling. The probability of rising in the next period of time is relatively high.
When a bottom divergence occurs, investors can grasp the specific buying point in two ways.
(2) Specific timing of buying people
The bottom divergence of DIFF line, MACD bar line and price is not a specific time point, but a pattern that appears over a period of time. However, when investors buy, it is a specific time point, indicating that the price is about to stop falling. Therefore, in order to grasp the specific buying opportunity, when the bottom divergence of DIFF line, MACD bar line and K line appears, investors must combine the bottom divergence with other technical analysis tools to concretize the buying point of the bottom divergence.
First: Bar color change or MACD golden cross
The color change of the bar indicates that the market's upward momentum has begun to take advantage. It usually appears after the "bar shortening", although it will be a while later but more reliable. When the bottom divergence appears, the bar changes color smoothly or forms a golden cross, and investors can buy.
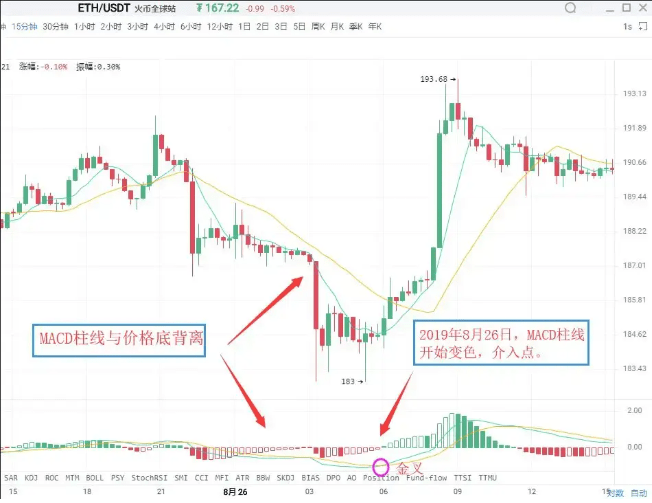
As shown in the figure above:
On August 26, 2019, the 15-minute candlestick chart of Ethereum (ETH) showed that the price of Ethereum hit a new low in the decline, but the MACD bar line did not hit a new low, forming a bottom divergence between the bar line and the price. It shows that the market's upward momentum has begun to accumulate, and there is a high possibility that the price will rise again.
Then the bar changes color. The two buy signals that appear one after another are superimposed on each other, which increases the reliability of the rising significance. Investors can intervene when the bar changes color.
Second: Combine with other technical analysis tools and K-line reversal patterns
The combination of bottom divergence and K-line reversal pattern, such as "single needle bottoming" and "three red soldiers at the bottom", is the specific application of the "multi-indicator coordination" principle.

As shown in the figure above:
On August 26, 2016, the BTC 30-minute candlestick chart showed that the price of Bitcoin hit a new low, but the MACD bar line did not hit a new low, forming a bottom divergence between the bar line and the price, indicating that the market's upward momentum continued to increase.
As the price stopped falling, a buy signal of "MACD bar line diverged from the price bottom + K line single needle bottoming" was formed. After that, the price showed a wave of upward trend.
Ⅱ. Top Divergence
(1) Top divergence between MACD bar and DIFF line
The top divergence between the MACD bar and the K line refers to the situation that when the price hits a new high in an upward trend, the MACD bar does not hit a new high. It indicates that the downward momentum of the market is accumulating and the price may fall at any time.
The top divergence between the DIFF line and the K line refers to the situation in which, in an upward trend, when the price reaches a new high, the DIFF line does not reach a new high. It indicates that the market's downward momentum is accumulating, and the price is likely to experience a wave of downward movement next.
(2) Specific selling timing
Similar to bottom divergence, in actual combat, based on the principle of multi-indicator coordination, investors can combine the following methods to make the sell signal more specific.
First: Bar color change or MACD death cross
After the MACD bar line and the K-line diverge, if the bar line suddenly shortens significantly, it indicates that the market's downward momentum has begun to release. Investors should pay attention to selling in time. The MACD bar line changes color, indicating that the market's downward momentum has taken advantage. It usually appears after the bar line continues to shrink. If the bar line changes color or the MACD crosses after the top divergence between the bar line and the K-line, investors should pay attention to exit in time.

As shown in the figure above:
On August 9, 2019, the HT1-hour candlestick chart showed that Huobi’s price hit a new high, but the MACD bar did not hit a new high, forming a top divergence between the bar and the price. It shows that the market’s downward momentum has begun to accumulate, and the price may fall at any time.
Subsequently, the MACD bar changes from red to green, sending out a sell signal of "bar divergence from price top + bar color change". Investors should pay attention to exiting the market in time.
Second: Combine with other technical analysis tools and K-line reversal patterns
After the MACD bar line and the price diverge, if other technical analysis tools also show a sell signal at the same time, the reliability of the market selling meaning will be greatly increased. At this time, investors should pay attention to exit decisively. Common sell signals of this type include "bar line and price divergence + K-line reversal pattern".

As shown in the figure above:
On July 20, 2019, the ETH 3-hour candlestick chart showed that the price of Ethereum hit a new high, but the MACD bar did not hit a new high, forming a top divergence between the bar and the price. It shows that the market's downward momentum is increasing, and the price may experience a wave of downward trend.
Subsequently, the MACD bar gradually shortened, and the K-line formed a bearish evening star pattern. Investors should pay attention to exiting the market in time, and then the K-line showed a large downward trend.
Attachment:
Evening Star: During the rising process of K-line, a long Yang line appears first, and a short real K-line (either Yang or Yin) appears the next day. People compare it to a star, which is the main part of the K-line combination. The third K-line is a long Yin line, which has penetrated into the main part of the first K-line. Evening Star is a signal that the price has peaked and is falling back. Some people predict that the accuracy rate is above 80%.
(About some K-line patterns that have reached the top and bottom. We will have several special courses to explain in depth later, welcome to continue to pay attention)
Modification of MACD parameters
The reaction to price changes is delayed, which makes the buying and selling prices sometimes not ideal. This is a defect of the MACD indicator. One way to change this situation is to change the indicator parameters to make the MACD indicator more sensitive to the trend, so that the buying and selling prices can be more ideal.
In commonly used market software, the default parameters of the MACD indicator are 12/26/9. Under such parameter settings, the MACD indicator's response to price changes often has a more obvious lag.
The lag of the MACD indicator can be solved by adjusting the parameters. Commonly used parameter combinations include 5/34/5, 5/10/30, etc. Investors can also try and explore more in practice.

Execution is the hard part of trading, and holding orders is a common problem in investment. Without good execution, no matter how good the strategy is, it cannot be realized. However, due to too many holding orders, even the smallest mistakes are magnified, just like the multiplication of lesions. When you can no longer bear it and leave this market, I guess no one will say goodbye to you. Even if you have been here, no one will remember you a year later. You cannot hold any position by luck when entering the market, and you cannot bet with a full position in any game. If you fail once, you have to pack up and leave. Only a hundred successes can be called success.
After much hard work, I have summarized 10 rules and experience of cryptocurrency trading. Although there is not much content, it is very valuable. If you think it doesn’t make sense after reading it, you can say whatever you want to me!
1. Never buy coins at high prices. You must have this mentality: it can grow as much as it wants, just treat the coin as if it doesn't exist.
2. There are only two types of coins. Coins at the buying point are good coins, otherwise they are junk coins. Coins at the large-scale buying point are the best blue-chip coins. Be patient and wait for the coins that have been built up at a large level to become real blue-chip stocks. This is the real mentality.
3. In fact, the mentality of cryptocurrency trading is the most important. Many people know clearly that it is not a good time to buy, but they can’t help it. This is a mentality problem. If this is not solved, any theory will be useless.
4. Keep a steady mindset, don't have feelings for any currency or point, just look at the market signals. You should have feelings for the buying and selling points. If you have good skills and a lot of funds, for example, you can operate in 30 minutes, then there is no problem of being late at any time.
5. The reason for mistakes has nothing to do with the market. When looking for reasons, you can only look for your own reasons. You must summarize any mistakes immediately.
6. The mentality of being anxious to make money is a taboo for us cryptocurrency traders. If we cannot control our own hearts, greed and desires, we will not be able to succeed in the market for a long time. When we hold the currency, our thinking is controlled by the longs, and vice versa, we are the slaves of the shorts. The market sentiment is accumulated and guided by this. Those who cannot get out of this state will always be unreal market participants.
7. Cryptocurrency trading tests long-term profitability, not one-time profit. The key is a long-term effective trading strategy. When buying, you should think about various situations, be firm in holding, and be even more firm in selling, so that you can gradually improve. You should trade in cryptocurrencies, not cryptocurrencies that trade you. Start with yourself first.
8. The cryptocurrency market will only reward those who are patient. Any good cryptocurrency needs to be nurtured. If you change new coins every day, you will definitely always have small funds and make small moves. Be more focused. If you run around every day, you will definitely not make a lot of money.
9. Dance to the rhythm of the market. As long as you follow the rhythm of the market, you can still walk on the edge of a knife. Rhythm is always the rhythm of the market. A market participant without a sense of rhythm will always be tortured. Put aside your greed and fear and listen to the rhythm of the market. As long as you can follow the rhythm, no one can stop you. The market has a rhythm. Grasp the current rhythm and no one can defeat you.
10. When playing with capital, remember that the power of compound interest is the greatest. As long as you have a good mentality and skills, compound interest is inevitable, and this can overcome everything.
To put it bluntly, playing in the cryptocurrency circle is a contest between retail investors and bankers. If you don’t have cutting-edge news and first-hand information, you can only be harvested! If you want to make a plan together and harvest the banker together, you can come to (Official Account: Gong Zhonghao: Crypto Ah Gui) Welcome like-minded people in the cryptocurrency circle to discuss together~
The martial arts secrets have been given to you all. Whether you can become famous in the world depends on yourself.
You must collect these methods, read them several times, and if you find them useful, you can forward them to more people who trade in cryptocurrencies around you. Follow me to learn more about the crypto world. After the rain, I am willing to hold an umbrella for the leeks! Follow me, and let's go hand in hand on the road to the crypto world!
Continue to follow:$SOL $PEPE $XRP
#币安Alpha上新 #美国加征关税 #MichaelSaylor暗示增持BTC


