If your funds are within 500,000, and you want to succeed quickly in the cryptocurrency world through short-term trading, then please read this post carefully. After reading it, I believe you will suddenly understand the essence of short-term trading!
I am 34 years old this year, have been in the market for 10 years, and have been professionally trading cryptocurrencies for 6 years! Not choosing a financial major in college is a major regret in my life. I started to learn about stocks/finance/foreign exchange, etc. online from the beginning of college. The alternating red and green screens are full of life and fascinate me.
Under the infinite yearning for the market, I opened an account in my sophomore year. Later, I gradually learned about the cryptocurrency world, Bitcoin +, and then through the introduction of a classmate, I learned more and more, and felt very interested and started my investment career.
Author: BTC ChunChun
Link: https://www.zhihu.com/question/1888539293493990955/answer/1888662320097514824
Source: Zhihu
Copyright belongs to the author. For commercial reprints, please contact the author for authorization, and for non-commercial reprints, please indicate the source.
Core four-step method: mechanical execution, violent compound interest
1. Currency Selection Sniper Technique ◦ MACD Golden Cross Hunting: Golden cross above the 0 axis on the daily level is preferred! This type of currency has a strong bullish trend and a success rate of 68% (historical backtesting data), avoid the lure of more traps with the golden cross below the 0 axis.
◦ Case: After Ethereum's MACD golden cross on the water in April 2024, it surged 40% in 3 weeks, outperforming the market by 2 times!
2. Moving Average Lifeline ◦ Fiercely long above the line, chop hands below the line: Price standing firmly on the 20-day moving average = attack signal, breaking below = unconditional liquidation! This line is the dividing line between bull and bear, a break means the main force retreats, don't fall in love with the trend!
3. Position Art ◦ Full Position Charge Conditions: Price + volume double breakout of the moving average (such as BTC breaking through 60,000 with volume), otherwise only use 50% position to test. ◦ Take Profit Secrets: Harvest 1/3 with 40% profit, cut another 1/3 with 80%, let the remaining position run profits, but immediately clear the position if it breaks the moving average!
4. Stop loss is like breathing ◦ Cut immediately when the line breaks! Don't regret it even if there is a V-shaped rebound the next day, discipline is 100 times more important than a single profit or loss! Historically, 87% of liquidations originated from 'wait and see' (data source: research on the history of tears in the cryptocurrency world).
Three Don'ts Principle: Avoid the three major death-seeking behaviors of retail investors
1. Refuse to chase the rise: Rising ≠ opportunity, it may be a prelude to burying people! Wait for the pullback to the moving average or the second MACD golden cross before taking action.
2. Refuse to All in: Going all-in on one coin = entrusting your life to the dealer, at least diversify into 3-5 currencies (mainstream + potential small coins).
3. Refuse to go full position: Leave 30% in cash, buy the dip when it plummets, add when it soars, and always take the initiative!
Six maxims: Read the language of the market and harvest the main force
1. High consolidation hides killing opportunities, low consolidation waits for takeoff - how long it consolidates horizontally, how high it rises vertically!
2. I won't accompany horizontal consolidation to pretend to be dead, the breakthrough direction shows the truth - 80% of the losses come from random operations!
3. Buy secretly when the yin line shrinks, and smash it quickly when the yang line releases volume - go against the emotions and specialize in eating panic selling!
4. Don't catch a sharp drop like a knife, wait for a slow drop to rebound - a sharp drop must have a rebound, a slow drop will have a new low!
5. Sell more as it rises, buy more as it falls - the pyramid building cost is lower than that of the dealer!
6. After a sharp rise and fall, consolidation is the destination - don't guess the top or bottom, wait for the market to choose the direction itself!
Ultimate mental method: Crush the market with discipline • Data speaks: 2023-2024 backtesting shows that investors who adhere to the four-step method + formula have an average return rate of over 300%, outperforming 99% of 'feeling-based' players.
• Counter-human operation: When you want to 'wait and see', immediately execute the strategy; when you want to 'take a gamble', immediately close the exchange!
• Only by surviving can we have a future: One day in the cryptocurrency world is like a year in the human world. It is better to miss 10 opportunities than to fall into a deep pit once!
(Warning: The only reason all strategies fail - DO NOT EXECUTE!)
Remember: Strategy is the sword, discipline is the shield, if the inner demons are not eliminated, liquidation is on the way!
I have sorted out the essence of [Chart Patterns - Complete Guide to Bullish Flag Trading Strategies], as long as you master it well, you can guarantee a 30x return on your account by trading cryptocurrencies with this set of methods. Today I specially sorted out the dry goods and shared them with those who are destined to see them, please collect them carefully.
1. Introduction
The bullish flag pattern may be one of the first chart patterns you encounter in your chart analysis learning process. The pattern is simple in structure and effective. However, many teaching resources often focus on how to identify bullish flags, rather than how to actually trade them.
2. How to discover bullish flag patterns in the right and wrong ways
At this point, you may already be familiar with the bullish flag pattern and its visual characteristics, however, I have observed that many traders tend to complicate the process of identifying the bullish flag pattern, for example: does it need at least 10 candles? Should it follow a specific 'three-step' pattern? Should it contain doji candles? In fact, these are not necessary conditions. Instead, this is the only key point you should remember: After a strong trend, there is a set of indecisive candles. Please note that the bullish flag pattern is a 'continuation' pattern, which provides you with a reasonable entry point to participate in the market trend, which means that if you want to trade at a favorable price in an uptrend, then the bullish flag pattern is your best choice.
Bullish flag on KIRK daily timeframe

Nevertheless, the bullish flag consists of two parts, of which the pole is the most prominent part, as shown in the figure below.
Bullish flag pattern on RELIANCE daily timeframe

Next is the flag, which is where confusion can arise, as shown in the figure below.
Bullish flag on RELIANCE daily timeframe

So, let's explore this phenomenon, if you observe a pole and the price drops sharply, as shown in the figure below.
Sharp move on the NVDA daily timeframe

This phenomenon has clearly revealed that the market trend does not conform to the characteristics of the bullish flag pattern. On the contrary, this sign indicates that the breakthrough we observed is actually a misleading false breakthrough, as shown in the figure below.
False breakout on NVDA daily timeframe

So, what exactly is our target? We are looking for a series of indecisive candlestick patterns, as shown in the figure below.
Indecisive candles on the NVDA daily timeframe

You may ask why pay attention to this indecisive market performance? This is because, if a series of uncertain candlesticks appear after a strong market movement (i.e., the market pole), it indicates that the sellers are trying to push the price down, while the buyers still maintain control of the market. Therefore, if a rapid decline in price is observed after the formation of the market pole, you need a period of observation to confirm that the sellers have not gained market dominance.
That's why we have other chart patterns, such as the ascending triangle, which can be used when prices need more time to form a clear trend, as shown in the figure below.
Potential ascending triangle on the INFY daily timeframe

I don't want us to always focus on the same perspective, because the bullish flag pattern is a highly subjective trading concept, which indicates that the two of us may observe different patterns from the same chart, but this does not necessarily mean that our interpretation is wrong. Even so, if our analysis is consistent in more than 50% of the cases, then I can assume that you are following the correct analysis path.
I showed you examples of successful and failed bullish flags, because the reality is that not all patterns can achieve 100% accuracy, and our goal is to learn how to accurately identify these patterns. Therefore, let's put the previous discussion aside for now and delve into how to accurately identify the details of the optimal bullish flag setup.
3. How to find the best bullish flag on the chart
Imagine that I am now showing you two white shoes, however, suppose I tell you that shoe A is produced by Nike, and shoe B is made by an unknown counterfeit brand, what will happen? In this case, you may be inclined to choose the shoes produced by Nike, because you know that Nike brand shoes have been verified, have good durability, and can withstand long-term use.
The same is true when looking for a bullish flag pattern. Just because you identify a possible flag pattern does not mean that it necessarily constitutes a high-reward-to-risk trading setup. As you understand, bullish flags sometimes form in an established downtrend, as shown in the figure below.
Bullish flag in a downtrend on the QQQ daily timeframe

Or, the pattern may form in a more hidden position within a price range, as shown in the figure below.
Bullish flag on ROKU 4-hour timeframe

Currently, you may have the following questions: So, please guide me on how to identify those bullish flag setups that can bring generous returns. Of course, I cannot guarantee that you will get huge profits, but identifying high-quality bullish flag setups usually involves the following three elements: bullish flag + uptrend, bullish flag + below resistance, bullish flag + trend reversal, the key is to combine chart patterns with price action. Next, let me show you my intentions and analyze the diversity and application of this chart pattern.
(1) Bullish Flag + Uptrend
The most common explanation for the bullish flag pattern is that it is used to identify the right time to enter an established trend.
Bullish flag in an uptrend on the KIRK daily timeframe

This is why you might hear some traders say: I missed that breakout, it looks like I have to wait for the market to pull back. Does this situation sound familiar? However, the key is the following: You need to clarify the type of trend you intend to capture and develop specific trading rules for it. Specifically, when identifying short-term trends, you can consider using the 20-period moving average as a reference; for judging mid-term trends, the 50-period moving average may be a suitable indicator; and when analyzing long-term trends, the 200-period moving average is often used as an important reference standard. You can choose to trade any of the above trends, but to maintain consistency in your trading strategy, it is recommended that you first focus on trading one trend and master its skills by completing 30 to 50 related trades.
(2) Bullish Flag + Below Resistance
A range-bound market is undoubtedly one of the most challenging types of trading environments. It can experience contraction and expansion processes, and is often accompanied by a lot of misleading breakouts.
Complex range of Alibaba daily timeframe

However, it would be ideal if there was a way to accurately predict when a range-bound market will turn into an uptrend. Within a range-bound market, patiently wait for the price to form a bullish flag pattern below the resistance level, as shown in the figure below.
Below resistance on AMZN daily timeframe

The pattern indicates that the sellers are encountering difficulties in pushing the price below the resistance area, while the buyers are showing their willingness to maintain the breakout. So, how should we view the downtrend? How should you identify the trend reversal potential indicated by the bullish flag? Next, we will explore the answer to this question.
(3) Bullish Flag + Trend Reversal
You may also remember that I introduced you to the concept of three trends earlier. With this technique, you will be able to effectively identify trend reversals, whether they are short-term, mid-term or long-term downtrends. Indeed, we are focusing on downtrends because we plan to use the bullish flag pattern to identify the trend reversal, as we discussed earlier. Currently, the first step you need to take is to identify the downtrend and wait for the price to break through the resistance of that trend line, as shown in the figure below.
Structure breakdown of the ETSY daily timeframe

Secondly, wait for the price to form a bullish flag, as shown in the figure below.
Bullish flag on the ETSY daily timeframe

Similarly, once a bullish flag pattern is formed, it not only indicates that the structure of the downtrend has been broken, but also implies that a 'trend reversal' process is underway, which in turn indicates to us that an uptrend may be imminent. Now, I understand that I may have given you the impression that these signals are the trading 'holy grail' that can guarantee profits, however, like any shoe, they can still fail or have problems, and no trade is 100% guaranteed, which is why we manage risk.
Now that you understand where the bullish flag pattern may appear, how will you manage your trades when you trade? Should you set a fixed profit target? Should you use a trailing stop loss? In the following, I will share with you some practical trading strategies that will provide answers to these questions.
4. Bullish Flag Pattern Trading Strategies That Work in Bull and Bear Markets
Before delving into specific strategies, please allow me to introduce you to the basic rules of entry triggers, which will be the common guidelines followed by the three strategies we are about to discuss. The rules are as follows:
Patiently wait for the price to reach the level of the 'highest closing price' from the market pole (i.e., above the highest wick of the candlestick), as shown in the figure below.
Highest closing price on the JNJ daily timeframe

Then, execute the entry operation when the immediately following candlestick opens, as shown in the figure below.
Bullish flag pattern entry trigger for JNJ daily timeframe

For the trading strategies I am going to show you, the entry trigger rules remain the same, because the entry only occupies a small proportion in the overall trading equation, which indicates that the art of trade management is the key to determining the success or failure of a trade, rather than the specific way of entry. Therefore, you should not overemphasize how to accurately enter the bullish flag pattern. With these premises, let's officially start the discussion.
(1) Strategy 1: Bullish Flag Trend Continuation Strategy
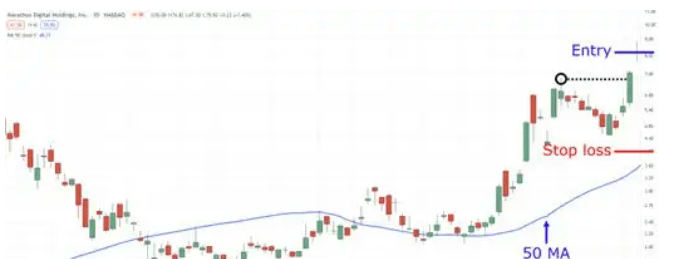
Assuming your goal is to capture the mid-term trend, so you will use the 50-period moving average as a reference. Currently, what you expect is that the price is above the 50-period moving average, as shown in the figure below.
Price above the 50-period moving average on the MARA daily timeframe

Then, you should patiently wait for a suitable bullish flag pattern to form and set the stop loss below the lowest point of the flag pattern, as shown in the figure below.
Entering the bullish flag on the MARA daily timeframe
Of course, any trading strategy that lacks exit rules is incomplete. In this case, you should consider using the 50-period moving average as the benchmark for a trailing stop loss, which indicates that you will maintain the trading position without exiting until the price closes below the moving average, as shown in the figure below.
50 MA trailing stop loss exit MARA daily timeframe

I understand that this strategy looks very basic, but that's what it should be, because the more random variables you introduce into your trading strategy, the harder it is to discern which factors are effective and which are not (and which need further improvement or optimization). Nevertheless, if you are a trend-following trader, then this strategy will be very suitable for you.
(2) Strategy 2: Bullish Flag Range Breakout Strategy
When using this strategy, your technical analysis skills will be tested. By now, you should have mastered drawing support and resistance levels. Remember, the strategy currently discussed is a range breakout strategy, which means you need to identify a range-bound market and accurately mark its support and resistance levels, as shown in the figure below.
Support and resistance levels for FCEL daily timeframe

After you have successfully drawn the trading range, the next step is to observe whether the price touches the support area and forms an effective bullish flag pattern in or below that area, as shown in the figure below.
Bullish flag setup for FCEL daily timeframe

At this stage, we cannot yet predict what type of trend will form if the market continues to develop. I suggest you set your profit target below the next resistance area marked on the chart, as shown in the figure below.
Fixed take profit for bullish flag pattern in FCEL daily timeframe

Similarly, you should already be proficient in drawing support and resistance levels. Given this, if you are interested in improving your skills in marking these key levels on the chart, you can read the relevant guide.
(3) Strategy 3: Bullish Flag Trend Reversal Strategy
Please remain objective, but this strategy may be my personal favorite of the three strategies I have introduced, the reason being its simplicity. Since this is a trend reversal strategy, you need to look for a market environment in a downtrend, so the harder the market is hit, the better the situation (which is the most attractive part of this strategy), as shown in the figure below.
Downtrend on the U daily timeframe

Once the market price breaks through the upper trend line resistance, you immediately expect the price to form a bullish flag pattern at this position, as shown in the figure below.
Bullish flag on U daily timeframe

Bullish flag entry and stop loss on the U daily timeframe

Please allow me to emphasize again that if a bullish flag pattern is not formed, then you should not trade, because the lack of this pattern indicates that the price level is not effectively supported, so the possible breakout is false. Finally, I recommend using a strict trailing stop loss strategy, such as using the 20-period moving average as a reference, because the current trend may never develop further, or the market may be forming a new trading range, as shown in the figure below.
20 MA exit on U daily timeframe

Therefore, you should close your position immediately after the trailing stop loss is hit, rather than setting a fixed profit target.
You may be thinking about the following questions: Is this strategy effective in the Indian market? Does it apply to forex trading? Does it apply to cryptocurrency trading? The answers to these questions are all yes. But please be sure to pay attention to the following: In order for this strategy to truly effectively expand your trading portfolio, you must implement strict risk management measures, establish clear market selection criteria, and always follow your trading plan to execute trades.
5. Conclusion
Here is an overview of the core points of this guide:
(1) The bullish flag pattern consists of a significant upward movement (i.e., market pole) followed by a series of hesitating candlesticks forming the flag.
(2) Before using the bullish flag pattern to trade, it is crucial to first identify the overall trend of the market price.
(3) The bullish flag pattern can be used to capture trend continuation, trend reversal, and breakouts in range-bound markets.
Share some tips about the cryptocurrency world: don't short in a bull market, don't long in a bear market; don't kill the dip in a bull market, don't chase the rise in a bear market
1. Buying depends on patience, selling depends on determination, and holding depends on confidence.
2. Buy when small dips occur during the rise; sell when small rises occur during the fall.
3. Buy in installments, don't lose money; buy all at once, lose a lot of money.
4. Support levels that are defended for a long time will inevitably be lost, resistance levels that are attacked for a long time will inevitably be broken.
5. Both bears and bulls can make money, only the greedy do not.
6. Eat eight points full for meals, earn eighty percent in trading
Currently in a bull market, the situation is surging, and we share passwords every day.
I still say that, if you don't know how to do it in a bull market, click on my avatar, follow me, bull market spot planning, contract password, free sharing.
Stay tuned:$PYTH $NXPC $BICO
#币安Alpha上新 #Strategy增持比特币 #山寨季何时到来?


