1 What are QE and QT?
Quantitative easing (QE) is a policy of a country's central bank that involves the purchase of financial assets on the open market. The regulator injects liquidity into the economy to stimulate interbank operations with the aim of lowering interest rates.
Quantitative tightening (QT) is the opposite of QE, a policy of the central bank that involves selling financial assets on the open market. QT implies withdrawing liquidity from the economy with the aim of raising interbank rates.
The Fed's target rate on loans, although announced during agency meetings, is actually achieved through operations in the open market. To raise the interest rate, the regulator sells assets from its balance sheet to banks and other private organizations. To lower it, the Fed buys these assets from market participants.
Ideally, the central bank should only buy and sell government bonds, but in reality, regulators buy mortgages and even securities of private companies. Decisions on operations depend on market conditions and the goals of the central bank.
2 When did QE and QT appear?
The pioneer in quantitative easing policy is the Bank of Japan. The reasons for launching QE were the consequences of the crisis caused by the collapse of internet company markets in the early 2000s, as well as near-zero interest rates on loans and a continuing recession. All of this prompted the Japanese regulator to launch a quantitative easing program in March 2001.
It is believed that the new approach has solved problems accumulated under the policy of near-zero interest rates, which had hindered economic growth in developed countries. In fact, central banks began issuing new money to repurchase their own government bonds, that is, debts they had previously sold to commercial banks and other market participants.
The start of the first QE in the U.S. was announced in 2008 as a response to the global financial crisis. By the way, at the same time, Bitcoin creator Satoshi Nakamoto published the Bitcoin white paper.
Since then, the U.S. has conducted three more rounds of QE: in 2010, 2012, and 2020. By April 2022, these measures allowed the Fed to buy assets worth nearly $10 trillion.
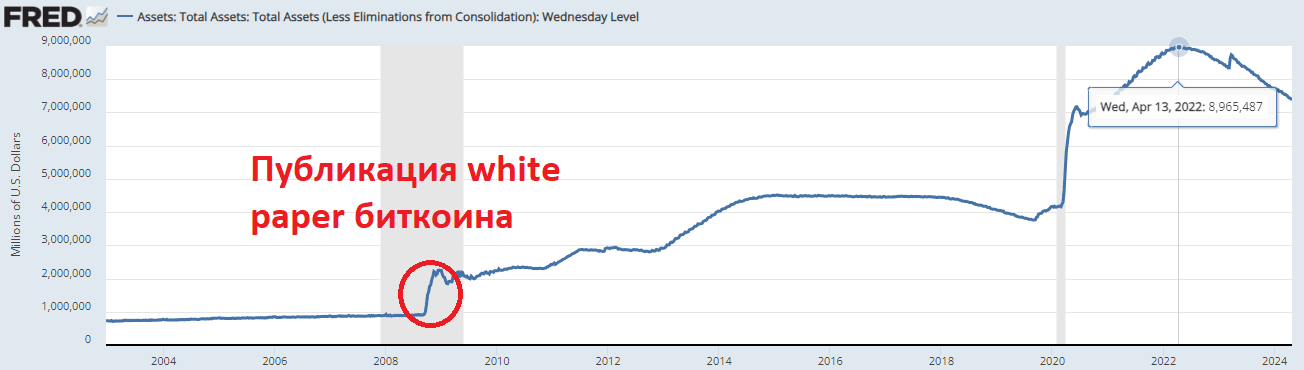
The largest QE was conducted in 2020–2022 during the coronavirus pandemic. The Fed's balance sheet doubled to nearly $9 trillion. For comparison, the annual GDP of the U.S. for 2023 was $27 trillion, while the total market capitalization of the cryptocurrency market at its peak in 2021 was estimated at $2.8 trillion.
As of early May 2024, the U.S. continues its monetary policy of quantitative tightening that began in mid-2022. As mentioned earlier, QT means withdrawing money from the economy by selling securities accumulated under QE on the open market.
3 What is shadow QE/QT?
Direct quantitative easing/tightening is not the only tool for controlling the money supply in the market. There are a number of 'shadow' mechanisms that can have an impact.
One of the most popular tools is reverse repo operations. This is a debt transaction that involves borrowing money secured by securities with a repurchase agreement after a specified period of time.
The tool became actively used after the 2012 crisis. During the pandemic, reverse repo transactions became an integral part of the Fed's monetary policy, peaking at over $2.5 trillion in 2022.
This tool is widely used to provide banks with almost free loans secured by securities.
Even if the Fed conducts an open policy of quantitative tightening, the Federal Reserve has many tools for local shadow QE, that is, infusions of money.
4 How does monetary policy affect cryptocurrencies?
One of the common misconceptions is the belief that the cryptocurrency market is independent of traditional finance and operates separately. However, cheap money that flows to banks from the Fed through both direct and shadow QE is used by players for speculation on any trading platforms. Cryptocurrencies are no exception.
Let's take a look at the so-called liquidity chart, which includes the Fed's balances, reverse repos, and the operational account of the U.S. Treasury.

Since the beginning of 2020, when the Federal Reserve started QE policy, a clear correlation has emerged between the charts. Almost any liquidity infusion and withdrawal was reflected in the price of both the index of the largest traditional companies and the first cryptocurrency. The start of QT and the withdrawal of money from the markets also affected the prices of traded assets.
Despite the fact that Bitcoin was created as an alternative to the 'corrupted' financial system, the growth of the cryptocurrency market attracted players from the old system with the same rules and objectives. This is how the correlation arose.
