Okay, let's get started.
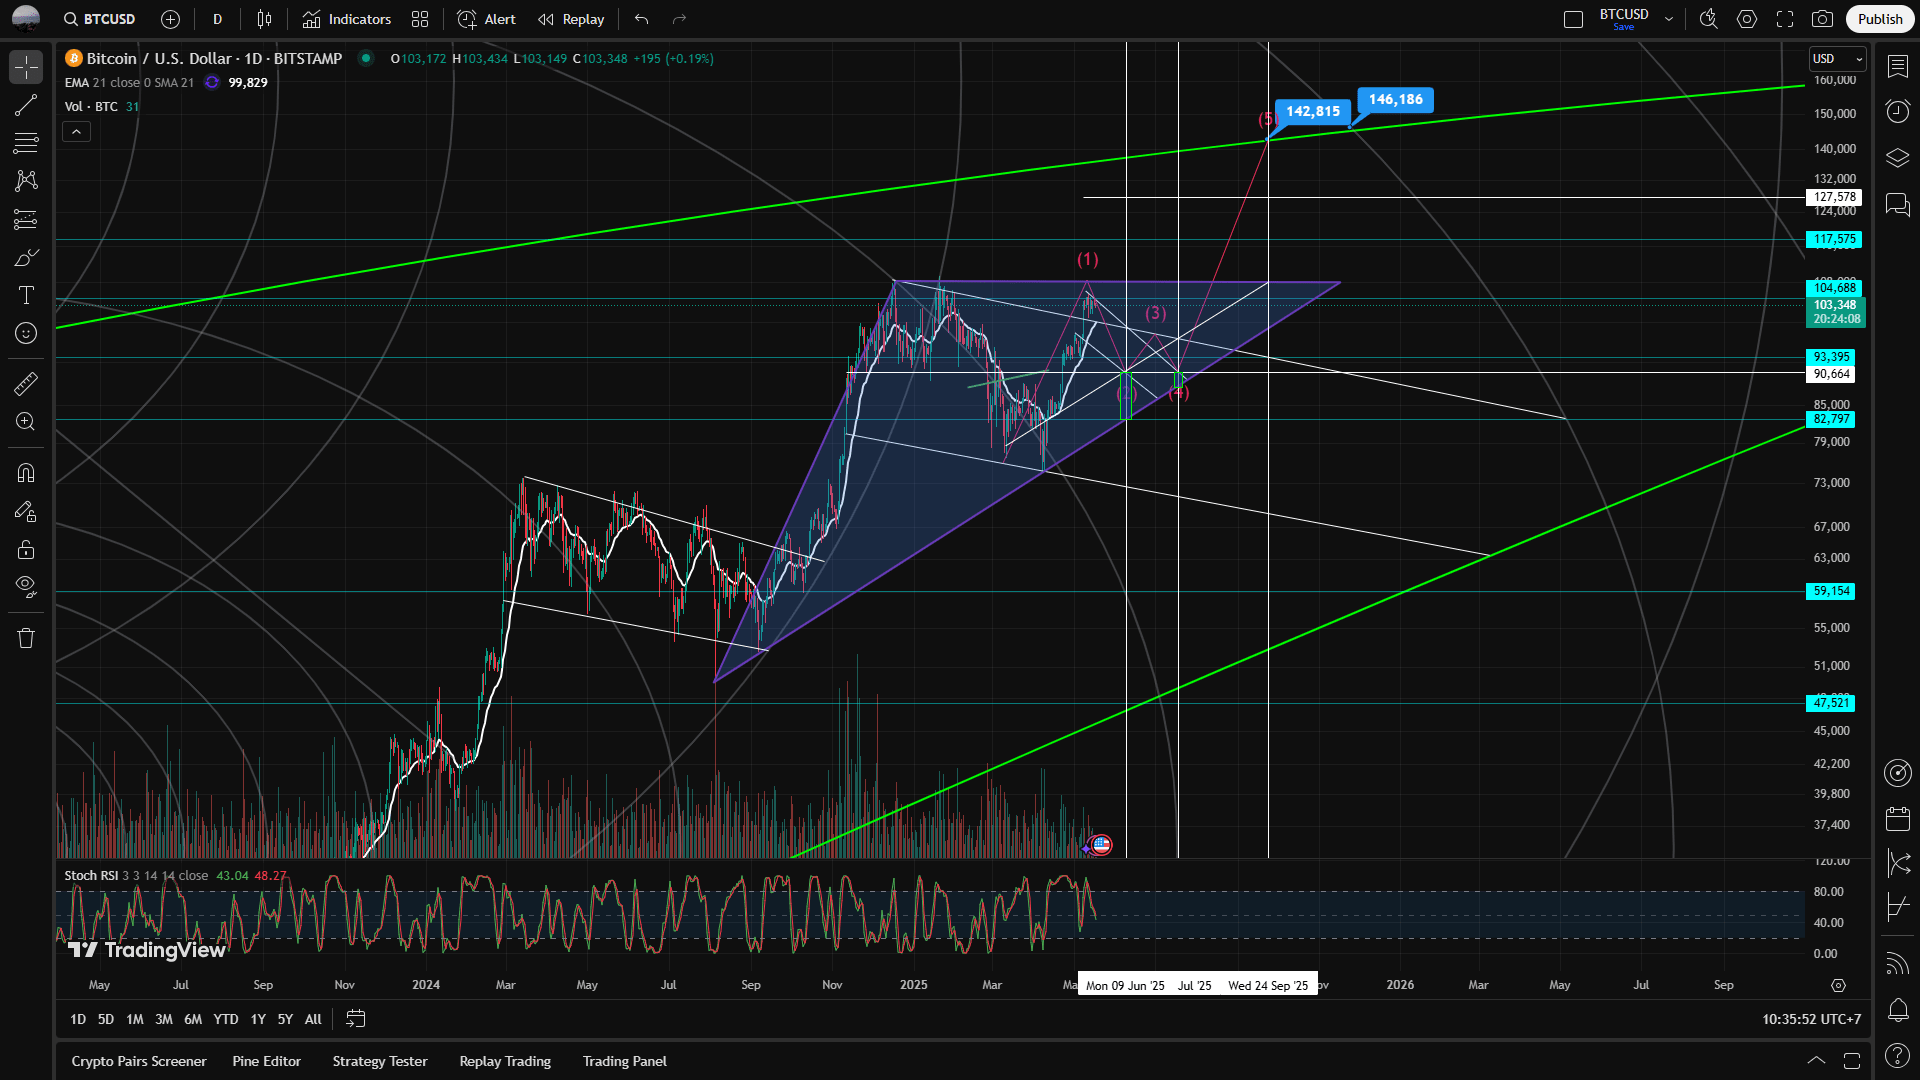
There are more than 1 patterns on the bitcoin chart, the most obvious are the bullish flag and the ascending triangle.
If we focus on the ascending triangle, we see a strong bullish that will occur in the near future, which is only a few weeks away, but if we look at it from a bullish flag perspective, we are still at the highest point that has the potential to experience a correction.
However, there is good news for Bitcoin, namely when the two patterns are interconnected like my analysis, Bitcoin will experience a very fantastic price increase of around +50% or around $142k-$146k by the end of 2025.
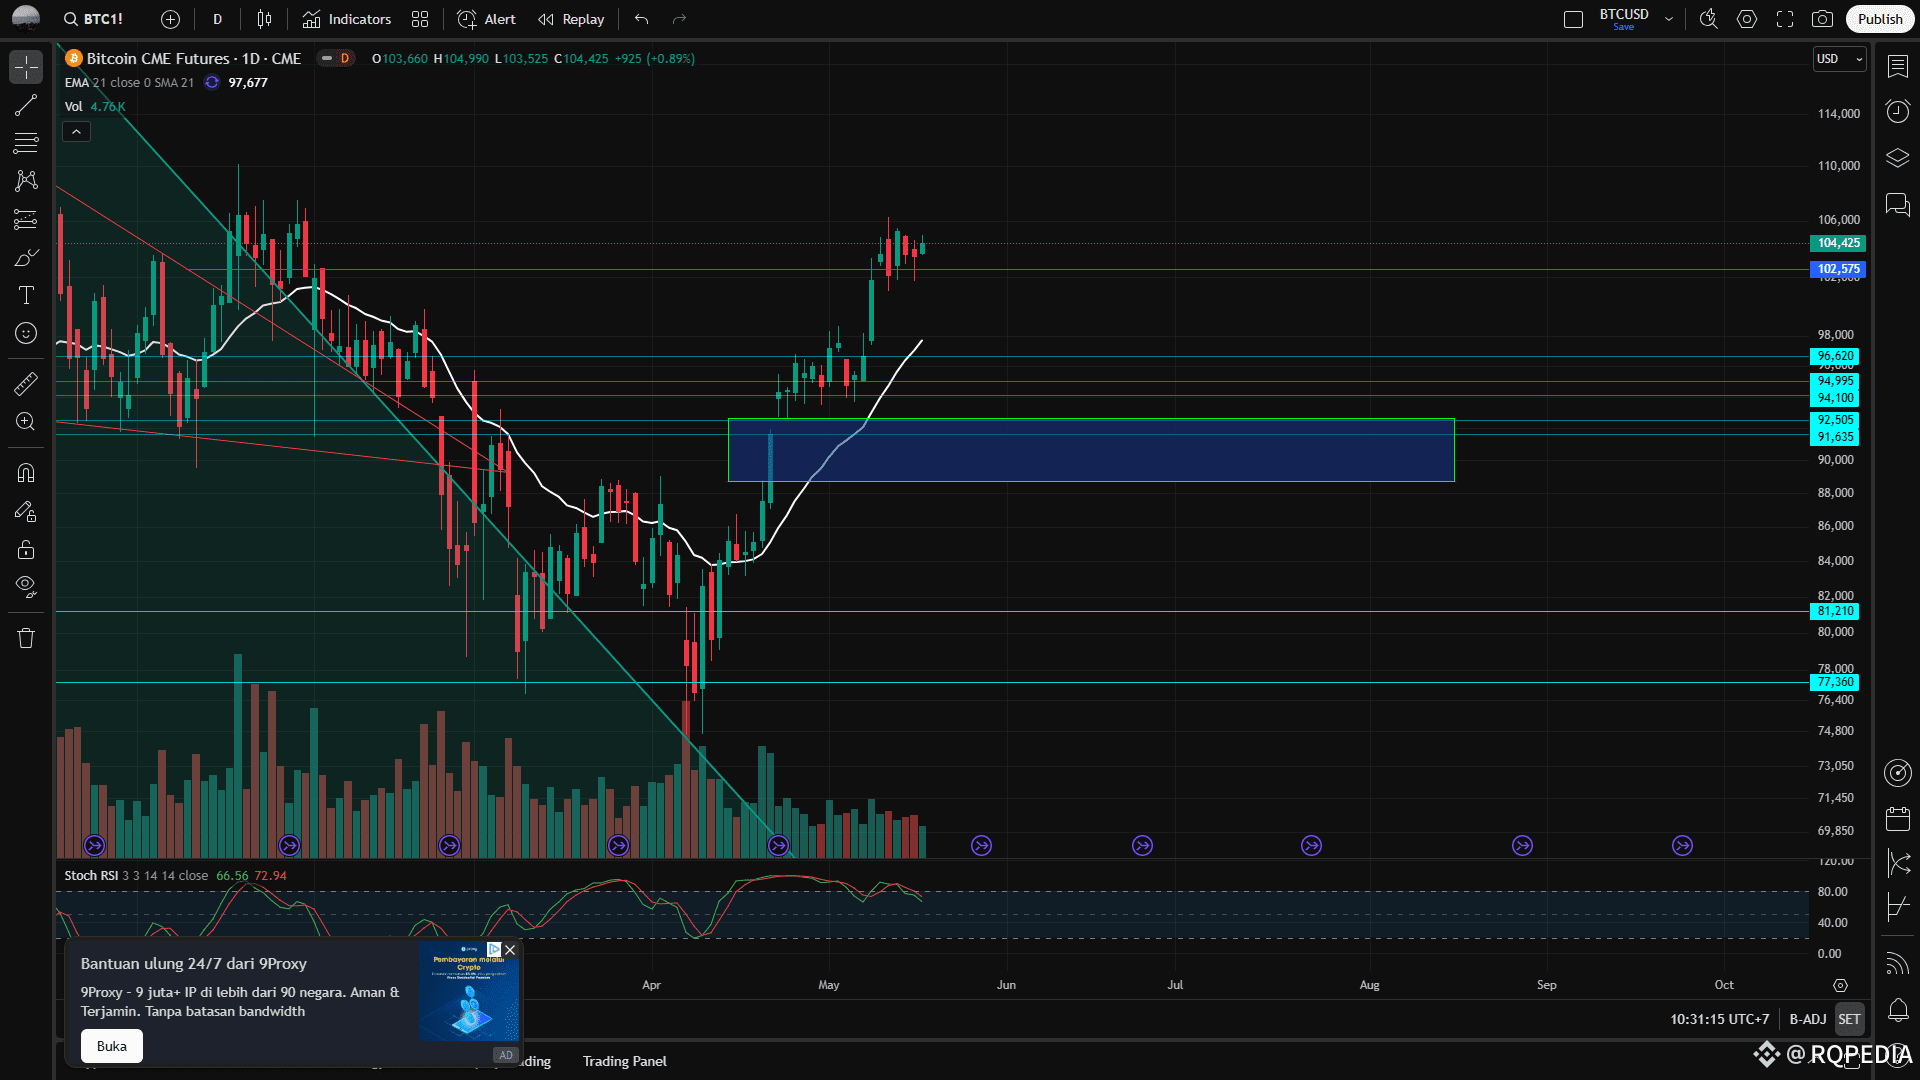
Before that happens, bitcoin will experience a price decrease of around -14% to -21% from the current price of $90,600 to $82k, how can the price fall like that? before the market moves up like now, bitcoin leaves a GAP on the Bitcoin CME in the $91k area, so bitcoin has a very high potential to fall to that price.
So the conclusion is, never feel too late to buy bitcoin because the market is not always bullish, there is a time to buy and sell, then the market in bitcoin is not only a spot market but there is even trading leverage that makes the bitcoin market seem like it can be manipulated.
