#BTC走势分析 Here we go! I'm back today to share key positions for Bitcoin, with fresh and hot data, let’s get straight to the point~ 📈
🔥 Resistance level (the key point for bulls to break through)
1. $105,000-106,000
Wow, this position is simply the bear's den! Last week when the price surged to 106,000, bears directly smashed huge sell orders, pinning the price down. If the closing price this week cannot stabilize above 105,000, many people may have to cut losses and run.
2. $104,000
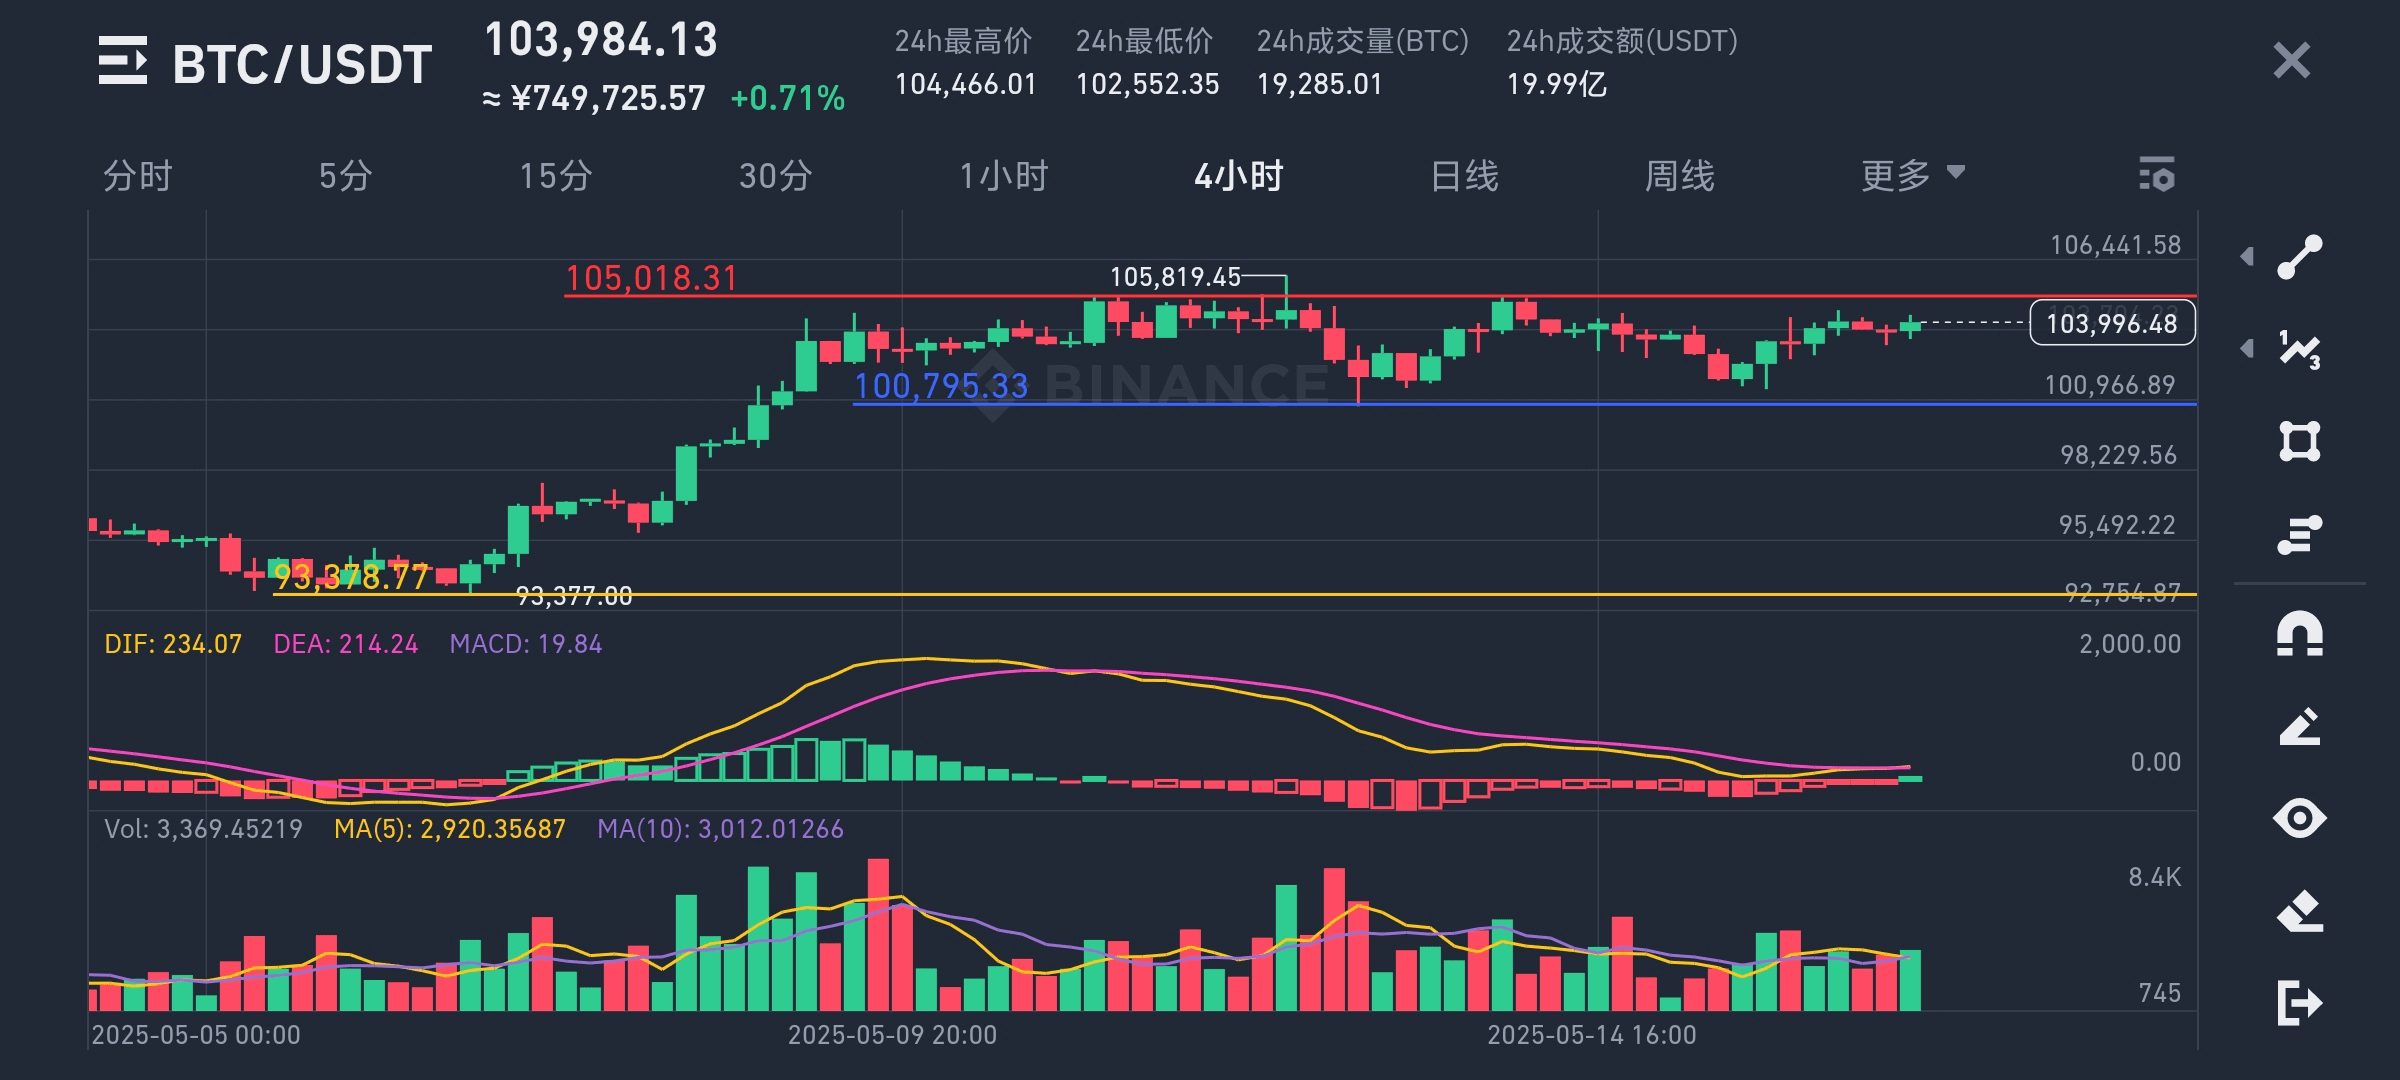
The current price is hovering around 103,000; to push higher, it must first overcome this hurdle. If it fails to break through, it is likely to retrace to the support level below, giving shorts a chance to take profits.
3. $105,442
The recent 4-hour chart's highest point, the MACD indicator has turned green, indicating bulls may be weak. If it can't push up this time, it might be done for.
🛡️ Support level (the defense line bears need to break)
1. $101,000-102,000
This is the lifeblood of the bulls! On-chain data shows that 97% of Bitcoin above 102,000 is profitable, and the 50-day moving average is also supporting here. If the price drops to this level and shows a long lower shadow, it is a clear bottom-buying signal!
2. $100,800
4-hour chart trend line support, the lower line of a triangle consolidation. If it breaks below this position, it is likely to head straight to the Fibonacci retracement zone of 96,500-98,000, where bears can make a fortune.
3. $93,000
The opening price at the beginning of the year, historically strong support. If the resistance at 106,000 remains unbroken for a long time, the price may retrace here, at which point it will be an opportunity to buy at a lower price.
📊 Key indicators and market dynamics
- Moving averages: The 20-day moving average (103,260) has now become a roadblock, the price needs to stabilize above this line to continue rising.
- Fibonacci: The 61.8% retracement level (96,556) is a key mid-term level; breaking it may trigger a larger adjustment, bottoms buyers need to be cautious.
- Capital flow: Bitcoin's dominance has dropped to 62%, with funds flowing into altcoins, but BlackRock's ETF is still aggressively buying (net inflow of 2,494 BTC on May 15), institutions are still optimistic in the long run.
- Macro factors: US PPI decline alleviates inflation, but the Federal Reserve maintains interest rates, policy is temporarily stable, but external news still needs to be monitored.
💡 Trading suggestions (for reference only)
- Short-term: Price stabilizes at 101,000-102,000, K-line shows long lower shadow or RSI rebounds, take a light long position, target 104,000, stop loss set below 100,500.
- Medium-term: Gradually accumulate at 96,000-99,000, long-term target 105,000-110,000, hold on and don’t panic.

- Risk warning: Focus closely on the 106,000 resistance, closing below may dip to 93,000. Federal Reserve policy and US economic data are the biggest variables, don't get overly excited, manage your positions well!
Summary: Bitcoin is currently stuck around 103,000, a short-term breakout above 105,000 is needed for a chance; otherwise, it may continue to fluctuate. Everyone, trade according to your own risk tolerance, don’t be reckless when you profit, and don’t panic when you lose, see you in the comments section! 🚀#btc $BTC #BTC