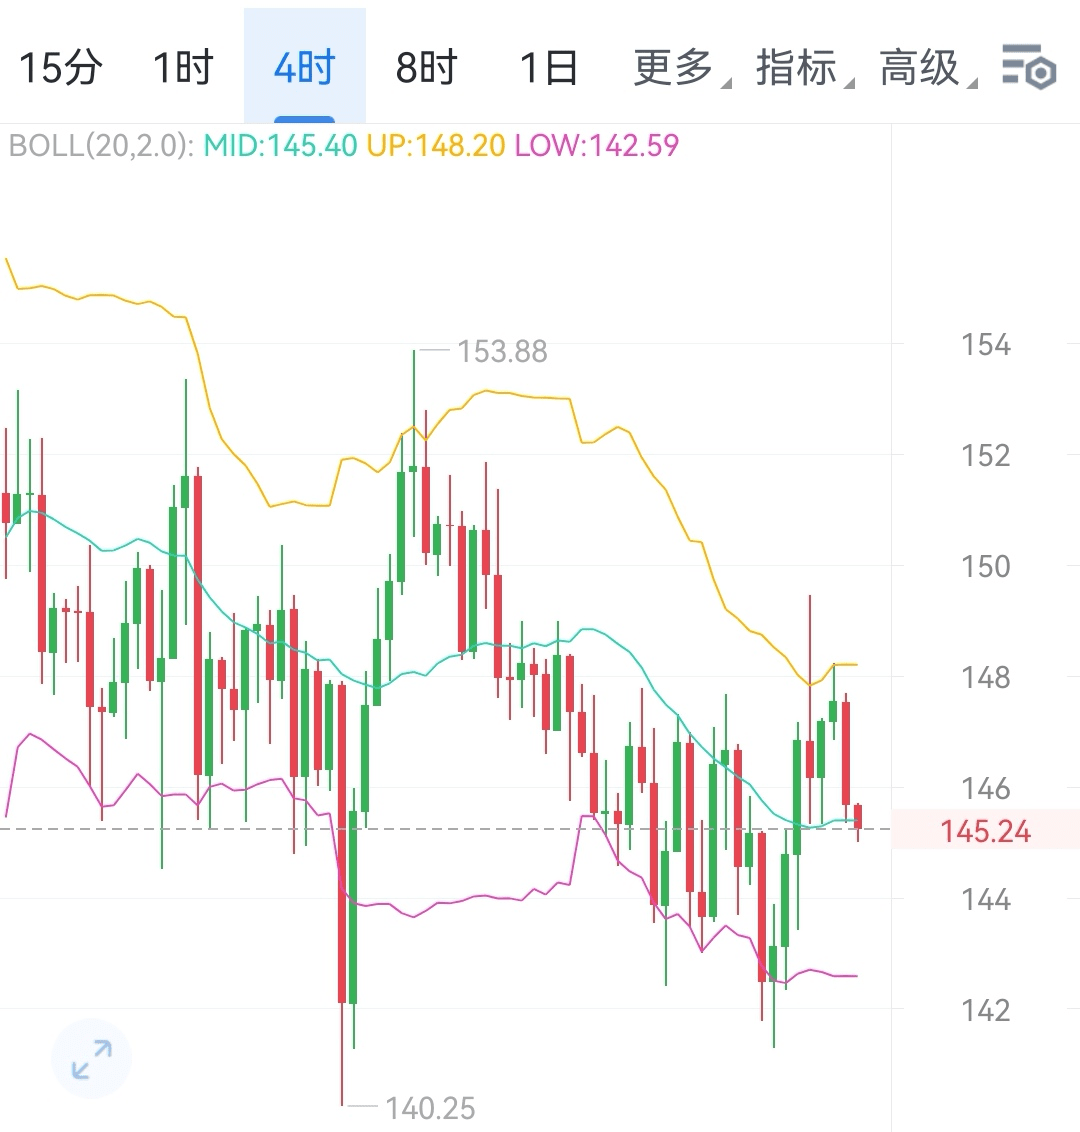
1. Core key point: 145.4 is the dividing line for bulls and bears on the 4-hour level
The current SOL price is at a key node of the short-term trend, with the 145.4 level being an important battleground for both bulls and bears, its significance is reflected in:
- Technical signals:
- This level is a recent support/resistance conversion point that has been tested multiple times on the 4-hour chart. If the price stabilizes above it, it indicates that short-term bullish strength is dominant, and the market may continue to trend upwards; if it breaks below, it may trigger a 4-hour correction, or even shift to a bearish dominance.
- Volume cooperation is key: If it stabilizes with a moderate increase in trading volume, the upward trend is more reliable; if it breaks below with volume, the retracement may intensify.
Second, the upward space and resistance level after stabilizing at 145.4
If the price continues to operate above 145.4 at night, bulls may push the market towards higher targets, needing to focus on the following resistance levels:
1. First resistance level: around 149
- Corresponding to the short-term high point in early May, also the dynamic resistance area of the upper Bollinger Band (4-hour cycle), there may be slight fluctuations before breaking through.
2. Second resistance level: around 151.4
- This position is the upper edge of the dense transaction area formed from late February to early March, with selling pressure from trapped positions. Once broken, it may open up mid-term upward space.
3. Third resistance level: around 154
- Approaching the relative high of the year (with 2025 as the time background), this is a psychological barrier for the market. If touched, one should be cautious of the risk of bulls taking profits leading to a pullback.
3. Support and risk warning after breaking below 145.4
If the price drops below 145.4 at night, the short-term trend may shift to adjustment, with the following support levels for reference:
1. First support level: around 143
- Corresponding to the dynamic support area of the 50-day moving average (MA50) on the 4-hour level, if it stabilizes here, it may form a 'double bottom' structure, supporting a rebound.
2. Second support level: around 140.2
- This position is the lower edge of the fluctuation range in mid-April, with strong buying support. If it breaks below, it may further probe lower ranges.
3. Third support level: around 138
- Corresponding to the phase low point in late March, it is an important defense level for the medium to long-term trend. If lost, beware of the market turning into a medium-term weakness.
4. Operational ideas and risk control
1. Bullish strategy:
- If the price stabilizes at 145.4, consider a light long position, targeting sequentially at 149 and 151.4, with a stop-loss set below 145.4 (e.g., at 144.5).
2. Bearish strategy:
- If the price effectively breaks below 145.4 (e.g., if the 4-hour closing price is below this level), a light short position can be attempted, targeting sequentially at 143 and 140.2, with a stop-loss set above 145.4 (e.g., at 146.3).
3. Position management:
- Cryptocurrency is highly volatile; it is recommended to control a single trade position at 3%-5% of total funds, strictly set stop-losses to avoid holding positions.
5. Summary: Focus on key points and respond flexibly based on market sentiment
Night-time market needs to closely monitor the bullish and bearish breakout direction at 145.4, avoiding premature predictions. If the price fluctuates within the range (e.g., 143-149), one can sell high and buy low; if there is a clear breakout of resistance or support, follow the trend while considering trading volume and market news (e.g., public chain ecological dynamics, macro policies) for comprehensive judgment.$SOL #SOL走势