1. Key Position Analysis and Market Logic
1. Bull-Bear Watershed: 94100
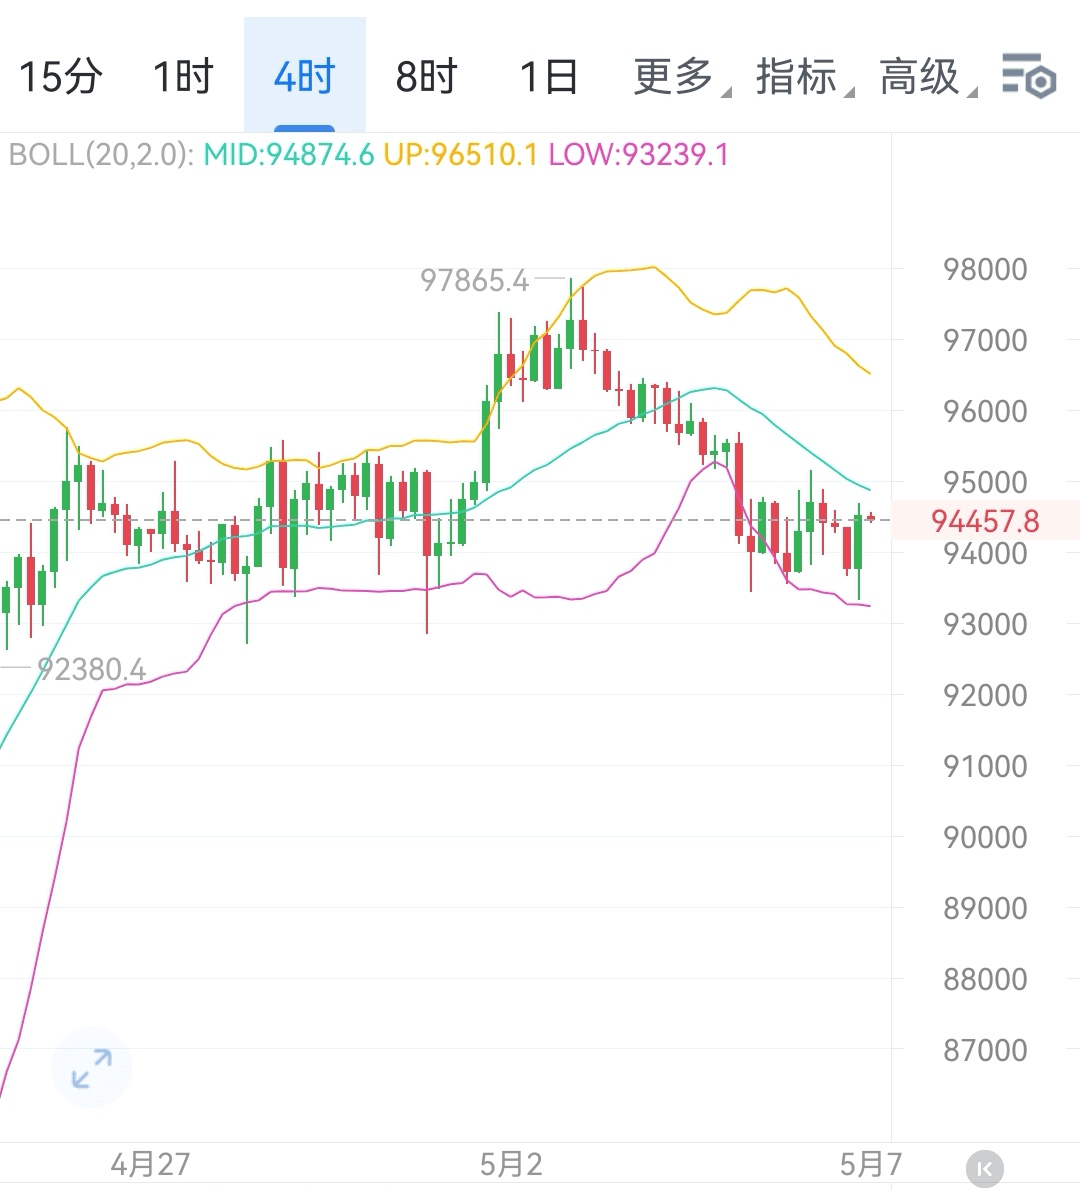
- Technical Significance: This position is the dividing line for short-term trend strength at the 1-2 hour level. If the price stabilizes above this level, it indicates that short-term bullish power is dominant, and the market is expected to continue rebounding; conversely, if it breaks below, it may shift to bearish dominance and enter a retracement cycle.
- Market Logic: This position corresponds to the upper middle of the recent horizontal range (93445-94880). Whether it breaks will determine the short-term capital flow—stabilizing will attract chasing funds, while breaking below may trigger stop-loss selling.
2. Upper Pressure Level Ladder
- First Target: 94880 (Top of the Horizontal Range)
This position is the upper bound of the recent oscillation range. If the price breaks through and stabilizes, it will open up upward space and further challenge higher pressure levels.
- Second Stage Pressure: 95665-96448-97300
These three positions correspond to historical trading dense areas and Fibonacci extension resistance levels, each corresponding to different cycle selling pressure nodes. A breakout requires accompanying volume.
3. Lower Support Level Ladder
- First Defense: 93445 (Bottom of the Horizontal Range)
As the lower bound of the oscillation range, if the price falls below 94100 and finds support here, it may form a 'double bottom' structure, triggering a technical rebound; if it breaks below, it confirms a short-term weakness.
- Deep Pullback Targets: 92720-91620-90455
Corresponding to the 50% Fibonacci retracement level, recent lows, and whole numbers, if bears continue to exert pressure, it may seek support down to this level.
2. Operational Strategies Based on Scenarios
1. Scenario One: Price Stabilizes Above 94100
- Signal Confirmation: 1-2 hour K-line closing price continuously stabilizes above 94100 for 2 consecutive candles, and trading volume moderately increases.
- Operation Suggestion:
- Short-term traders can accumulate long positions in batches at low prices, targeting first at 94880, after breaking through, move the stop-loss to 94100, further aiming for 95665.
- If it encounters resistance at 94880 and falls back, reduce positions or take profits, and wait for confirmation of support at 94100-94300 before deciding whether to enter again.
2. Scenario Two: Price Falls Below 94100
- Signal Confirmation: 1-hour K-line closing price falls below 94100, and the rebound fails to regain this position.
- Operation Suggestion:
- Short-term bulls can stop-loss and exit, bears can try short positions with light positions, first target 93445, if it breaks, then look down to 92720, stop-loss set above 94100.
- If the support at 93445 is valid (such as a long lower shadow, reduced trading volume), try to bet on a rebound, targeting to look back at 94100, stop-loss set below 93000.
3. Risk Warning and Market Sentiment Management
- Position Control: Regardless of bullish or bearish, it is recommended that a single trade position does not exceed 10% of total funds to avoid a single fluctuation exceeding the risk control line.
- Beware of Spike: The night market has low liquidity, making it easy to experience extreme short-term fluctuations. It is recommended to set conditional orders rather than market orders to prevent slippage losses.
- Emotion Management: If the market is stuck in a sideways range (like narrow fluctuations between 94100-94880), reduce trading frequency and wait for clear directional signals to appear.
4. Summary
Core Logic: Night market revolves around 94100 in a tug-of-war between bulls and bears, with short-term trends depending on the breakout strength of the hourly K-line at key positions and the accompanying volume. An upward breakout requires attention to the volume-price relationship at 94880, while a downward breakout requires vigilance against the chain reaction triggered by breaking the bottom of the horizontal range.
Operation Mantra:
- Stabilize above 94100, look up at the horizontal top; break through for higher; face pressure to take profits.
- Breaking below 94100, seeking the bottom of the horizontal range; if it breaks, look deeper, support to bet on a rebound.
It is recommended that traders closely monitor hourly trends and use technical indicators such as MACD and RSI to assist in judgment. At the same time, pay attention to the impact of U.S. stock futures and macro news on the cryptocurrency price, and adjust strategies flexibly.$BTC #BTC走势分析