1. Key position analysis
Currently, Ethereum is in a small range of consolidation and oscillation; focus on the following price levels for the contest between bulls and bears:
1. Consolidation zone support band:
- First support level: 1813 (strong weak dividing line at small level). If it stabilizes above this position, a small level (1-2 hour cycle) may open a rebound, targeting the top of the consolidation zone at 1830.
- Support on decline: If 1813 is lost, look down to the bottom of the consolidation zone at 1791, which is a short-term bullish defense line. If not broken, it may maintain a fluctuating rebound rhythm; if broken, it opens downward space, with successive attention to 1780 (whole number level), 1762 (near previous low), and 1730 (strong support at daily level).
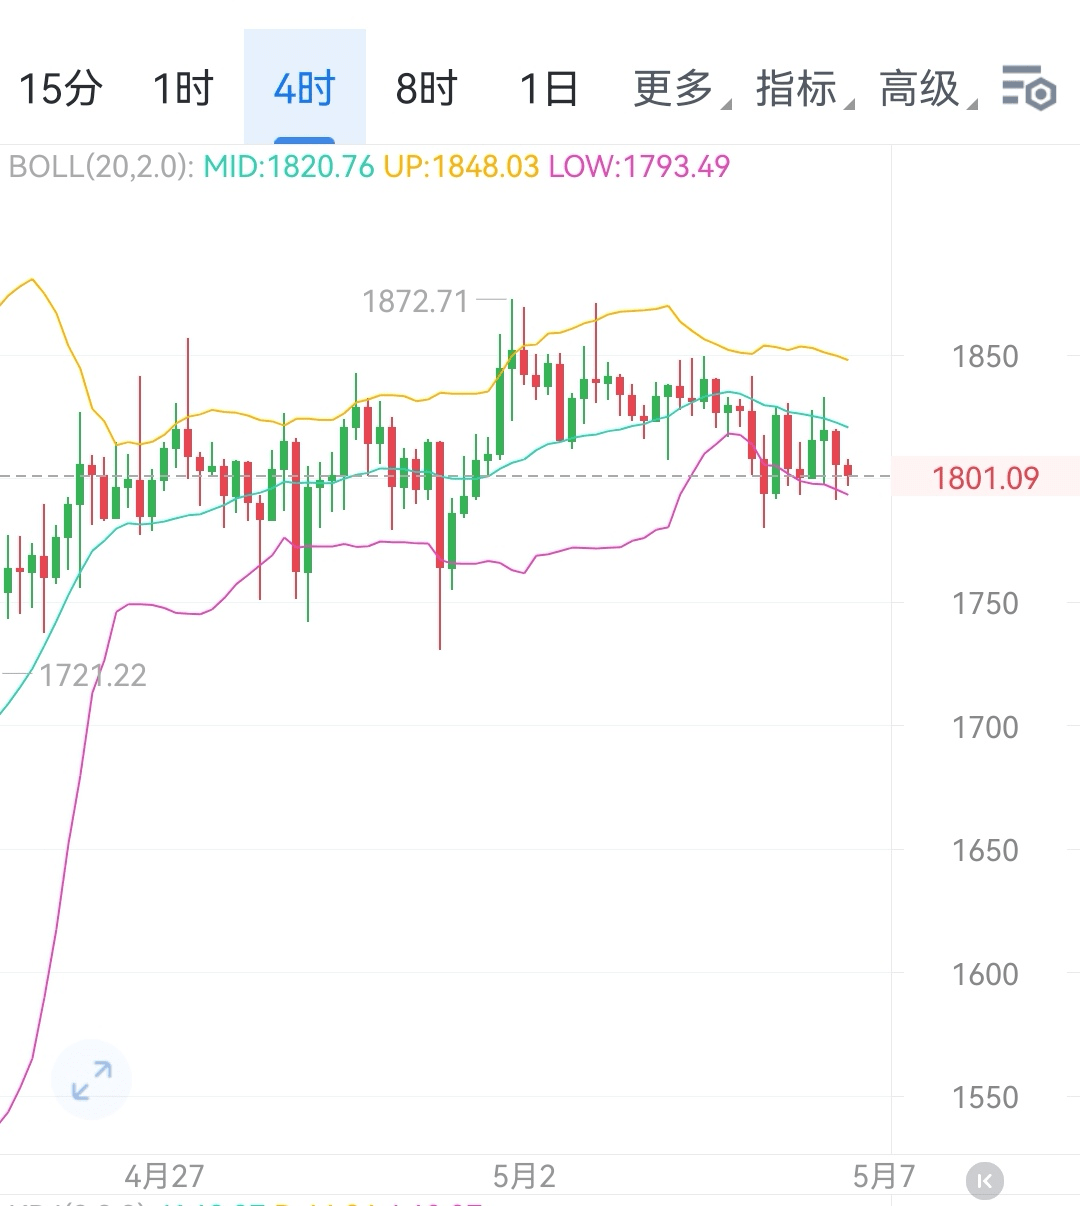
2. Pressure level ladder:
- The top of the consolidation zone at 1830 is short-term resistance; after breaking, the upper pressure level looks at 1848 (previous high) and 1872 (daily-level trend line resistance), breaking the latter may open upward space.
2. Operation strategies under different trends
1. Stabilize above 1813, rebound to test 1830
- Signal characteristics: Closing above 1813 on the 1-2 hour chart, trading volume moderately increases, showing bullish engulfing or other reversal patterns.
- Strategy suggestion:
- Short-term long position: Lightly long near 1813, stop loss 1800, target 1830, keep the position to see 1848 after breaking.
- Risk warning: If rebounding near 1830 meets resistance (e.g., a long upper shadow appears), consider taking profits on part of the position to guard against pullbacks.
2. Breakout above 1830, betting on upward space
- Signal characteristics: Breakout above 1830 with continuous bullish candles on the hourly chart, trading volume increases by more than 20% compared to the previous day.
- Strategy suggestion:
- Aggressive follow long: Timely follow-up after breaking, stop loss 1820, target 1848, looking at 1872 after breaking.
- Medium-term idea: If it stabilizes above 1830 and does not break on pullback, consider building positions in batches, targeting a daily-level rebound (e.g., 1900 level).
3. Losing 1813, look down to 1791 support
- Signal characteristics: Continuous bearish candles break below 1813 on the 1-2 hour chart, trading volume increases, showing a trend of declining.
- Strategy suggestion:
- Short position: Lightly short near 1810, stop loss 1825, target 1791, look down to 1780 after breaking.
- Wait-and-see signal: If it drops to near 1791 and a decrease in volume occurs with a doji star, consider pausing short positions and waiting for a rebound or breakout confirmation.
4. Breaking below 1791 opens a downward channel
- Signal characteristics: Effectively breaks below 1791 (if two consecutive hourly candles close below), price rapidly declines.
- Strategy suggestion:
- Trend-following short: If it rebounds to near 1795, consider adding to the short position, stop loss 1805, target 1762, look at 1730 after breaking.
- Bottom-fishing tips: Unless there is a clear bottom divergence (e.g., price makes a new low but the MACD indicator does not), it is not recommended to bottom-fish in advance.
3. Operational precautions
1. Position management: Control the position within 20% during trading in the range, and may appropriately increase to 30% for breakout trades but must strictly set stop losses.
2. Time cycle: Focus on the 1-hour and 2-hour chart patterns, avoiding misjudgments due to small cycle (e.g., 15 minutes) fluctuations.
3. Correlation: The Ethereum trend usually follows Bitcoin (BTC), pay attention to Bitcoin's breakout situation at 94800/93445 to assist in judging Ethereum's direction.
4. Impact of news: Be cautious of the correlated fluctuations during the night stock market opening period (after 21:30), and avoid heavy betting before data releases.
4. Summary
Ethereum's short-term trend depends on the breakout direction between 1813 and 1791: if it stabilizes above 1813, it is expected to rebound and test the pressure at 1830, while breaking below 1791 may continue the adjustment. Traders can adopt the strategy of 'testing long at support levels and testing short at pressure levels', while reserving positions to cope with sudden breakout situations, always prioritizing risk control.$ETH #ETH走势分析