1. Current Market Structure and Key Position Analysis
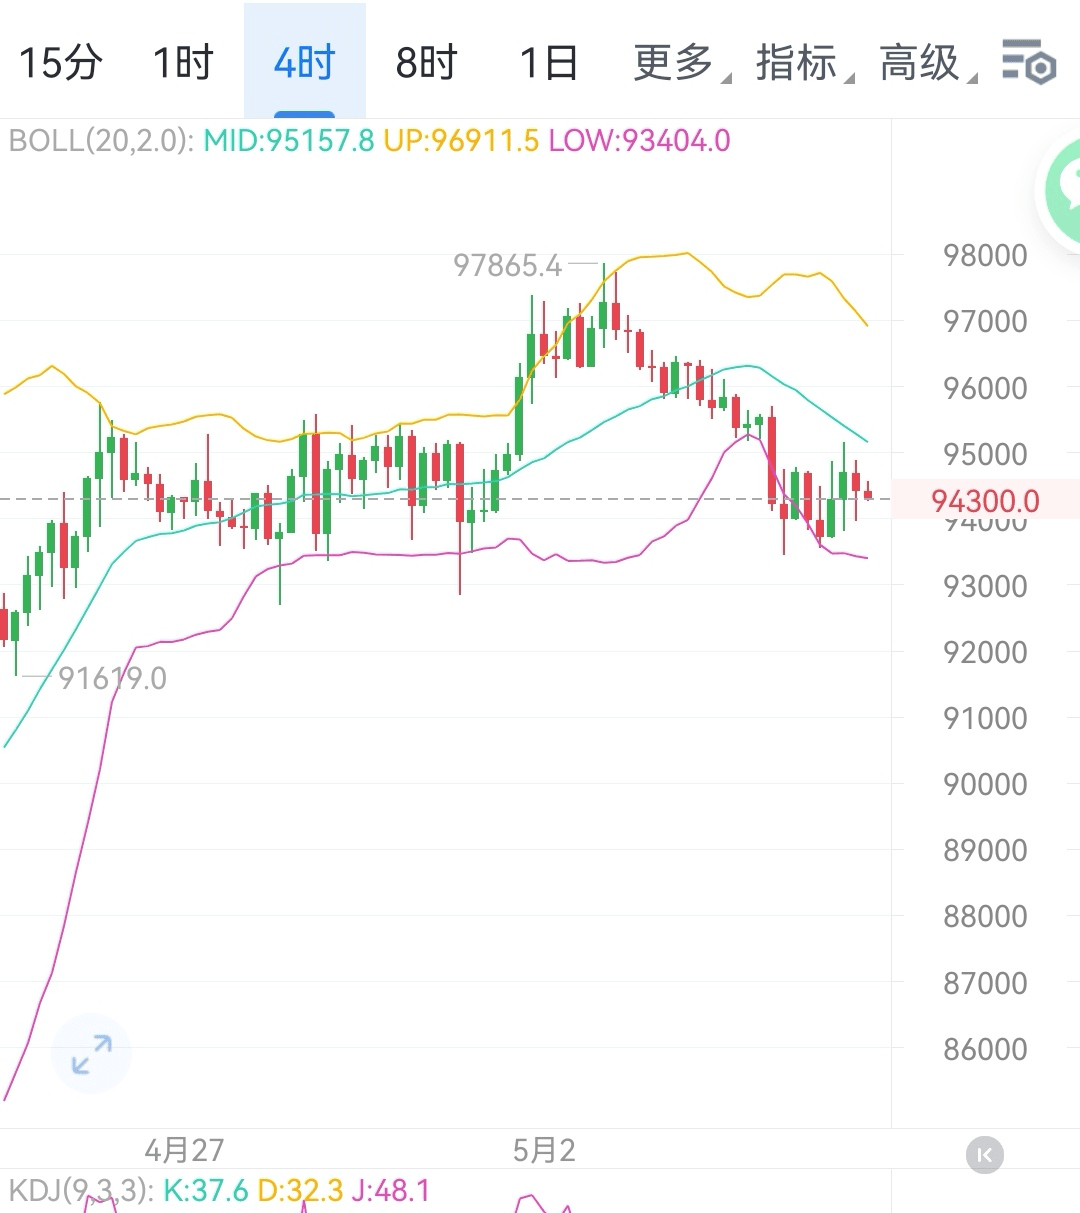
From a technical perspective, Bitcoin is currently in a small range consolidation state. Focus should be on the breakout direction of the upper and lower bounds of the consolidation area:
1. Top of the consolidation area (resistance level): 94800
- This position is a key watershed for recent rebounds. If the price can effectively stabilize above this level (combined with volume and hourly closing confirmation), it indicates that short-term bullish forces are dominant, and the market is likely to continue its rebound trend.
- Upper Pressure Levels: After breaking above 94800, pay attention in order to 95666 (short-term psychological level), 96450 (upper bound of previous consolidation), and 97300 (daily level trend line resistance). These three levels may trigger short-term selling pressure or technical retracements.
2. Bottom of the consolidation area (support level): 93445
- This position is the lower bound of the consolidation area and also the defensive line for short-term bulls. If the price falls back without breaking below 93445, it indicates market support in this area, and smaller time frames (like 15-minute and 1-hour) may initiate a rebound structure.
- Breakdown risks and lower support: If it effectively breaks below 93445 (e.g., two consecutive hourly closes below), it may open up downward space. Below, pay attention in order to 92720 (near previous lows), 91620 (Fibonacci 38.2% retracement level), and 90455 (daily level strong support zone). These three levels may become targets for bears or reference points for bulls to build positions gradually.
2. Operational strategies under different trends
1. Rebound meets resistance (not breaking above 94800)
- Signal Characteristics: Price rebounds to around 94800, then shows a spike and drop, with volume not significantly increasing, and the hourly chart closes with a long upper shadow.
- Strategy Recommendation:
- Short-term traders: You can reduce positions at highs or take light short positions, with stop-loss set above 94800 (e.g., 95000), targeting the lower end of the consolidation zone at 93445, and further down at 92720 after a breakdown.
- Risk Warning: Be wary of sudden positive news driving prices past resistance levels. Positions should not be too heavy, and stop-loss should be set properly.
2. Stabilize at resistance level (break above 94800)
- Signal Characteristics: Price breaks above 94800 with increased volume, and the hourly chart closes with consecutive bullish candles, with volume expanding over 30% compared to the previous day.
- Strategy Recommendation:
- Short-term traders: You can follow the breakout direction with light long positions, with stop-loss set below 94800 (e.g., 94500), with the first target at 95666. After a breakout, some positions can be held to speculate on 96450 or even 97300.
- Mid-term traders: If it breaks and retraces without dropping below 94800 (confirming effective support), consider building positions gradually, targeting daily level resistance (e.g., 100000 round number).
3. Support level speculation (not breaking below 93445)
- Signal Characteristics: A stop signal appears after the price falls back to around 93445 (e.g., small bullish candlestick, doji), with volume shrinking, indicating weakened selling pressure.
- Strategy Recommendation:
- Aggressive traders: You can take light long positions near 93445, with stop-loss set below 93000, targeting 94800, and hold for higher positions after a breakout.
- Conservative traders: Wait for the price to rebound and break above 94000 before following up to avoid getting caught in disordered fluctuations within the range.
4. Break below support level (break below 93445)
- Signal Characteristics: Price quickly breaks below 93445, accompanied by increased volume, with the hourly chart showing a bearish or sharp decline pattern.
- Strategy Recommendation:
- Short-term traders: You can go short following the trend, with stop-loss set above 93445 (e.g., 93700), targeting 92720, and further down to 91620 after a breakdown.
- Be cautious when bottom-fishing: Unless there is a clear stop signal (e.g., long lower shadow, bullish divergence), it is not advisable to blindly bottom-fish in a downtrend to avoid catching a 'falling knife'.
3. Risk Control and Market Sentiment
1. Position Management: Regardless of long or short, the position size for each trade should not exceed 10% of total capital to avoid significant losses due to failed range breakouts.
2. Stop-loss discipline: All operations must include stop-losses, especially when speculating at key levels. Stop-losses can be slightly wider (e.g., 200-300 points), but should never be neglected.
3. Beware of reversal windows: The longer the consolidation period, the greater the potential volatility after a breakout. Pay attention to sudden news during weekends or nighttime (e.g., policy changes, US stock market correlations, etc.).
4. Mindset Adjustment: If the market does not move as expected, promptly acknowledge the mistake and exit to avoid holding positions that lead to an unbalanced mindset.
4. Summary
In the short term, Bitcoin is in a directional choice phase, and the breakout direction of 94800 and 93445 will determine the short-term trend. Traders can formulate 'breakout following' or 'range high selling low buying' strategies around these two key levels, while closely monitoring market volume changes and external environments (e.g., US dollar index, US stock trends, cryptocurrency regulations, etc.) to flexibly adjust their trading plans.$BTC #BTC走势分析