This chart shows Bitcoin/TetherUS on a 10-minute Binance timeframe, dated May 1, 2025, with the price at 96,439.99, down 0.04%. It features a price chart with a descending triangle pattern, breaking out upward, indicating a bullish trend targeting 97,506.31. The volume bars below show trading activity, while the RSI (Relative Strength Index) at 47.55 suggests neutral momentum. The MACD (Moving Average Convergence Divergence) displays bearish momentum with the signal line above the MACD line. The Stochastic oscillator at 52.21 indicates a neutral position, not overbought or oversold.

This chart tracks Market Cap USDT Dominance on a 10-minute CryptoCap timeframe, dated May 1, 2025, showing a value of 5.03%, down 0.08%. The price chart forms an ascending triangle, breaking downward, suggesting a bearish trend targeting 4.96%. Volume bars indicate trading activity, while the RSI at 55.97 shows neutral momentum, slightly overbought. The MACD displays bullish momentum with the MACD line above the signal line. The Stochastic oscillator at 49.56 indicates a neutral position. A USDT.D dump often correlates with a BTC pump, supporting your hypothesis.

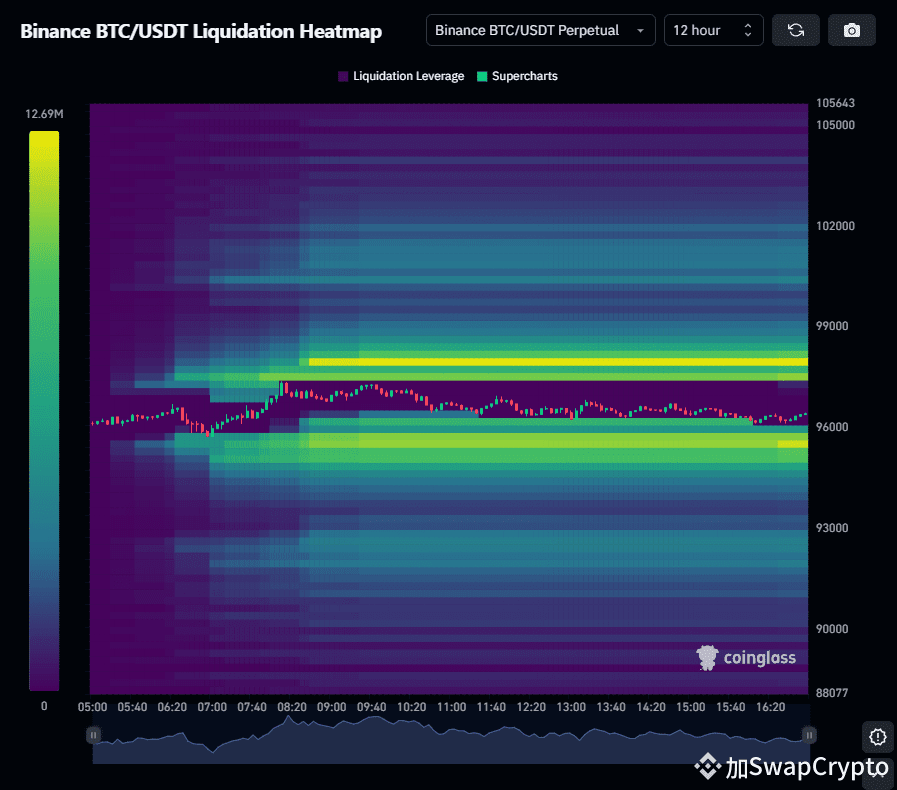
This Binance BTC/USDT 12-hour perpetual liquidation heatmap from Coinglass shows the price at 94,000 to 96,000. Green zones mark high liquidity, yellow at 94,500 to 95,500 shows liquidation leverage, hinting at stop-loss clusters. Price consolidates here, suggesting a breakout. Volume peaks at 12.69M near 94,000, indicating support. This setup aligns with your belief in a BTC pump due to liquidity grabs.
Entry: 96066.62
1st TP: 96891.83
2nd TP: 97301.05
3rd TP: 97578.86
For more details, check out my bio by clicking on my profile.
This signal is for spot trading only. If you're interested in future signals, join my live Binance session.
Simply click on my profile to join!
#swapcryptoz #BTC