🔍 Comprehensive monthly analysis for Bitcoin – April 2025
🔸 Monthly close at a critical moment 🔸
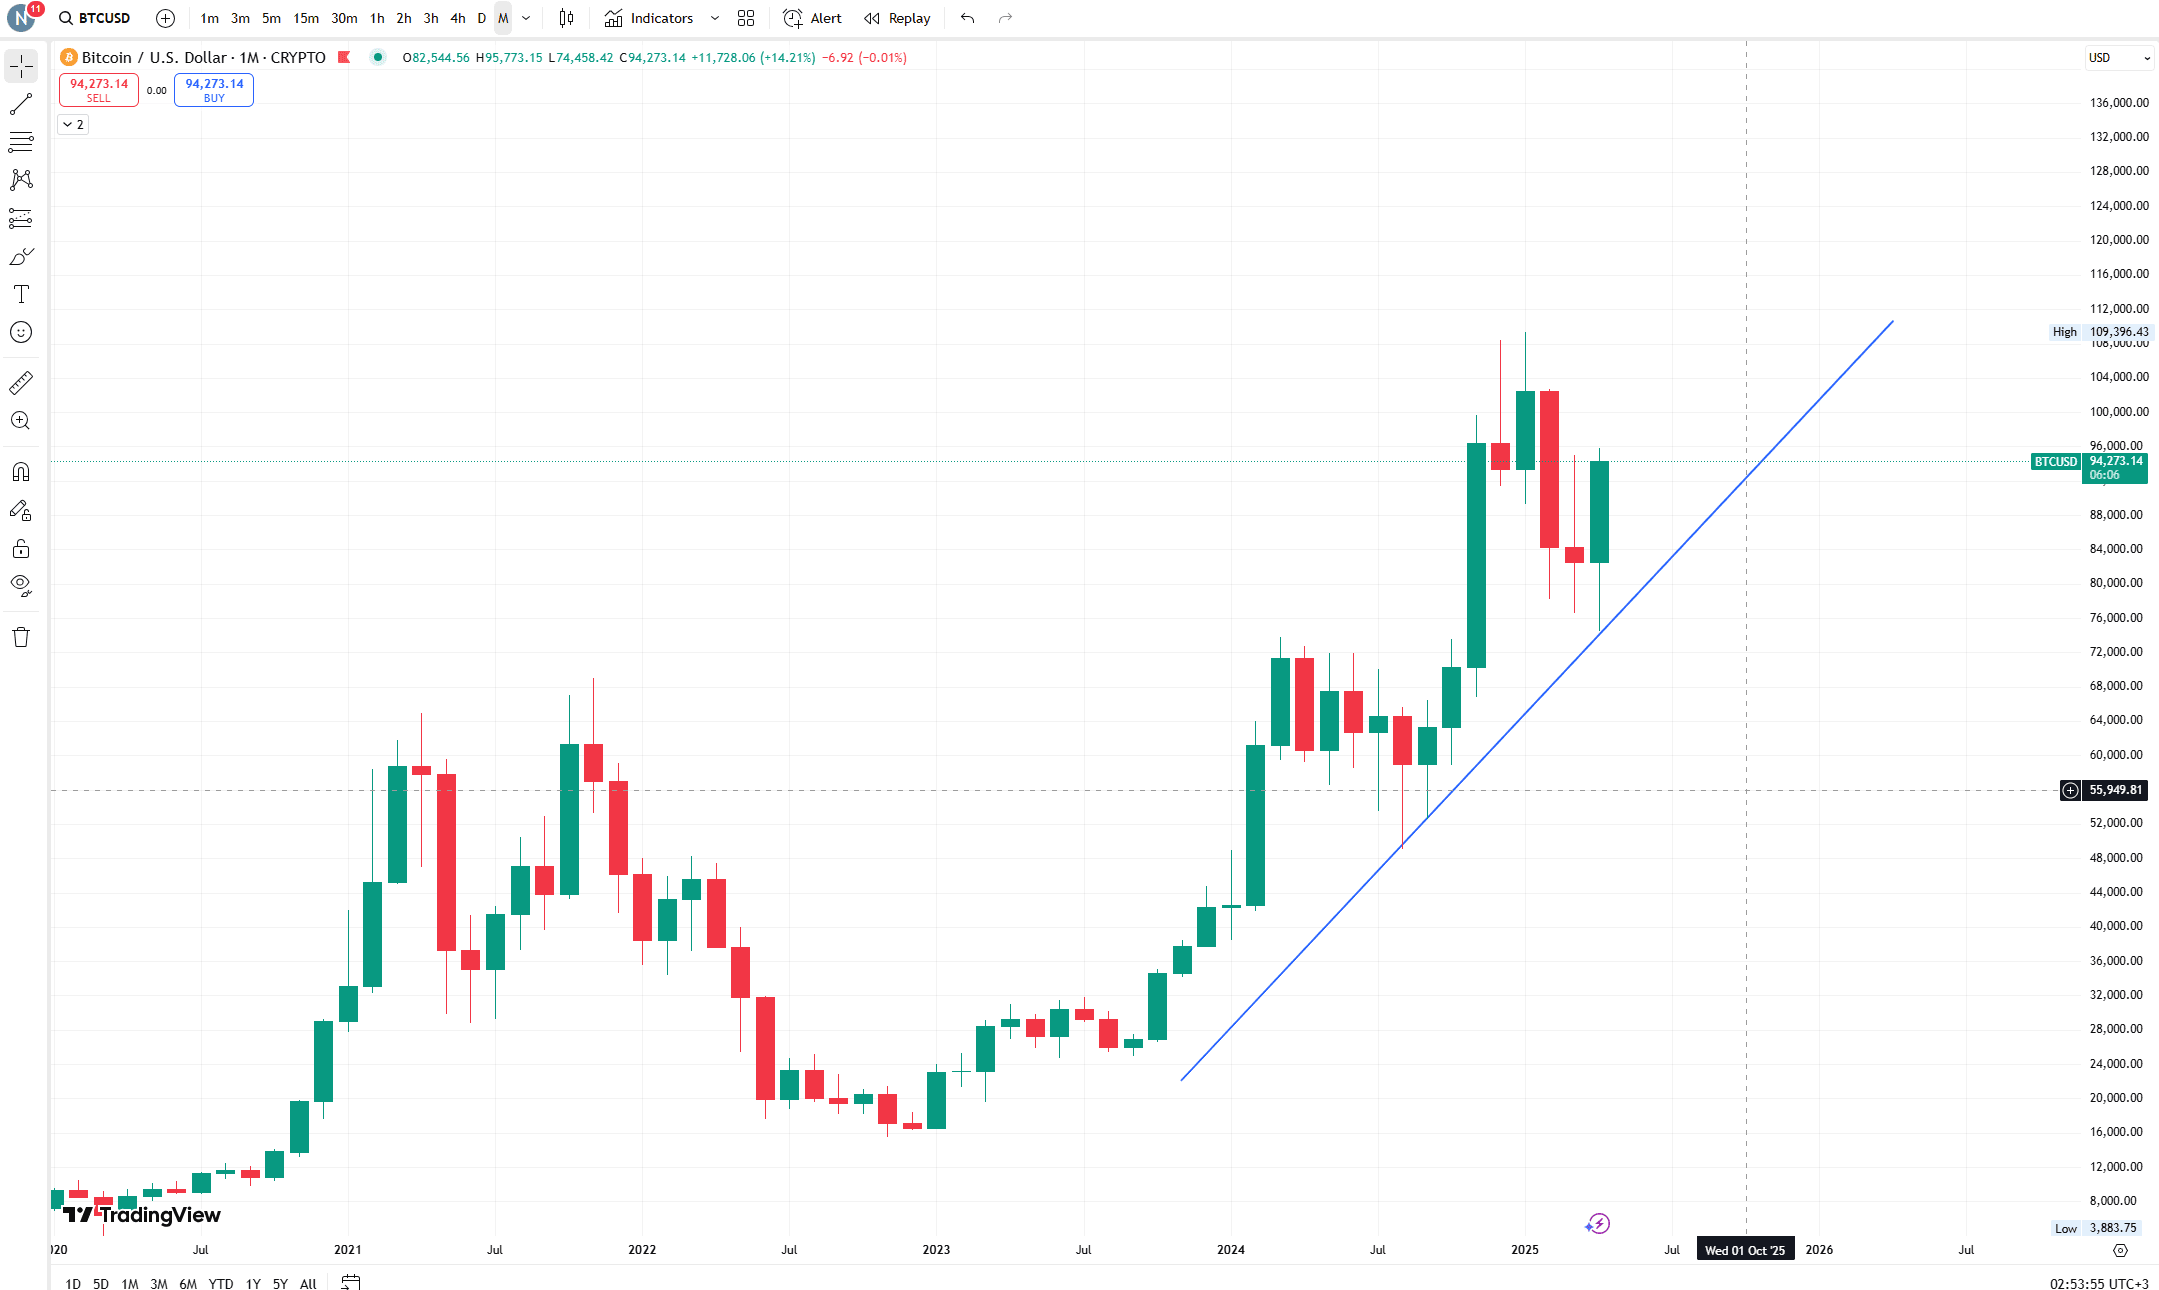
🔹 Closing price: $94,172
🔹 Bitcoin market cap: $1.87 trillion
🔹 Acquisition: 64.4% – Highest level in over two years
🕯️ Monthly timeframe (1M):
Strong bullish close after a clear bounce from levels $74,508.
The current monthly candle closes as a "breakout candle with support" above an uptrend since the beginning of 2023.
Maintaining the monthly uptrend increases the likelihood of reaching the $100,000 level during the next quarter.
📉 Weekly timeframe (1W):
Continuing to rise for the second consecutive week, with ongoing confirmation of the breakout of the uptrend after a strong test in early April.
Moving averages (EMA 7 and 25) in positive and continuous crossover.
📆 Daily timeframe (1D):
A kind of slowdown near the psychological resistance of $95,000.
The trend is still upward, but momentum has started to weaken slightly.
It is essential to monitor stability above $92,000.
📊 Technical indicators:
RSI Overbought - Monitor
Positive MACD - Supports the continuation of the uptrend
Stoch RSI at high peaks - may indicate a temporary correction
Parabolic SAR still below price in all frames
💡 Acquisition and market control:

🌐 Liquidity analysis:
Liquidity heat maps show concentration of liquidations between levels:
From above: $95,500 to $97,000 – Potential selling pressure area.
From below: $91,000 to $92,000 – Area filled with pending buy orders.
📌 This reflects the likelihood of "quick liquidations" if either direction is broken, so volume and price explosions should be monitored closely.

🧭 Technical outlook (potential plan):
🔹 Positive scenario:
Monthly stability above $94,000 supports reaching targets of $98,000 then $102,000.
Breaking $95,700 will ignite a rapid buying wave.
🔹 Negative scenario:
Breaking $91,500 could lead to a correction towards $88,000 without breaking the overall trend.
🏁 Summary:
📈 The monthly close is the strongest since January
💎 The overall trend is upward 🛑 with signs of overbought, risk management is recommended and pay attention to price movement at levels $95,700 and $91,500.
⚡ Risk management is the key to success! 🚀
📢 Note: The analysis is not considered financial advice, make your decisions wisely. 🚨
