Short-term pullback pressure and key support levels
Technical risks: The current Bitcoin price is around $95,000, but the 4-hour chart shows a bearish divergence, and it has not been able to hold above $95,000, which may trigger a pullback to the range of $90,500 to $88,750. This range is the 'fair value gap' (FVG) in on-chain data, and if it breaks below $91,000, it may trigger long liquidations, worsening short-term declines.
Funding rates and leverage risk: Recently, Bitcoin futures funding rates have turned positive, indicating that there are overly leveraged long positions in the market. If prices drop quickly, it may trigger a 'long squeeze', accelerating sell-offs.
Potential rebound momentum
Institutional demand and ETF support: The U.S. spot Bitcoin ETF continues to record inflows (such as $3.06 billion in April data), providing underlying support for the price. If it retraces to around $90,000, it may attract institutions to buy on dips, pushing the price up.
Effectiveness of technical support levels: The range of $96,000 to $97,600 was previously an important historical support area. If the price quickly rebounds above this range after a pullback, it may restart a bullish trend.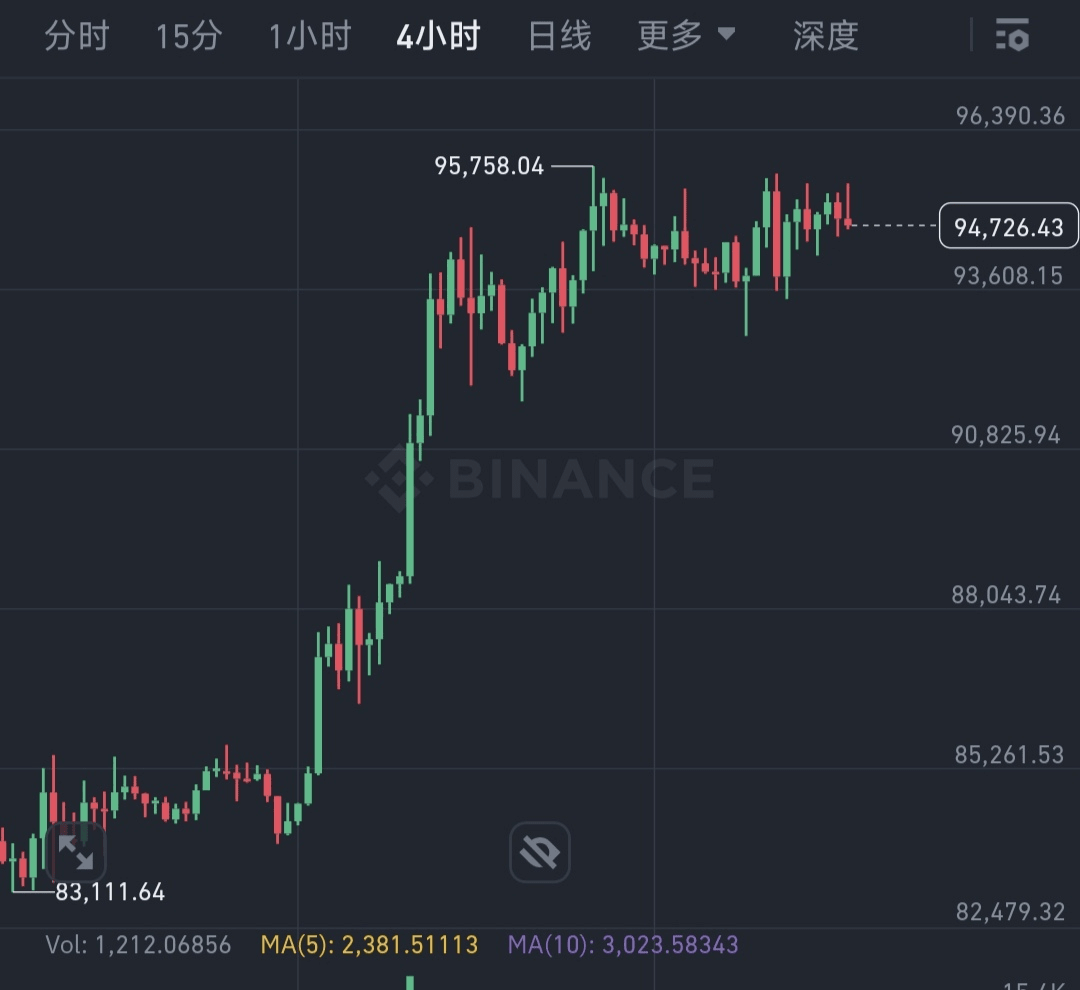
Macroeconomic and policy impacts
Federal Reserve policy expectations: The market's expectations for Fed rate cuts (currently about 50% probability) may impact the sentiment of risk assets. If the probability of a rate cut in May increases, it could boost Bitcoin prices; conversely, if the policy remains tight, short-term volatility may intensify.
Geopolitical factors: The U.S. tariff policy and regulatory dynamics (such as the crypto-friendly policies promoted by the Trump administration) may become short-term catalysts for market sentiment.
Comprehensive forecast
Short-term trend: Bitcoin may first test the support level of $90,500 in the next two days. If it does not effectively break below this level, it may form a rebound in this range, targeting a return to $94,000 to $95,000. However, if it breaks below $88,750, one should be cautious of further declines to $86,000.
Medium to long-term forecast: Institutions like Standard Chartered still maintain a target of $110,000 to $120,000 in the second quarter of 2025, and a pullback may accumulate momentum for a subsequent breakout.
Summary recommendations
Key signals to focus on:
Key support level: $90,500 (short-term dividing line between strength and weakness).
Changes in funding rates: If it turns negative, it may indicate a bearish dominance.
ETF fund flows: Continuous inflows will enhance market confidence.
In terms of short-term operations, it is recommended to control leverage, avoid excessive chasing of highs and selling of lows, and pay attention to the immediate dynamics of technical and policy aspects.