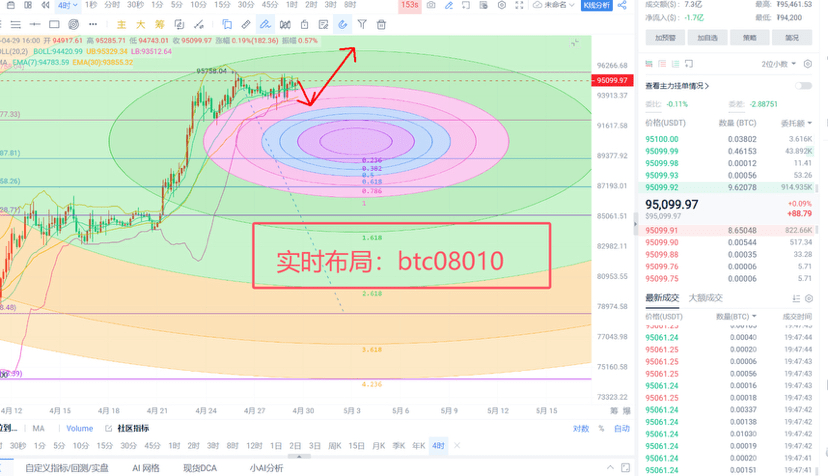
Bitcoin's current price fluctuates around 94000 to 95000. It briefly broke above 95000 in the morning but could not hold, then retreated to 94861. The 4-hour MACD energy chart continues to contract, indicating a weakening of bearish momentum, but the DIF line and DEA line have not formed a clear direction, resulting in a neutral short-term trend. Attention should be paid to whether there are death cross or golden cross signals; if DIF crosses below DEA, it may trigger a pullback, while the opposite could continue the upward trend. Currently, the KDJ index is at 71, close to the overbought area, indicating a risk of short-term pullback. The stochastic oscillator shows 95% overbought, further validating the possibility of adjustment. If a death cross forms, it may lead to a price drop to around 93000. The MA10 crossed above MA30 and then fell back, with short-term moving averages flattening out, indicating that the market is entering a consolidation phase. The medium to long-term moving averages (such as EMA120) are still trending upward, indicating that the overall bullish pattern remains unchanged. Recently, Bitcoin has tested the upper Bollinger Band near 95000 multiple times; if it cannot break through, it may pull back to the middle band around 93500 for support. The Bollinger Bands are widening, increasing market volatility, so be cautious of sharp volatility risks. Currently, MACD shows a weakening bearish trend, with the fast and slow lines approaching the 0 axis, possibly indicating a shift to bullish. RSI is around 60, slightly leaning towards the overbought area, but has not reached extreme values, indicating that there is still upward space in the market. Based on the comprehensive analysis, I suggest that everyone enter long positions on dips!
Bitcoin trading suggestion: Enter long positions near 93500—94300. Target: 97500—98600. Risk control: 92500.
Ethereum trading suggestion: Enter long positions near 1740—1790. Target: 1920—1950. Risk control: 1690.
I have been focusing on mainstream cryptocurrency market analysis for a long time, sharing daily points, mastering the Japanese candlestick chart patterns, providing free real-time operational guidance, and managing position risk reasonably. With seven years of experience through numerous market ups and downs, I have summarized various market pattern experiences. The market is constantly changing, and posts may have a delay. Strategies are for reference only, and everyone should stick to real-time strategies. If you are unclear about the direction of subsequent operations, you can follow my homepage for more detailed strategies.
The market has both good and bad elements, and you should make decisions based on the overall trend. The market has its own operating rules, and cryptocurrency enthusiasts often view the market with their own biases, which can lead to significant subjectivity. Therefore, it is essential to set aside personal gains and losses and analyze trends as objectively as possible, following the trend. If you can see the overall direction clearly, the likelihood of market mistakes decreases significantly.