1. Key Level Analysis
1. Bull-Bear Watershed:
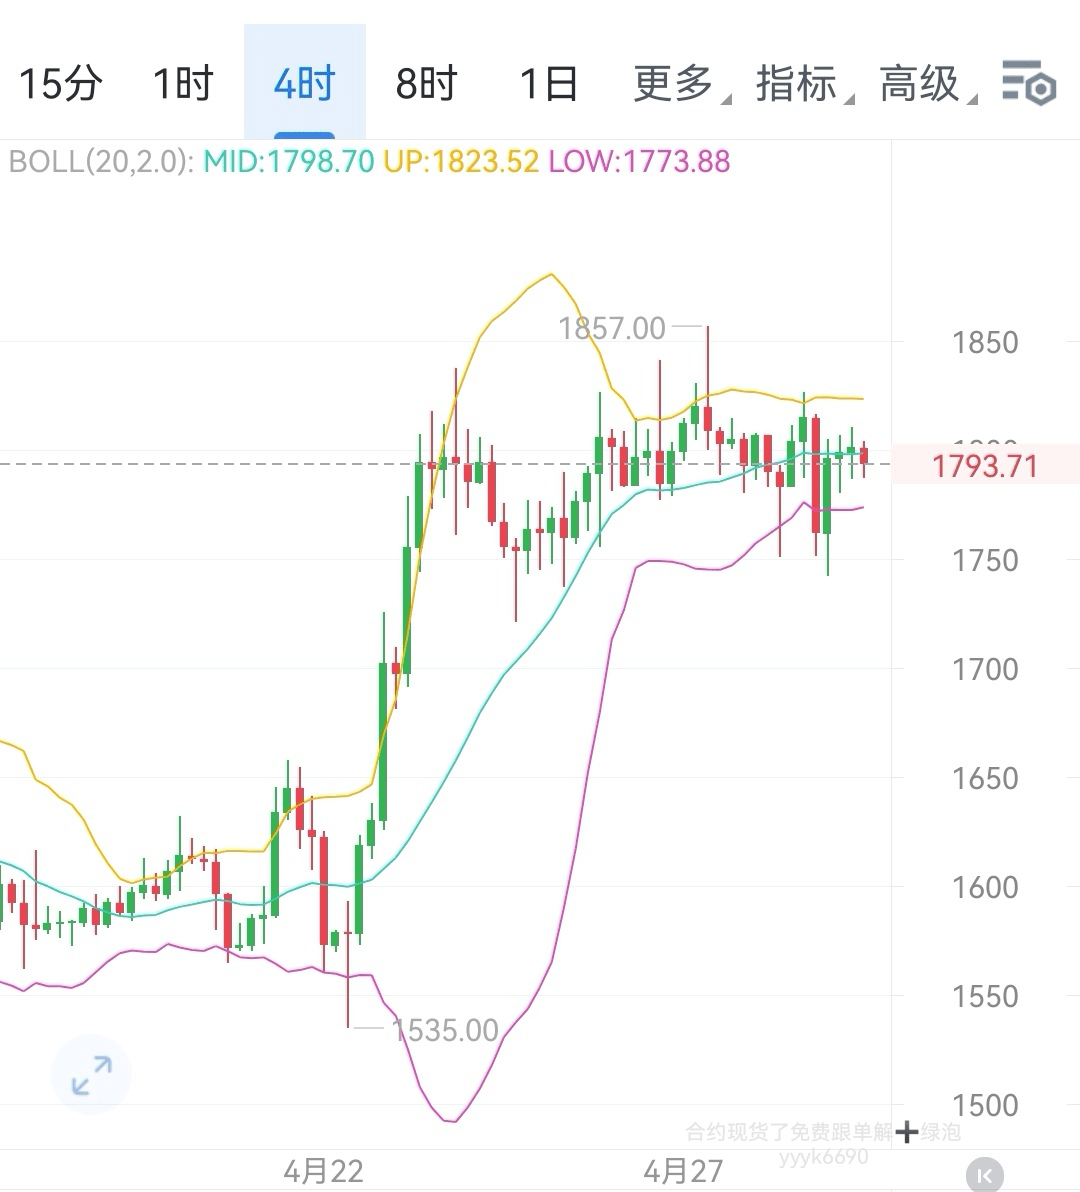
The 4-hour level needs to focus on the 1795 support level. If this level holds, a small level pullback is likely to continue the upward trend; if the 4-hour closing line breaks below, it confirms the start of a 4-hour level pullback.
2. Upside Resistance Level:
- Short-term Resistance: 1826 (recent upper boundary of oscillation, breaking through opens up space);
- Medium-term Resistance: 1856 (corresponding to the upper band of the daily Bollinger Bands, volume validation key);
- Long-term Resistance: 1881 (historical trading dense area, bull-bear psychological level).
3. Pullback Support Levels:
- First Support: 1781 (4-hour level 20-period moving average, initial buffer);
- Second Support: 1767 (lower boundary of the oscillation range, strong short-term support);
- Third Support: 1742 (61.8% Fibonacci retracement level, medium-term trend reference);
- Extreme Support: 1721 (daily upward trend line, breaking below requires caution for reversal).
2. Operational Strategy Suggestions
1. Bullish View (holding above 1795)
- Entry Signal: 4-hour closing line confirms holding above 1795, accompanied by moderate increase in trading volume.
- Target Levels: sequentially look at 1826 (take profit 1), 1856 (take profit 2), aggressive traders can hold positions for 1881.
- Stop Loss Setting: Break below 1790 (prevent false breakouts).
2. Bearish View (breaking below 1795)
- Entry Signal: 4-hour closing line entity breaks below 1795, rebound fails to recover this position.
- Target Levels: sequentially look at 1781 (short profit taking), 1767 (medium-term profit taking), with strong bearish potential looking at 1742-1721.
- Stop Loss Setting: Break above 1805 (regaining the watershed, signal to end the pullback).
3. Oscillation Observation Strategy
If the price fluctuates narrowly around 1795, it is recommended to wait for a clear direction, avoiding chasing price up or down at critical levels; wait for a breakthrough of resistance or a break of support to follow the trend.
3. Trend Summary
Today's Ethereum trend considers 1795 as the critical point for bullish and bearish. It shows a pattern of 'holding means upward attack, breaking down means downward exploration.' Attention should be paid to the 4-hour level candlestick patterns (such as bullish engulfing/bearish engulfing) and changes in trading volume, while also considering the correlation with Bitcoin (BTC) to judge market sentiment.
Operational Reminder: Short-term trading focuses on 4-hour cycle signals, strictly manage stop losses (recommended stop loss range 30-50), and control position within 50%; for medium to long term, consider gradually accumulating when the price dips, with a focus on the breakout direction in the 1767-1795 range.$ETH #以太坊走势