April 27, 2025
Writing a few rare market analyses
Recently, many people may still be waiting for a big drop before planning to enter the market, as many people did not expect the market to directly reach around 94000. There are also many who expect a big drop. Whether on Zhihu or Twitter, it is the same. There are not many people who see the bull. You can check the comment sections of those who firmly believe in the bull market; most of the comments are negative. Meanwhile, those who expect a big drop can still list numerous reasons to convince retail investors to short. The comment sections of the bearish bloggers on Twitter also have many supporters. At least before 100,000, there may still be a considerable number of people who are bearish. It doesn’t matter; I stick to my point of view.
First, let's take a look at the Cloud Chart Monthly
Many people think I ignore the monthly trends of the Cloud Chart. After reviewing the monthly chart of the Cloud Chart system, I found that there is a two-month delay in the monthly chart, especially when the upward rise occurs after the middle adjustment ends. This means that when you refer to the monthly chart to make a new round of bottom-fishing, you will have at least a two-month delay. A wave of market rise generally lasts only 2-3 months, so if you miss two months, you will basically be buying at the top of the bull market. Therefore, the current monthly chart is not very referential. After all, the market is in a bull market. If you want to refer to the monthly chart, you can look at whether the two lines of MACD on the monthly chart are pointing up or down.
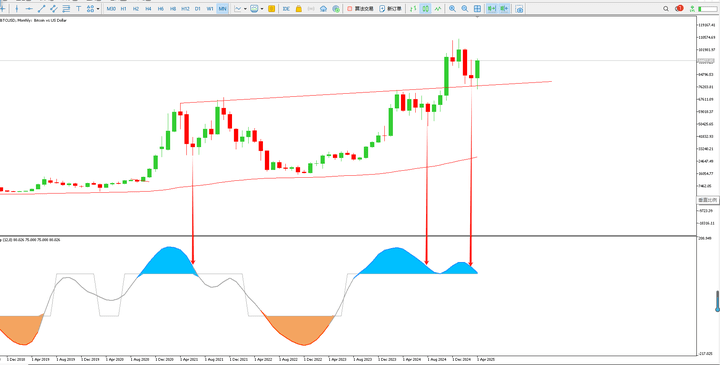
 Cloud Chart Weekly
Currently, the bottom of the weekly chart has already turned upward. This trend clearly indicates that the weekly level trend has emerged. Even with pullbacks in between, it will not have a significant impact on the trend.
Additionally, the MACD at the weekly level is about to reach the zero axis. In about two weeks, it will form a golden cross. The strength of the MACD weekly zero axis is very strong, which is a very important indicator. If you think there are other indicators that can compare with the king of indicators, you can wait and see.

The MACD 5-Day Golden Cross can look at the MACD of the 5-Day line. Every time it finishes underwater and then forms a golden cross near the zero axis, a bull market starts, and the current pattern is the same.
 Daily Level
Currently, the Cloud Chart system at the daily level is in a top pattern. In the short term, there may be a pullback, with the pullback position approximately at the upper track of the daily level, around 88000. However, it may also replace a decline with sideways movement, not giving many people a chance to enter. The two possibilities are shown in the images 1 and 2. If a large rise occurs, the possibility of following option 2 is greater, as this position will wash away some people to facilitate a better rise.
 Four Hour Level
Many people do not look at the four-hour level trends. In fact, every major market movement is due to the Vegas formation at the four-hour level. Currently, the four-hour level has formed a golden cross. Generally, the market near the golden cross will adjust, but once the golden cross opens up, a major upward trend will be welcomed. Those who do not play tunnels definitely do not understand and need to review the four-hour tunnel golden cross pattern to comprehend.
If this wave of market moves out, it will be the main upward wave of this bull market. Whether you can make money depends on this wave of rise. If you miss it, don’t think about recovering losses or making profits. It may not be possible to have such a cycle in four years. I hope those waiting for a black swan will enter the market when it arrives. Don’t enter if there are no new lows. Finally, this article is an original work; please do not copy and paste as your own.