XRPUSDT: A quick technical look and potential trading opportunities
Introduction:
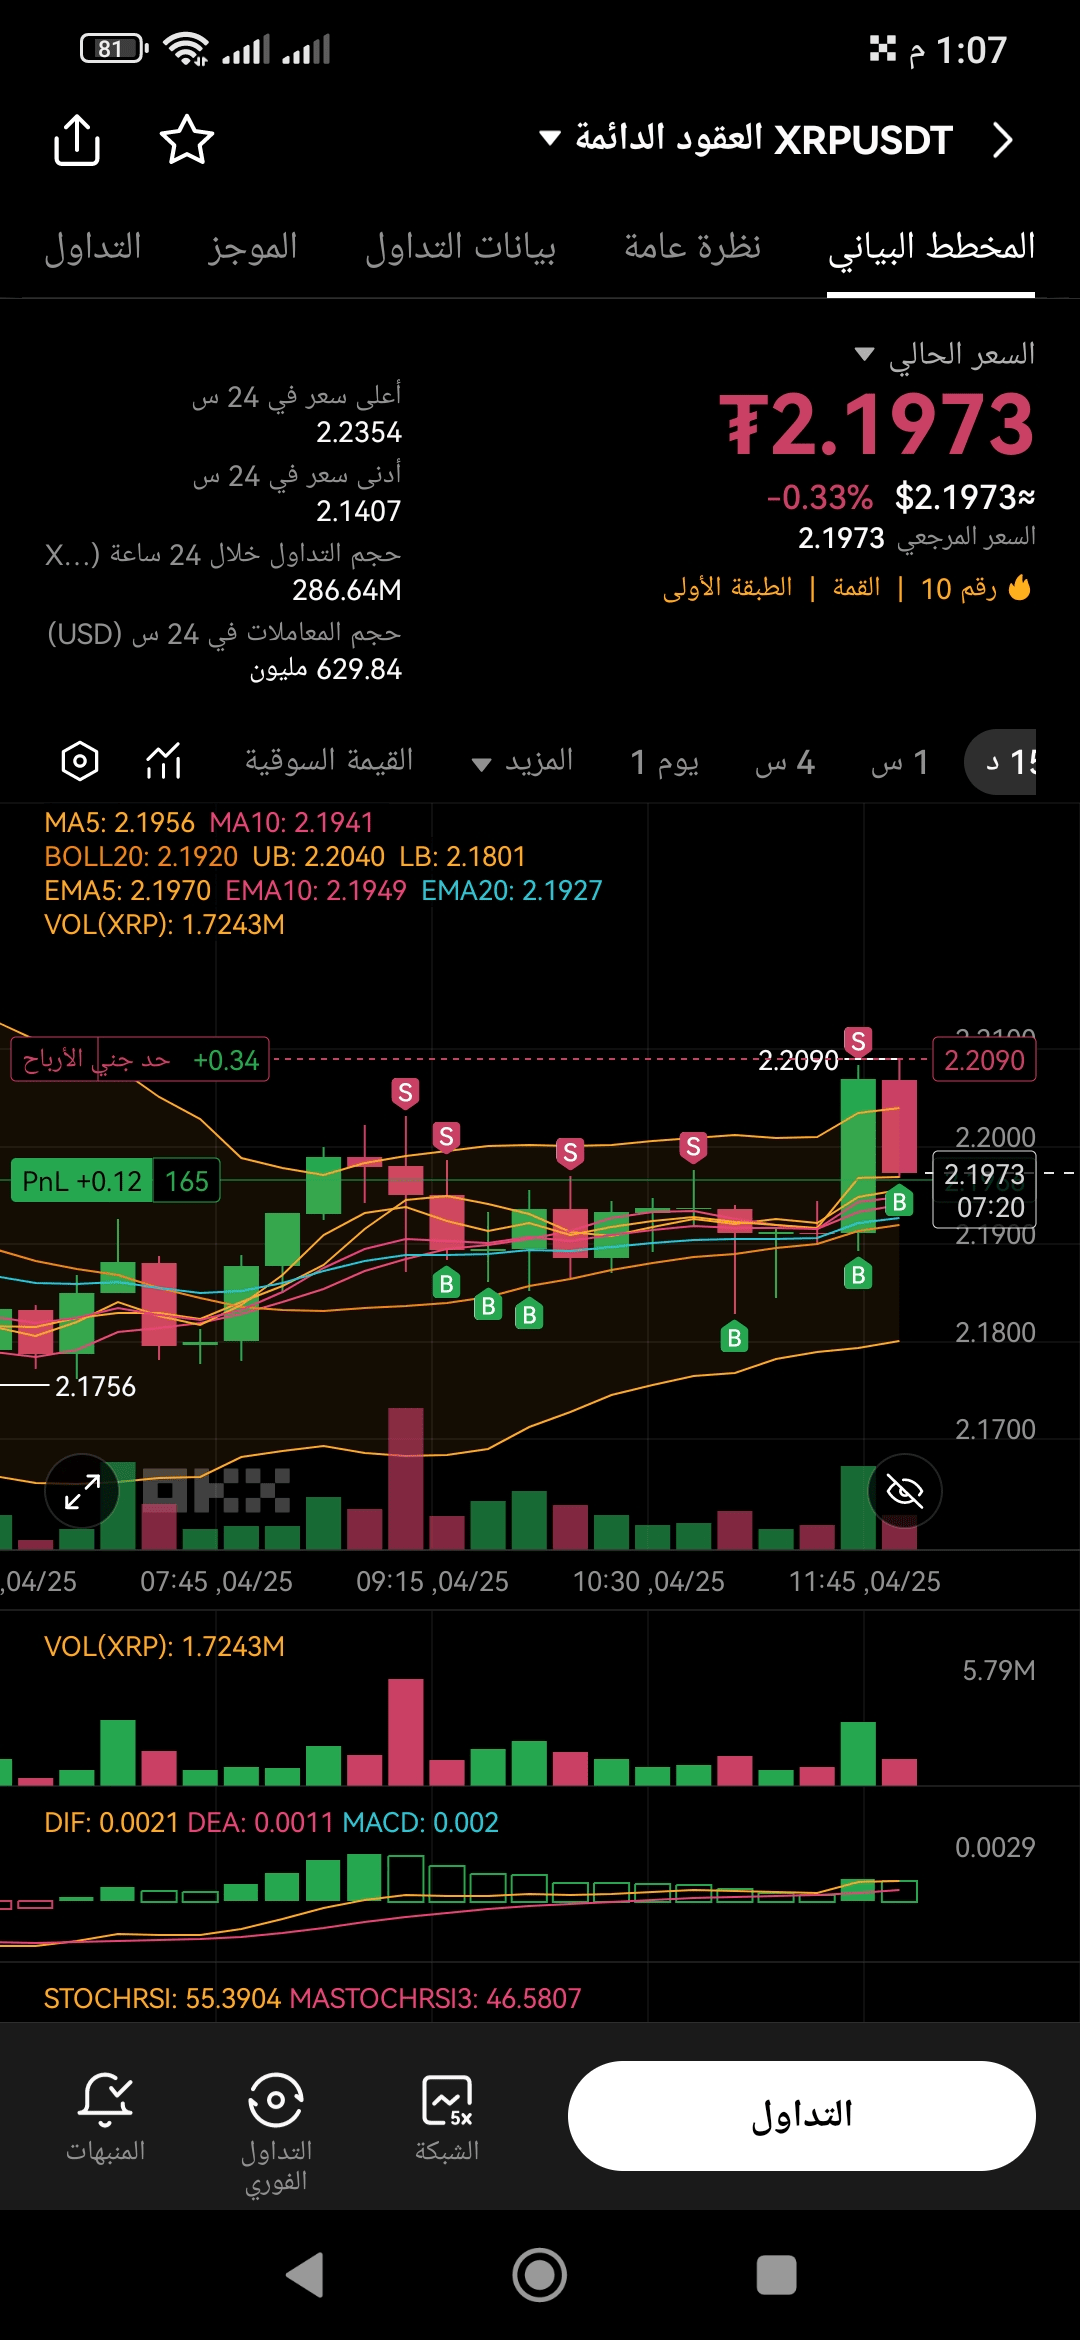
The XRPUSDT pair is experiencing volatile trading around the current price level of 2.1973$. Let’s take a quick technical look at the chart to understand potential trends and available trading opportunities.
Technical Analysis:
* Current Price: 2.1973$
* Change: -0.33%
* Highest Price in 24 Hours: 2.2354$
* Lowest Price in 24 Hours: 2.1407$
* Trading volume over the last 24 hours: 286.64 million XRP valued at 629.84 million USD.
* Moving Averages:
* MA5: 2.1956$
* MA10: 2.1941$
* EMA5: 2.1970$
* EMA10: 2.1949$
* EMA20: 2.1927$
* Short-term moving averages indicate price consolidation around the current level.
* Bollinger Bands:
* Upper Bound (UB): 2.2040$
* Lower Bound (LB): 2.1801$
* The price is currently trading near the upper limit of the Bollinger Bands, which may indicate potential resistance.
* Relative Strength Index (RSI): Currently at 55.3904, indicating relatively neutral momentum.
* MACD Indicator: Shows a slight convergence between the MACD line and the signal line, with values close to zero (MACD: 0.002, DEA: 0.0011, DIF: 0.0021), indicating weak current momentum.
* Stochastic Indicator (STOCHRSI): Indicates slight buying levels (K: 46.5807, D: 55.3904).
Potential trading opportunities:
* Bullish Scenario: If the price manages to break through the resistance level around the upper limit of the Bollinger Bands (2.2040$) supported by strong trading volume, we may see an upward movement targeting higher levels. Traders can look for short-term buying opportunities upon the breakout.
* Bearish Scenario: If the price fails to break through the resistance level and starts to decline, it may target the support level around the lower limit of the Bollinger Bands (2.1801$) or even lower levels. Traders can look for short-term selling opportunities if the support level breaks.
Warning:
Traders should exercise caution and manage risks effectively, as financial markets can be volatile and may experience sudden price movements. This analysis is for informational purposes only and should not be considered investment advice.
Conclusion:
The XRPUSDT pair is currently trading in a narrow range, and technical indicators suggest a state of anticipation. A breakout of any of the defined support or resistance levels can provide short-term trading opportunities. It is essential to monitor price movement and trading volume to make informed trading decisions.
#xrp #Xrp🔥🔥 #XRPHACKED #XRPPredictions