Ethereum has shown new growth momentum this week, with network activity and price trends reversing after a period of stagnation. As the world's second-largest cryptocurrency, Ethereum has finally broken through the key price barrier that limited its rise for over a week.
Active addresses increased by nearly 10%.
According to CryptoQuant analyst Carmelo Alemán's statistics, user activity on the Ethereum network significantly increased from April 20 to April 22.
During these three days, the number of active addresses increased from about 306,000 to over 336,000, a nearly 10% increase. Alemán stated that the network is 'heating up'.
The activity of such addresses typically signals changes in market sentiment and rising investor interest. Market analysts often regard such increases as early indicators of price trends, especially when accompanied by price increases.

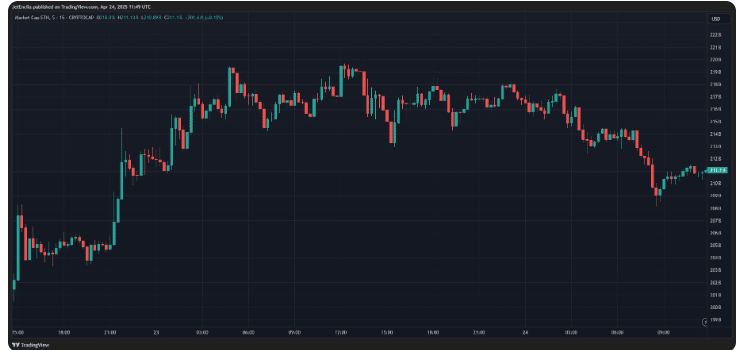
Prices have dropped to major resistance levels.
Ethereum's price has struggled to break through $1,640 since April, finally overcoming this resistance level. After breaking through $1,780, Ethereum's price surpassed a strong bullish daily candlestick resistance.
Historically, buyers have taken center stage in the market for the first time. The current price has surpassed the 10-day and 20-day moving averages, indicating that the market will remain strong in the short term.
The relative strength index is slightly above its 50 line, showing some bullish momentum, but is not yet close to the overbought zone.
Technical indicators are sending mixed signals.
Some indicators show strong momentum, although not all indicators are perfectly aligned. The Moving Average Convergence Divergence (MACD) indicator hinted at an ominous trend reversal early on with a slightly positive value.
Meanwhile, the stochastic RSI is approaching its upper range, which may indicate that unless more buyers return soon, prices will soften in the short term.

According to price forecasts, Ethereum is expected to drop by 6.50% and reach $1,652 by May 24, 2025. Technical analysis indicates a bearish trend, while the fear and greed index stands at 64, putting market sentiment in the 'greed' zone.
CoinCodex's data shows that Ethereum has been in an upward trend for 40% of the time over the past month (12 days out of 30), with a price volatility of 9.26%.

Despite price fluctuations, network utilization remains low.
One confusing aspect of Ethereum's current state is the disparity between price trends and actual network usage. According to YCharts data, transaction fees remain unusually low, averaging around $0.31. Low fees indicate that, despite the low cost of network usage, on-chain demand is still lacking.

Despite these contradictory signals, the increase in active addresses and ETH staying above previous resistance levels enhances the short-term outlook.
If the current momentum continues, market strategists will closely watch whether Ethereum can push towards the psychologically significant $2,000 price level.