
Daily K-line trend analysis: Bitcoin formed a doji star pattern yesterday, and has not yet shown a clear top retracement signal. The 4-hour MACD must wait for divergence before considering aggressive shorting; currently, the thought of breaking down remains. During the day, opportunities to go long can be sought around the EMA moving averages. Ethereum has encountered resistance and retreated near 1830 (historical support-resistance swap position); it is expected to retrace to around the 1670 neckline. A bullish bat pattern is forming; specific operations refer to candlestick teaching. Review of yesterday: The support level of 92400 mentioned in yesterday's video was successfully validated, and the price rebounded nearly 2000 points from this level.
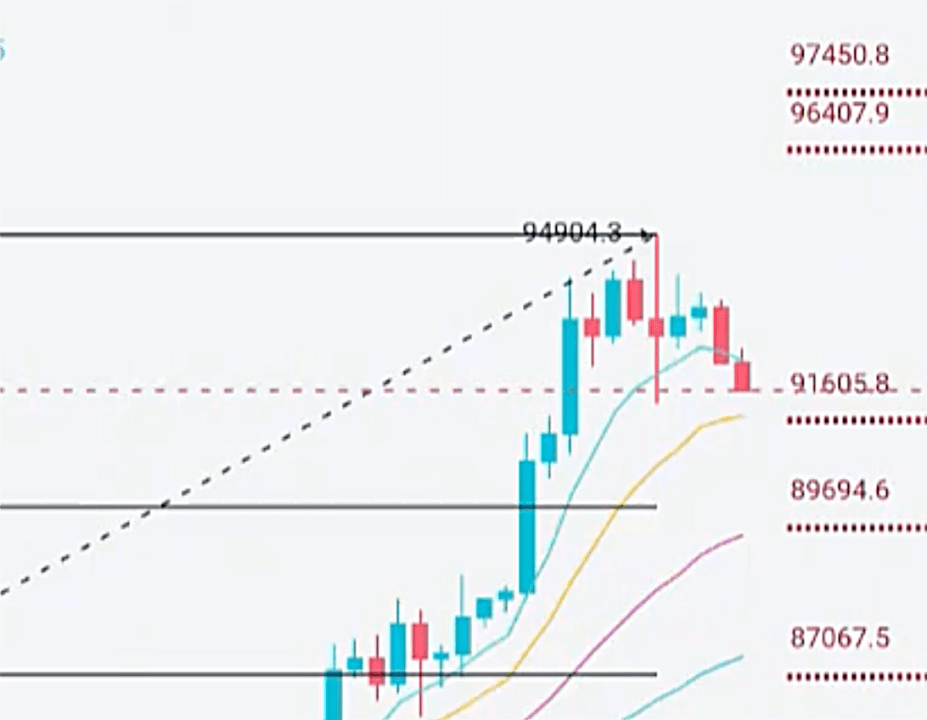
Resistance Level 1: 96400 (0.618 Fibonacci retracement level + bearish shark pattern + 1.13 false breakout position)
Resistance Level 2: 97400 (overlap position of bearish bat pattern + bearish crab pattern; shorting is not recommended unless the previous high is broken)
Support Level 1: 91600 (hourly EMA60 + 0.382 Fibonacci retracement + 1.13 false breakdown + Vegas channel line + bullish Gartley)
Support Level 2: 89700 (daily EMA7 + 0.5 position in upward trend + 4-hour EMA30 + strong support that has not been tested previously)
Support Level 3: 87100 (0.382 position from the high retracement + near 4-hour EMA60)
$BTC

For more detailed point analysis, please watch today's market analysis video, which includes a detailed explanation! Follow Aleng to study candlesticks, and we will meet at the peak together! Follow for daily updates and latest point interpretations!
