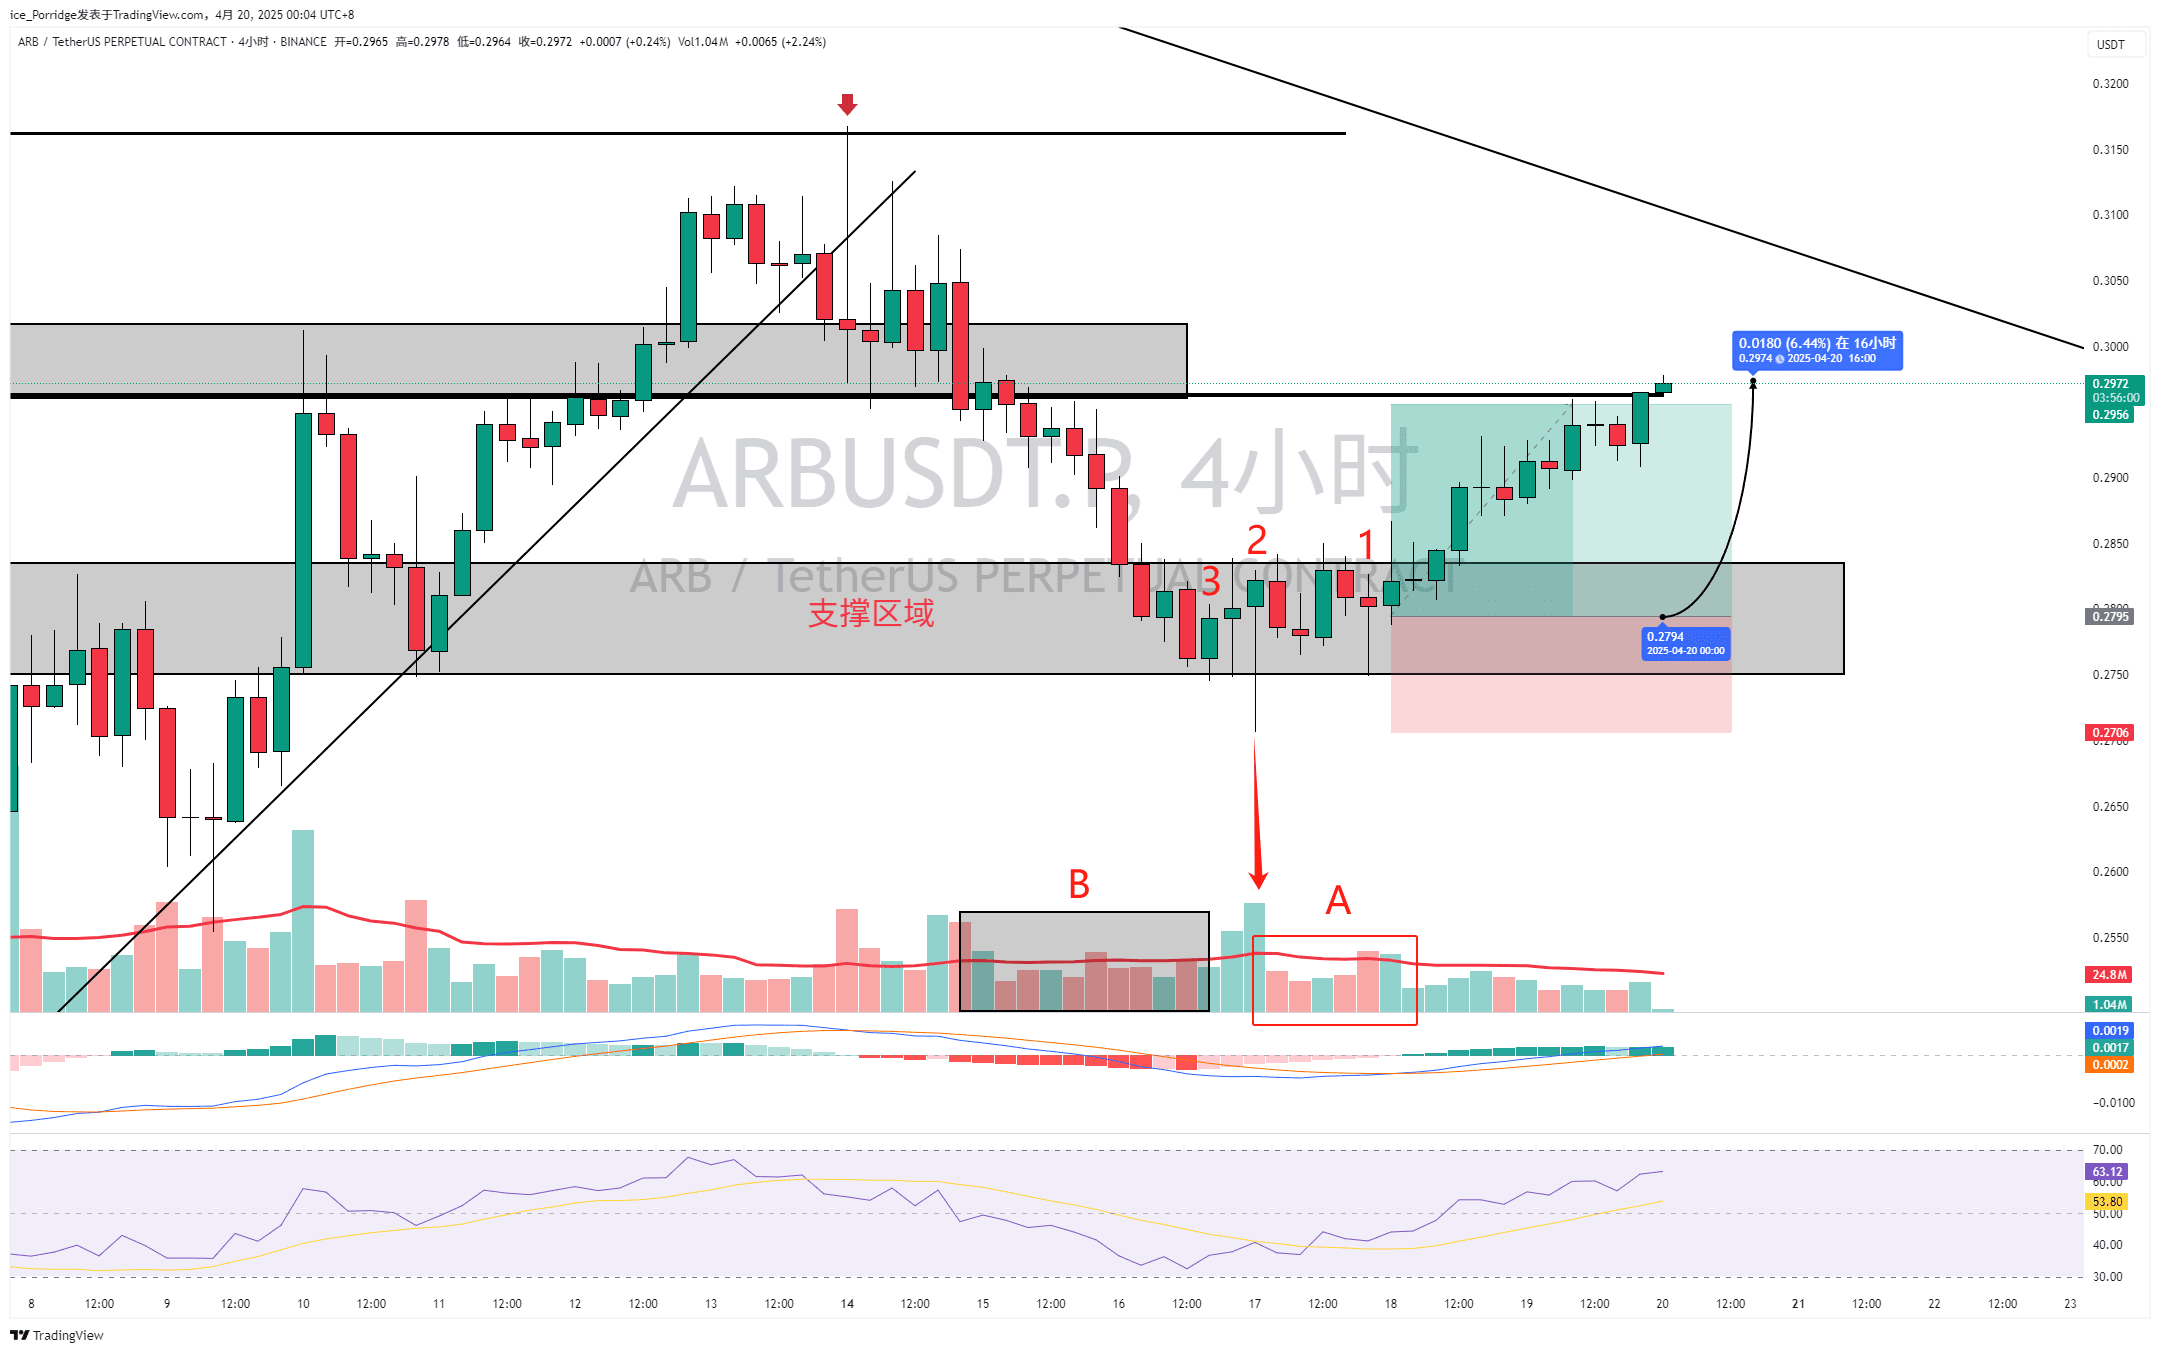
$ARB April 18 long position logic, first look at the chart:
Micro level
K1: The hammer candlestick accompanied by high volume indicates the effective test of support is bullish, so what is the objective fact? You tell me.
K2: The bullish Pinbar accompanied by noticeable volume in the market, with the support level showing a false break to seize liquidity, and the previous four candlesticks act as a buffer, so is the support level effective? And it looks bullish.
K3: A small bullish candlestick accompanied by low-level trading volume forms a piercing pattern with the previous bearish candlestick, indicating that floating supply is not strong.
Rectangle A: All have low-level trading volume, indicating that there is still no obvious supply in the market.
Rectangle B: Also has low-level trading volume, indicating that there is no expansion of supply during this decline, just an ordinary price pullback without the participation of major players in driving down the price.
Macro level
After an unlimited decline, the Pinbar and hammer candlestick effectively test the support level, forming a short-term consolidation and a bullish signal, with accumulation during the short-term consolidation after the decline. Actually, I could have entered a long position when I saw the bullish Pinbar, but I just didn't notice it earlier.
Mainly examined the identification of market floating supply, understanding and use of Pinbar, identification and use of hammer candlestick, and understanding of support levels. This trade is quite simple, with a single currency appreciating by 6.4%.