

Impact and Challenges of the Tariff War
In accordance with the International Emergency Economic Powers Act (IEEPA), the Trump administration has imposed a uniform 10% basic tariff on all imported goods, and even implemented "reciprocal tariffs" on countries that have trade surpluses with the United States, including China 34%, the European Union 20%, Vietnam 46%, Taiwan 32%, Japan 24%, etc.
In terms of results, I believe this will directly affect the input costs of production in the United States, including capital equipment, manufacturing production, and end-consumer products. In the current highly complex global supply chain system, every production link may be affected by tariffs. In order to maintain their original gross profit margins, companies usually pass on costs to end consumers, causing product prices to rise significantly.
China then took a tough stance and imposed retaliatory tariffs of 34% on US imports. In response to this move, Trump chose to impose a further 50% tariff, bringing the total US tariff rate on Chinese goods to 104%.
However, China is a major supplier of parts for smartphones and computer chips, and the impact of tariffs will directly lead to a significant increase in the prices of end products in the United States. Imposing tariffs will not essentially solve any problems. Such radical actions will only escalate conflicts between the United States and other countries and ultimately cause more harm than good to American consumers and businesses.
Trump's Purpose and Feasibility of Imposing Tariffs on Other Countries
Trump chose to impose large tariffs on other countries, ostensibly to promote the return of manufacturing, but in reality it was more like using it as a bargaining chip to force trade rivals to the negotiating table and strive for more favorable tax rates and trade conditions. For these countries, promising to set up factories in the United States and increase investment in the United States has become an important bargaining chip in their negotiations.
The author believes that Trump’s real intention is not to completely change the supply chain in the short term, but to induce companies to gradually transfer production and funds from overseas back to the United States through high tariffs and political pressure, so as to achieve the strategic goal of "re-industrialization" and strengthen the dominance of the US dollar system. The reshoring of manufacturing will not only help create local jobs, but also help reduce dependence on globalized supply chains. However, structural problems in reality make this goal difficult to achieve. Although some companies may choose to relocate, challenges such as supply chain restructuring, infrastructure construction, and workforce training will take a long time to overcome.
Referring to past reports from BCG, McKinsey and other institutions, an in-depth analysis of a medium-to-large-scale manufacturing plant such as electronics, automotive components, semiconductor packaging, etc. from site selection, design, approval to actual completion and commissioning, a medium-sized assembly line or processing plant takes about 18 to 30 months; large capital-intensive factories such as semiconductor and battery manufacturing plants require a huge time cost of more than 36 to 60 months.
The most time-consuming part is often not the financial cost of construction itself and supply chain reconstruction, but also the land use approval, environmental assessment, infrastructure connection such as electricity, water, and natural gas, and negotiation of incentive measures with local governments. On the other hand, there is also the consideration of training time and potential skills gaps for local new employees.
The formation of the global supply chain is not accidental. Rather, the global supply chain that has been optimized over decades cannot be reconfigured overnight. It was developed to maximize efficiency. For example, factories in China and Vietnam have highly optimized delivery times and production models, minimizing process costs from raw material procurement to final delivery.
In contrast, switching to sourcing from domestic U.S. manufacturers can be highly inefficient and problematic. The sudden imposition of widespread tariffs would cause supply chain bottlenecks, production delays and inefficiencies, thereby limiting actual output. The uncertainty in policy and cost outlook alone is enough to cause companies to delay and wait and see in their capital expenditure and operational decisions.
At least during Trump's term, the chances of seeing a large-scale return of manufacturing to the United States are extremely low. This is not a plan that can be completed overnight, but what is more important right now is that the plan seems to be gradually pushing the US economy to the brink of recession.
The iterative effects of the trade tariff war
When inflation is driven by high import tariffs that push up commodity prices rather than being guided by the Fed's monetary policy, the Fed's interest rate cuts are not an effective remedy to solve the problem of rising inflation. Let's take a look at the recent changes in the overall US economic data and the indicators' guidance.
March ISM Manufacturing Prices Paid
Since the start of Trump's second term, market expectations for a new round of tariff policies have been quickly reflected in manufacturing input prices. The manufacturing price payment index rose to 62.4 in February 2025, a sharp increase of 7.5 points from the previous month, setting a new high since June 2022, while the index further climbed to 69.4 in March.
This wave of price increases was mainly due to cost pressures driven by tariff policies. The price surge further led to a backlog of new orders, disruptions in supplier delivery schedules and difficulties in inventory management. At the same time, manufacturing production and demand also increased simultaneously, and some companies chose to place orders in advance before the tariffs officially took effect to avoid the risk of rising costs.

Figure 1: ISM manufacturing prices paid in March (Source: Institute for Supply Management)
ISM Manufacturing Purchasing Managers' Index (PMI) in March The ISM Manufacturing PMI fell back into contraction territory to 49.0% from 50.3% in the previous month. Although data from January to February once showed a rebound in manufacturing activity, after Trump's second term began, the market had strong expectations for a new round of tariff policies, causing many buyers to choose to place orders and deliver goods in advance to boost short-term production activities in order to avoid potential cost increases.
This momentum of advance stocking has the nature of overdrawing future demand. At the same time, combined with the previous data, it can be found that the manufacturing input price index has been rising for the sixth consecutive month. The continued surge in raw material prices has put manufacturers under double pressure. On the one hand, production costs are rising, and on the other hand, downstream demand is weakening, making it difficult to pass on costs smoothly and causing the overall industry to fall into compression.

Figure 2: March ISM Manufacturing Purchasing Managers Index (Source: Institute for Supply Management)
The market has successively lowered its forecast for US GDP growth in 2025, reflecting the uneasiness and conservatism about the future economic outlook. According to the latest report from Kpler and Discovery Alert, the US GDP growth forecast for 2025 has been significantly revised down from the original 2.0% to just 0.8%, highlighting the market's widespread concerns that high tariff policies may bring the risk of economic slowdown.
Not only are market institutions pessimistic, but warning signals are also being sent from within the Federal Reserve. As John Williams, president of the Federal Reserve Bank of New York, pointed out in a recent public speech, if trade policy uncertainty continues to rise, U.S. real GDP growth may slow to below 1% in 2025, putting downward pressure on the overall economy.

Figure 3: Forecast of US annual real GDP growth rate (Source: Kpler, various statistical agencies)
March CPI & Core CPI The U.S. CPI year-on-year growth rate in March fell for the second consecutive month to 2.4%, lower than the previous value of 2.8% and the market expectation of 2.6%, setting a new low since May 2020. The core CPI increased 2.8% year-on-year during the same period, which was lower than the previous value of 3.14% and the expected 3.0%, and was the lowest level since March 2021.
Overall, the March inflation data showed that price pressures have moderated significantly and appear to be under control in the short term. However, it should be noted that the CPI statistical period has not yet fully covered the impact of the Trump administration's new round of tariff measures. For example, the United States has only just begun to implement policies such as an additional 25% tariff on steel and aluminum and an additional 20% tariff on a number of Chinese imports, and the effects have not yet been reflected in this period's inflation data.
The current decline in CPI may reflect that companies are temporarily absorbing import costs to keep goods competitive, or that consumers are less willing to spend, resulting in no immediate increase in price pressures. In the coming months, as companies gradually pass on costs to consumers, these tariffs may have an upward effect on end prices, and CPI may face the risk of rising again.

Figure 4: US March CPI vs Core CPI (Source: Bloomberg)
The main factors driving the decline in this period's CPI and core CPI include: A significant drop in energy prices: Energy prices have continued to fall since the beginning of the year, with the energy index falling 2.4% month-on-month in March and gasoline prices falling 6.3% month-on-month, significantly pulling down overall prices. In terms of year-on-year growth, the energy index decreased by 3.3%, gasoline decreased by 9.8%, and fuel oil decreased by 7.6%, providing substantial support for the cooling of CPI and becoming one of the main drivers of the slowdown in inflation.
Prices of transportation and leisure services fell: Air ticket prices fell 5.3%, and entertainment-related spending also eased, reflecting the slowdown in service consumption and cooling demand. Residential service inflation slowed down: The annual growth rate of residential service prices, which accounts for the largest proportion of core inflation, further declined from the previous 4.4% to 4.0%. Among them, rents and homeowners' equivalent rents increased by 4.0% and 4.4% respectively, indicating that housing-related pressures are gradually easing.

Figure 5: US consumer price breakdown (Source: MacroMicro)
Adjustment of interest rate cut expectations After Trump announced a 90-day suspension of tariffs on 75 countries and a significant reduction in reciprocal tariffs to 10%, the stock market and cryptocurrencies saw a strong rebound and expectations of interest rate cuts dropped significantly.
Originally, after Trump announced the reciprocal tariffs, the market expected the probability of a rate cut in May to be 60%; the probability of a rate cut in June was 100%. Currently, the probability for May has dropped to 20%, and the probability for June has dropped to 60%. Combined with the FedWatch Tool, there is a high probability that the rate cuts will resume in June. The overall market still expects three rate cuts before the end of this year.

Figure 6: Forecast of interest rate cut path (Source: Bloomberg)

Figure 7: FedWatch Tool (Source: CME Group)
Global funds are accelerating their withdrawal from US dollar assets
As the Trump administration continues to impose tariffs on goods from many countries, global trade tensions continue to escalate, and market concerns about the economic outlook have also intensified. The United States has recently expanded its "reciprocal tariff" policy, not only targeting China, but also major trading partners such as the European Union, Mexico, Canada, Japan, Taiwan and Vietnam, imposing high tariffs on their export goods, and the trade conflict has escalated across the board. In retaliation, China sharply raised tariffs on some U.S. imports to 125% in retaliation for the U.S.'s earlier increase in Chinese tariffs to 145%.
The move further fueled concerns about global supply chain disruptions and price fluctuations, and reinforced the market's pessimistic expectations about inflationary pressures and slowing cross-border demand. The tariff conflict not only impacts real trade activities, but also has a profound impact on the financial market and policy environment, making the risk profile of "stagflation in the United States and deflation in other countries" increasingly obvious.
Recently, global funds have accelerated their withdrawal from US dollar assets. The yield on 30-year US Treasury bonds soared 15.6% in just three trading days this week, quickly making up for the decline in the past two months of volatile downward movement. Generally speaking, when risk aversion in the market rises, investors tend to rush to buy U.S. Treasuries, pushing up prices and depressing yields. However, since the Trump administration launched a global tariff war, a series of chain reactions have triggered market concerns about inflation and economic recession, leading to a sell-off of long-term U.S. Treasury bonds, a rapid rise in yields and a fall in prices.

Figure 8: US 30-year yield (Source: TradingView)
The market remains highly uncertain about the direction of Trump's tariff policy, and his erratic remarks make it difficult for countries to make effective predictions. While unconfirmed market rumors point to China dumping U.S. Treasuries in retaliation for high U.S. tariffs, causing U.S. Treasury yields to surge further, the reality may be more complicated.
In addition to geopolitical tensions, the U.S. debt ceiling issue, global supply chain disruptions, and unease about the Trump administration's economic policies are all key driving forces. Against the backdrop of the trade war, prices of goods exported to the United States have risen, while output and demand in other regions have been suppressed simultaneously.
With other conditions remaining unchanged, this will put the United States at risk of stagflation in the future, while other parts of the world may fall into imported deflation, putting pressure on global growth. In addition, the US dollar was also under pressure. The dollar index fell more than 2% this week and fell below 99.2 on Friday, a three-year low. Safe-haven funds have clearly shifted to non-US currencies, with the US dollar falling to a 14-year low against the Swiss franc and also depreciating against the euro and the yen.
This wave of dollar weakness not only reflects doubts about the fundamentals of the U.S. economy, but is also related to the market's loss of confidence in Trump's erratic trade and fiscal policies, which once led to a triple kill of stocks, bonds and currencies in the U.S. market.

Figure 9: US Dollar Index (Source: TradingView)

Figure 10: US asset sell-off – stock market, bond market and US dollar fall simultaneously (Source: Bloomberg)
The combination of these factors has exacerbated the market's pessimistic expectations for the US economic outlook, prompting funds to accelerate the withdrawal of US dollar assets and turn to safe-haven assets such as gold. Gold prices have risen by about 20% since the beginning of the year and broke through the $3,200 per ounce mark for the first time in early Asian trading on April 11, setting a new record high and a weekly increase of more than 5%.
It broke through $3,200 an ounce in Asian trading on April 11, a record high and a weekly gain of more than 5%. This not only reflects the market's strong demand for inflation-hedging tools, but also shows that investors' doubts about the credit of the US dollar and the future performance of US assets are rapidly increasing.
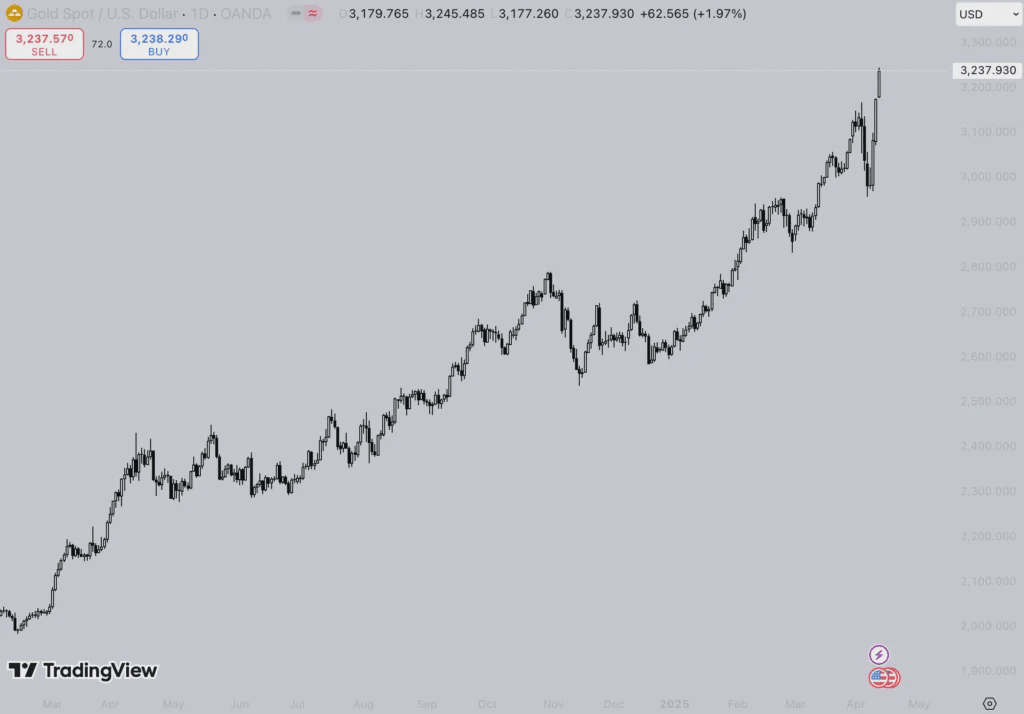
Figure 11: Gold/USD (Source: TradingView)
Observing the flow of funds, global capital is systematically moving away from the US-dominated asset system, symbolizing that a capital withdrawal operation in response to the disordered US economic policies and geopolitical expansion has quietly begun. In the current time and space context, this wave of capital reallocation has long gone beyond the simple risk-averse demand, and also reflects the market's systematic confrontation and alternative reverse containment strategy in the face of the unilateralism of US tariff policy.
Countries are also gradually reducing their dependence on US dollar assets through currency allocation, capital market restructuring and policy coordination, trying to establish their own safe-haven asset boundaries.
Summarize
Although the Trump administration is currently trying to use the tariff war as a means to leverage the United States' advantages in global consumption power and market size to force other countries to relocate their production lines, combat external competition, and dilute the global supply chain, thereby reshaping the manufacturing structure and consolidating the dollar and the United States' global hegemony, this move is actually causing a deep shake in the foundation of the global capital market's trust in the United States.
Under the banner of "America First", Trump tried to turn tariffs and consumption into leverage to exert pressure on foreign economies. However, this unilateral and coercive policy approach has instead aroused dissatisfaction and vigilance in many countries, triggering a silent but dramatic wave of de-dollarization and capital reallocation away from the United States. Global investors and governments no longer simply accept the rules and market narratives shaped by the United States. Funds are beginning to seek new allocation boundaries, trying to reduce dependence on the US dollar system while de-risking.
In short, this capital outflow is not only a natural response to geopolitical risks, but also a collective questioning of the American model. When Trump tried to dominate the global economic order with a hegemonic attitude, he actually catalyzed a systemic challenge to the nature of the dollar hegemony.
Ultimately, although the United States intends to use tariffs to strengthen its economic dominance, it is actually moving step by step towards credit fracture and global isolation from within.
This report is for information sharing purposes only and its content does not constitute any form of investment advice or decision-making basis. The data, analysis and opinions cited in this article are based on the author’s research and public sources and may be uncertain or change at any time. Readers should make prudent investment decisions based on their own circumstances and risk tolerance. If further guidance is required, it is recommended to seek professional advice.