
$OM A rapid decline of nearly 90% in a short time, the main reason is widely debated. Can we discover warning signs through data before the crash? Indeed, some anomalies were found on the blave.org data dashboard before the crash...👇🏻
Currently @MANTRA token data...
- Chip Concentration: The state of short chip concentration indicates that more short chips are held by large players.
- Whale Alert: During the decline, the market OI continued to increase, and whales opened short positions.
- Squeeze Momentum: Original small short momentum has strengthened.
- Long and Short Strength: A large amount of short strength (potentially combined with long liquidations).

The market’s main players continue to be bearish on OM... Next, let's review the data state before the crash...
Firstly, looking at the most sensitive chip concentration, the long chip concentration of OM had already dropped to a near one-month low before the price began to plummet (with a downward trend). This indicates that the proportion of long positions held by whales started to decrease, and after a slight rebound in short-term chip concentration, it triggered the crash.

This is similar to the previous drop (April 7), both showing a rebound in the overall long chip concentration downtrend before starting to decline, and there was a significant data divergence (price dropping while chips rising). 💡 Generally, when there is a decline in chip trends and divergence, considering short positions is a better choice.
In most large-cap cryptocurrencies, chips generally fluctuate with price. When the price rises, chips increase, and vice versa. If chips start to diverge from price performance, it indicates divergence!

From the data state before the crash, Binance whales still held a certain amount of long chip positions. This raises suspicion that the cause of the crash may have originated from selling pressure in the spot market leading to forced liquidation and accelerating the price decline...👀
Besides the performance of the chips, we can also look at the long and short strength data from Blave, which shows more market orders to go long before the crash. If we combine the long strength with whale dynamics, there was a continuous reduction in OI before the crash (along with more market orders), suggesting that whales were inclined to close short positions before the crash...

🤨 Therefore, the main force triggering this crash is not the Binance whales/market makers; they are more likely the force that further pushed the price down after it started to drop...
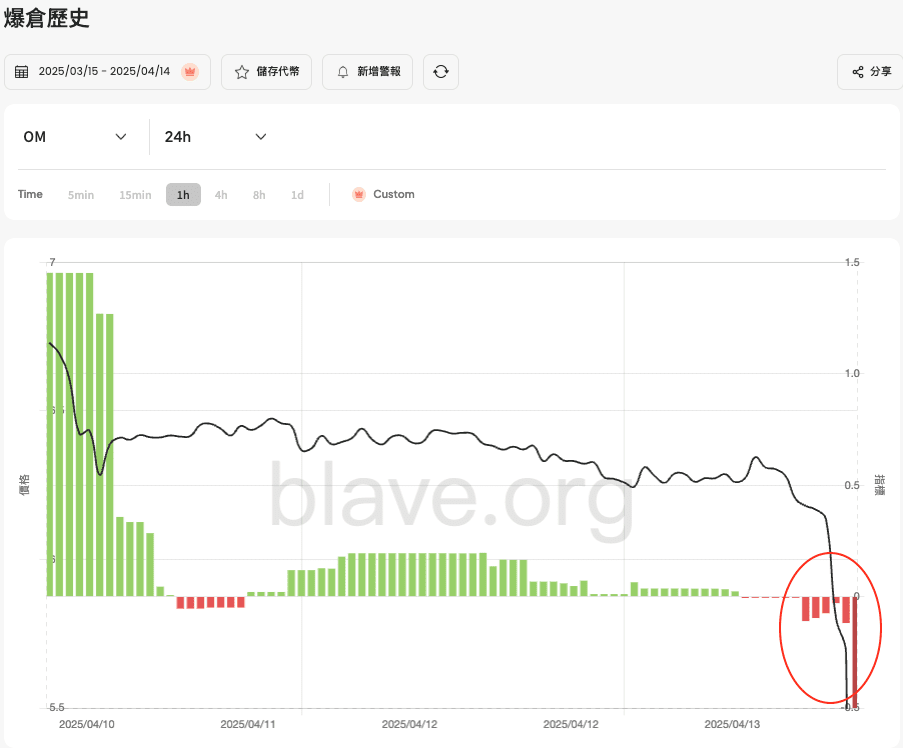

Finally, we can see from the liquidation data that during the decline, long positions were gradually liquidated, with a large number of long positions being liquidated at 2 AM on the 14th (historically extreme value), and after a significant liquidation, the market saw a slight rebound.

As of now, according to the Blave liquidation map, there are still many long positions in the market after the crash $OM . The first significant long liquidation position below is at the 0.72 ~ 0.7 level, while the larger short liquidation area above is at 0.88 ~ 0.9.
Therefore, if the chip continues to concentrate on shorts, there is still room for the price to drop further, and it requires continuous attention!
----------------------------------------------------------------------------------------
Data Source: blave.org
#OMUSDT #mantra
