
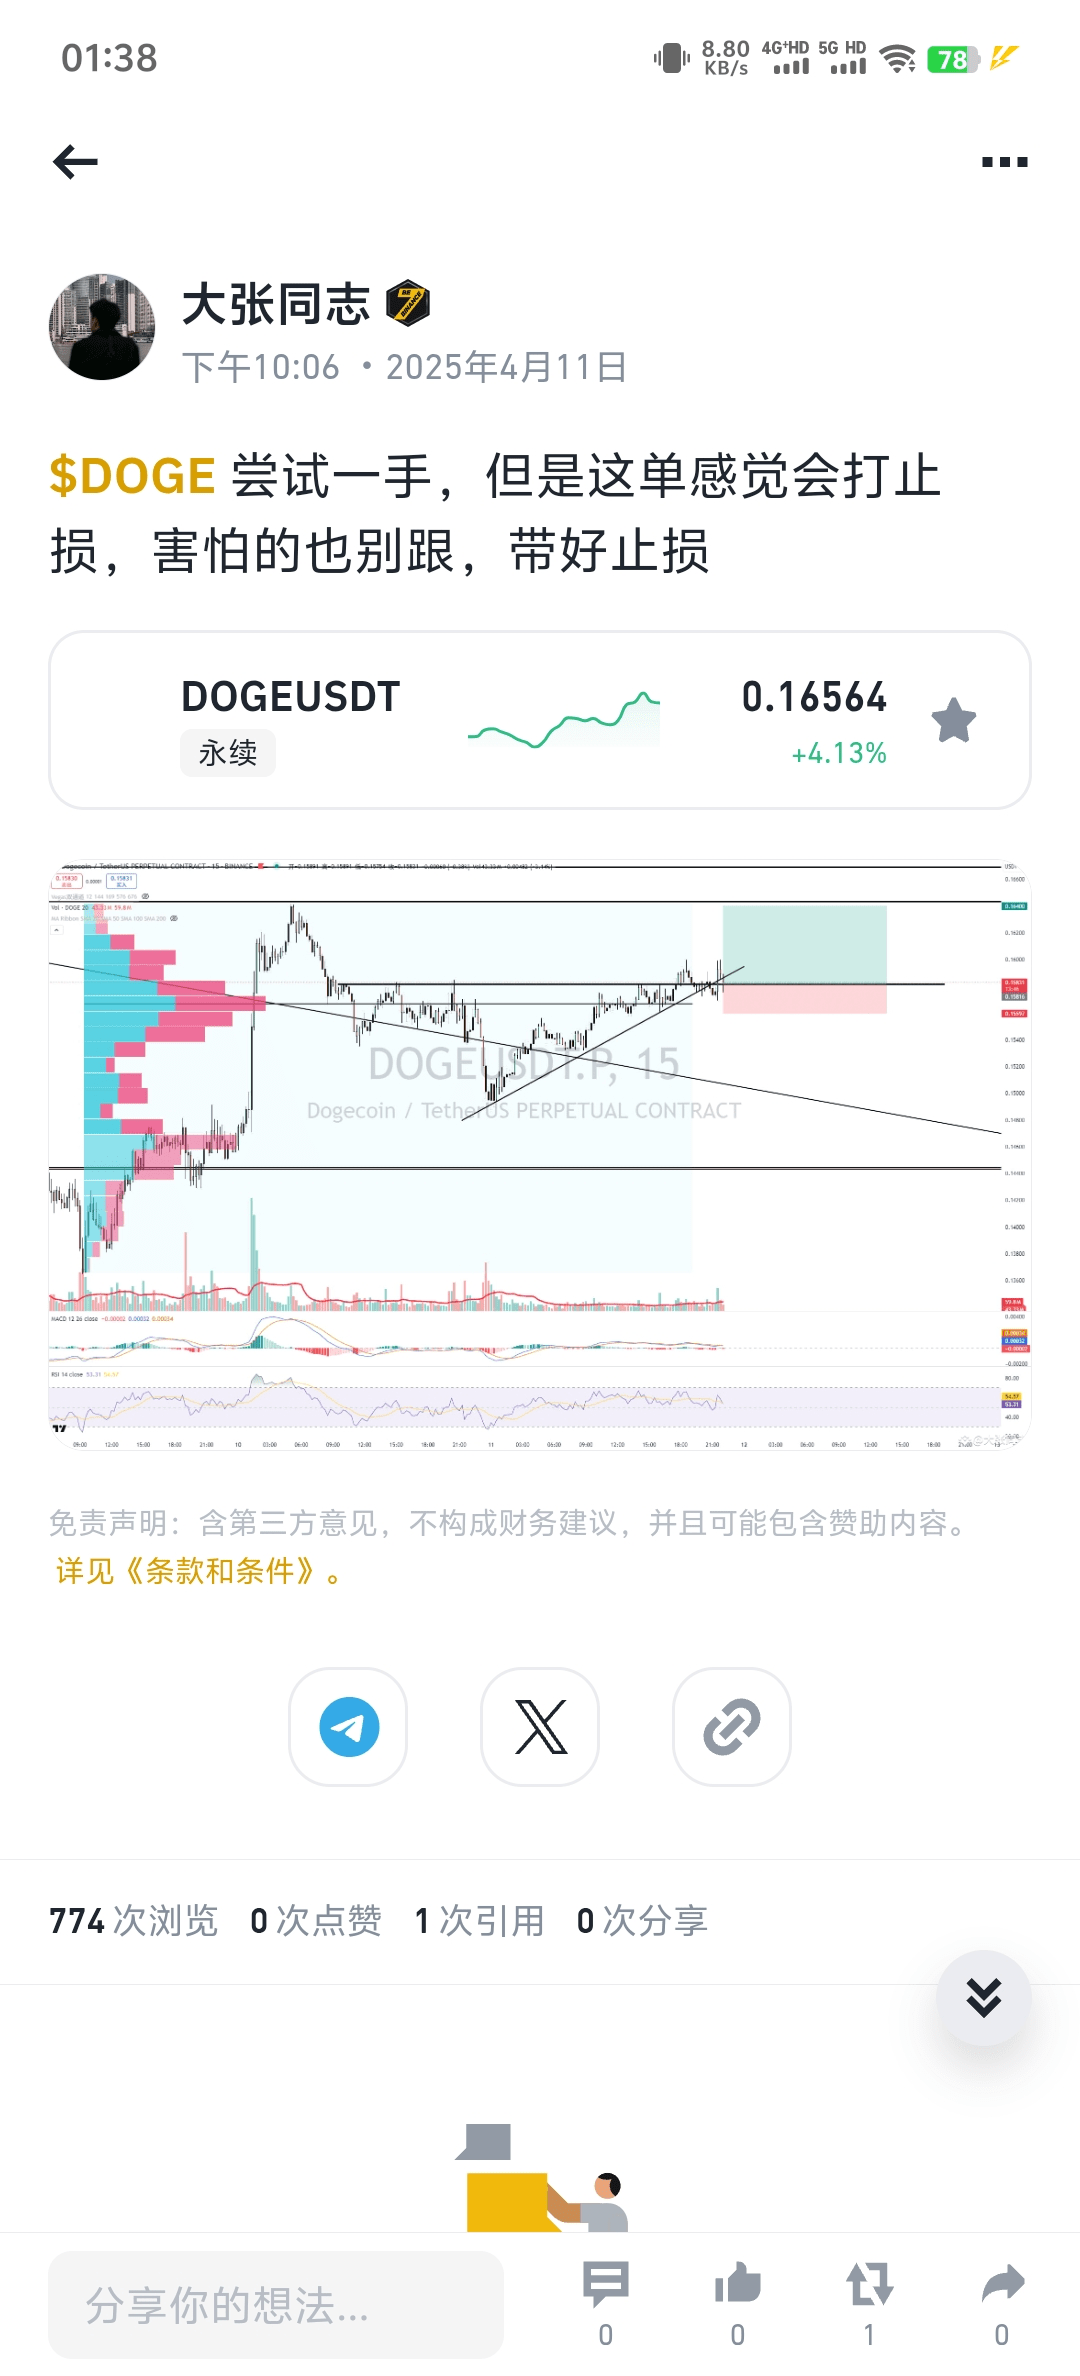
$DOGE #Exercise-style explanation: Why I took the long position on DOGE on April 11.
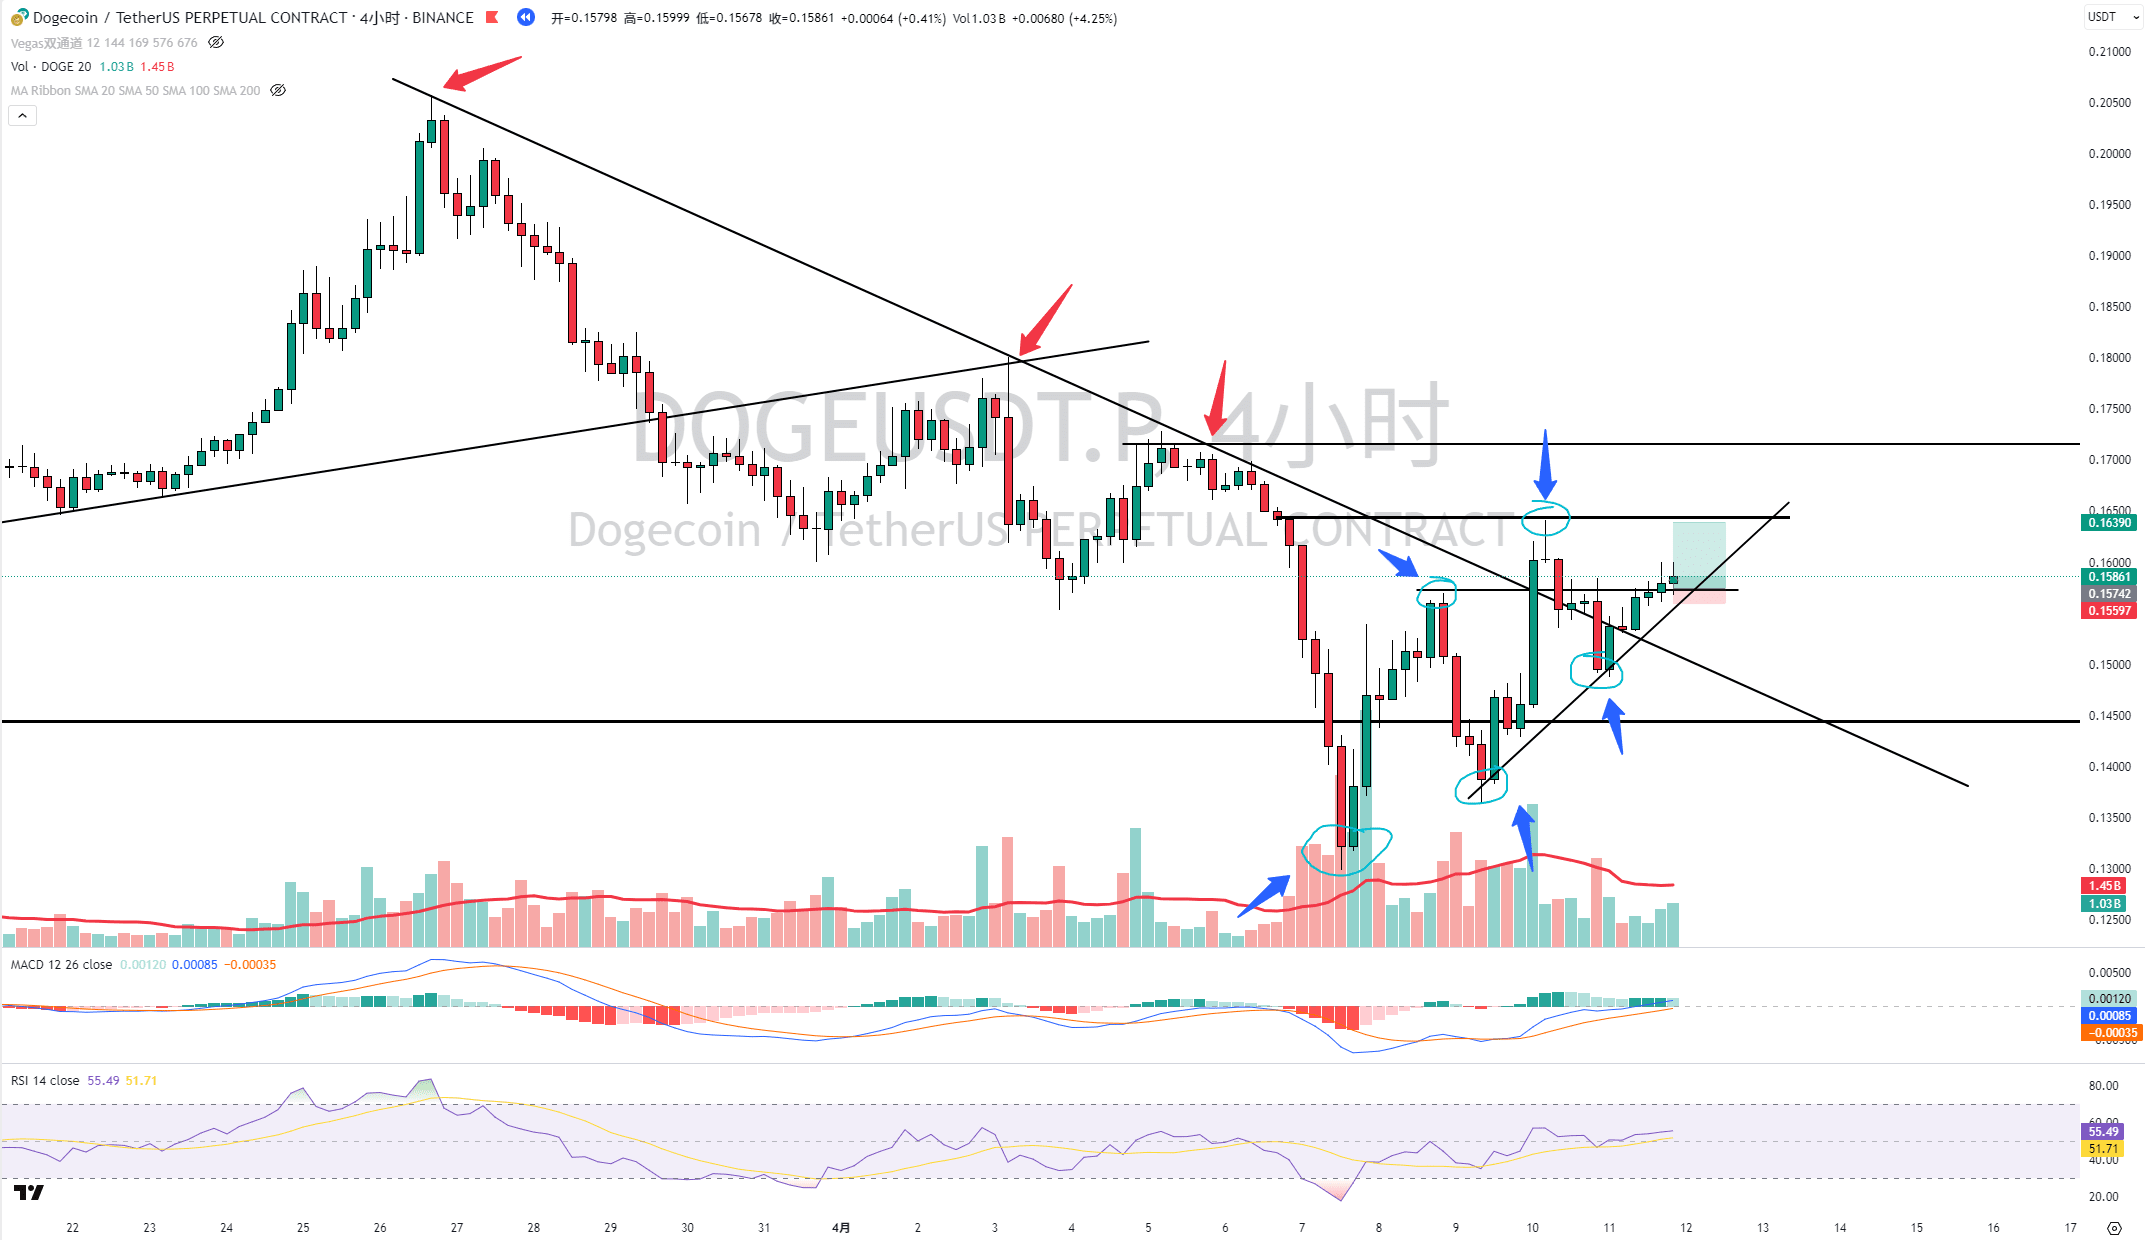
When you get a target, you definitely look at the larger timeframe charts to confirm the current trend, right? On the four-hour level, breaking the downtrend line, indicated by the blue arrow, a double bottom stabilizes and creates a bullish trend structure! Therefore, try to follow the trend when taking long positions; the win rate might be higher because the power of the trend is stronger, which can be understood as the times create heroes.
Switch to a 1-hour timeframe to observe. Look for some representative candles and start analyzing from the micro perspective.
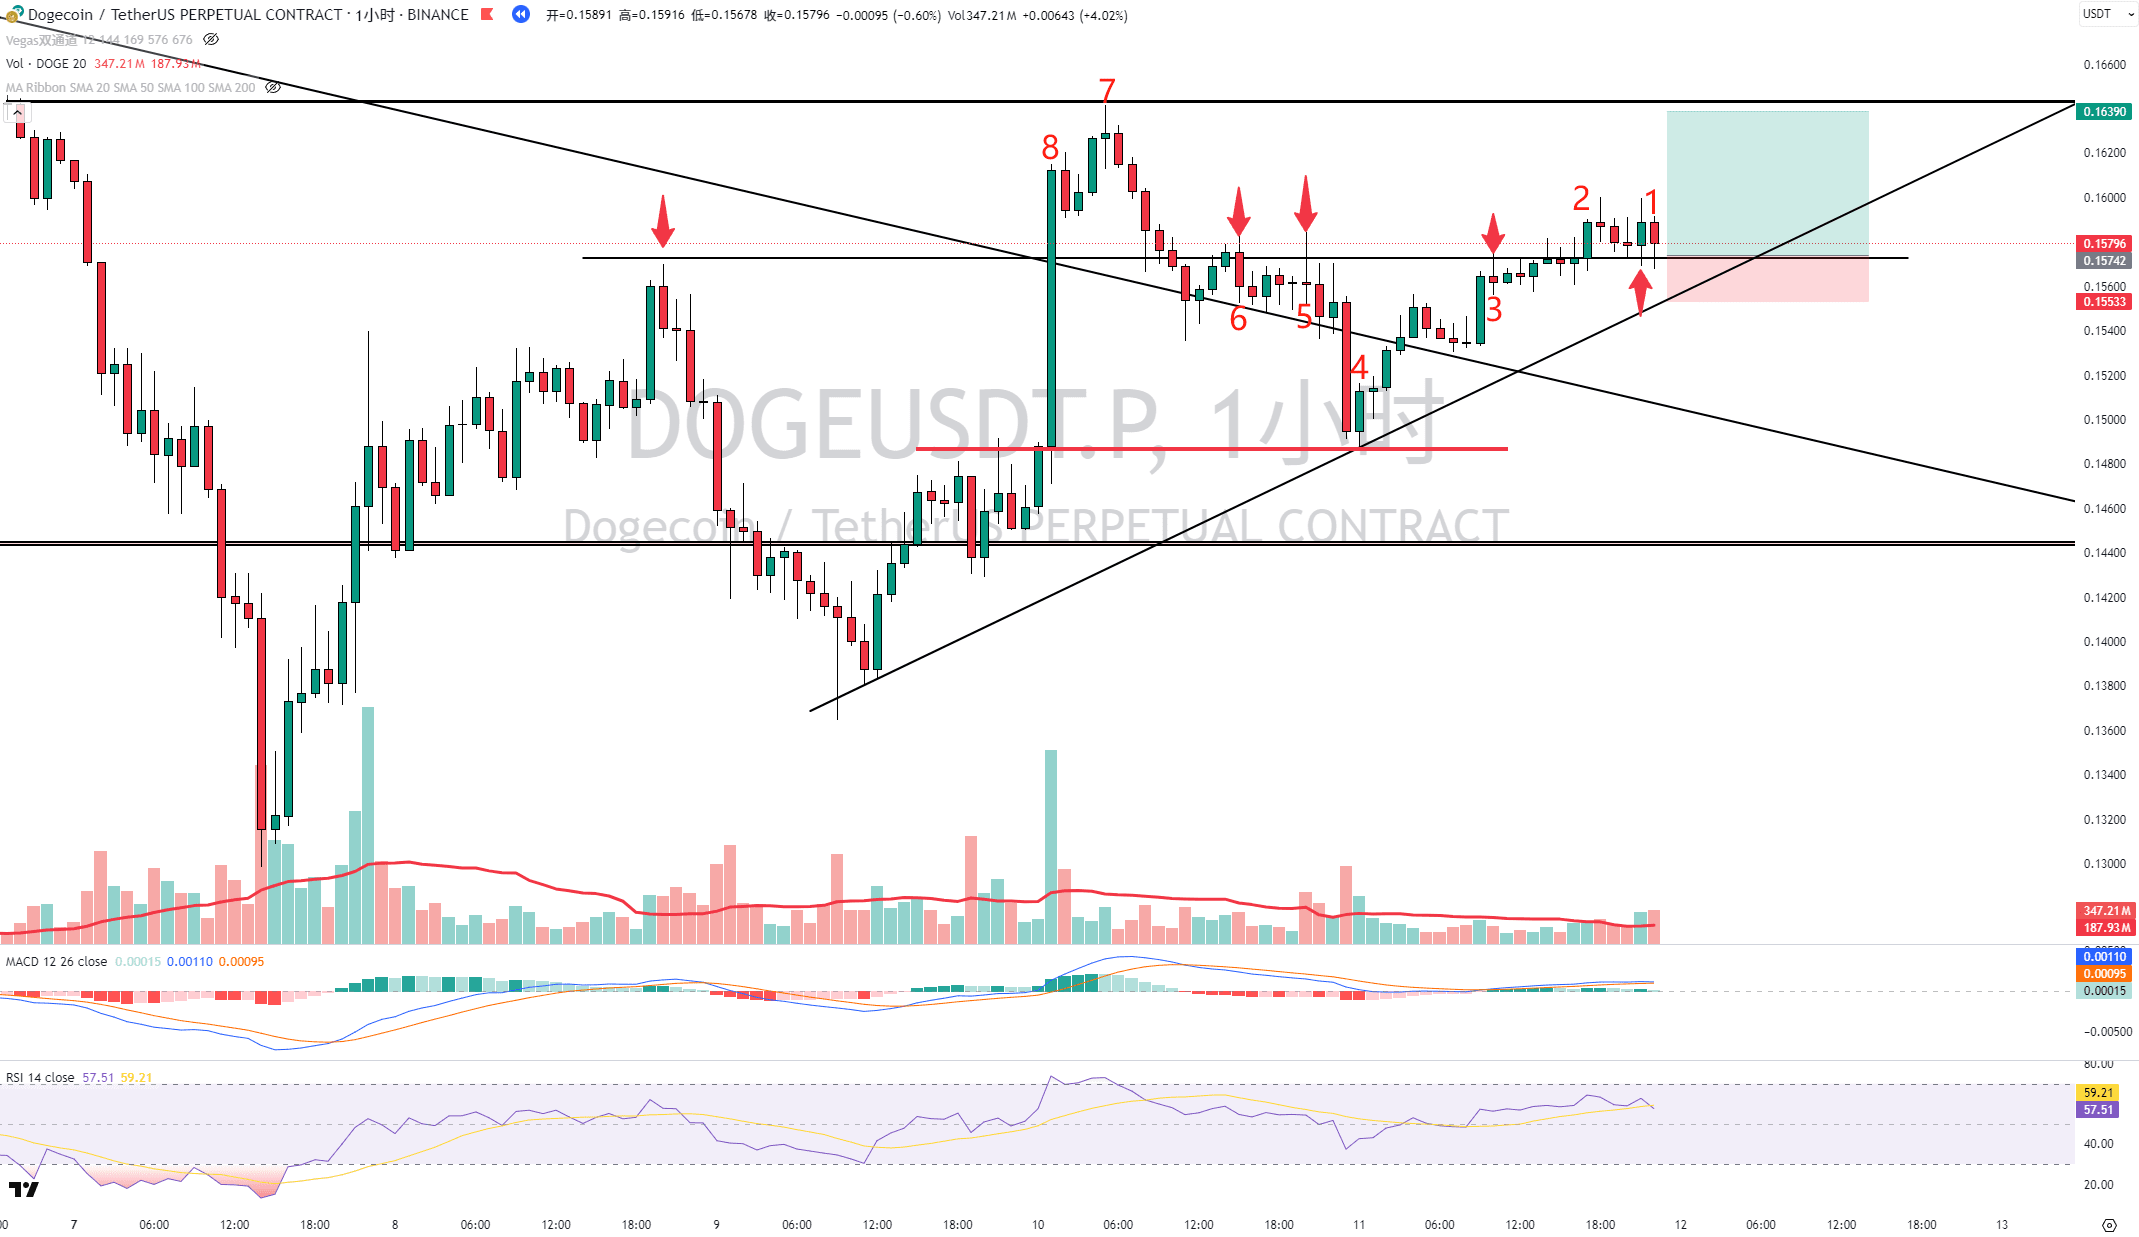
K1, a hammer candle combined with slightly higher volume (strictly speaking, it cannot be called a hammer candle), with a noticeable lower shadow, indicates support strength; the bears are making efforts but have not broken the support, showing strong support from the bulls.
K2, a small bullish candle accompanied by normal volume smoothly stands above, confirming that there is almost no floating supply in the market, and the subsequent three small bearish candles further validate this.
K3, a small bearish candle accompanied by low volume, when viewed with the previous bullish candle indicates a bearish engulfing pattern, but does not necessarily represent the market reaching a top; it can only be said that there may be resistance, but the subsequent series of small candles indicate that there is no significant floating supply at this resistance level, so a breakout of this resistance may not require a volume increase.
K4, a small bullish candle accompanied by slightly higher volume, forms a bullish engulfing pattern with the previous bearish candle, indicating absorption of sell orders. Is there a stark contrast between the bearish engulfing pattern formed with K3? After K4, all bullish candles push the price up, indicating that there is demand and buying in the market.
K5, a shooting star accompanied by high volume indicates a bearish signal and closes below resistance, which also indicates the existence of floating supply in the market. Isn't this a right-side short signal? The subsequent sell orders follow and expand, so this large bearish candle is not surprising.
K6, a significant bearish candle accompanied by normal volume pulls the price back below resistance, indicating that floating supply has reappeared in the market, and it's worth observing whether sell orders follow or if any candles appear that absorb sell orders.
K7, a doji with low volume indicates abnormality; its price action represents intense long-short competition and should be accompanied by at least higher trading volume, indicating that the main force is controlling the position, looking at the subsequent direction.
K8, everyone's favorite super bullish candle accompanied by huge volume, the trading volume validates the effectiveness of the price movement, indicating strong demand. Its starting point attracted the interest of market bulls. From a human perspective, returning to the entry point for successful profit makes people want to go long at this position again, thus forming a potential support effect, leading to the appearance of K4. It is also the resistance of the previous small-level consolidation area.
Macro:
The structural high point in front forms resistance; when the price rises to this position, it may exhibit resistance behavior, and the market behaves similarly. A large bullish candle indicates strong market sentiment and a direct breakout. When the price retraces, it naturally needs to test this resistance. After absorbing the sell orders at this position, the price pushes higher again to test market supply. A direct breakthrough without significant supply makes resistance turn into support, becoming a position for the main force to accumulate. The bullish forces pushing the market will inevitably create new structural highs.
This is the logic of this trade, mainly examining the ability to recognize trends, understanding market floating supply and demand, identifying support and resistance swap levels, recognizing engulfing patterns, and the significance of shooting stars and doji price actions. So, do you think making a good trade is simple?
