

Introduction
Recently, the cryptocurrency market has been impacted by the latest tariff policies of the Trump administration, causing a rapid pullback in global risk assets, and the cryptocurrency market has not been spared. Bitcoin fell sharply from a peak of $88.6K to a low of $74.4K, with an overall decline of about 16%; meanwhile, Ethereum's performance was even more dramatic, dropping significantly from a high of $1,960 to a low of $1,410, with a decline of up to 28%. Market panic quickly spread, leading to massive liquidations of leveraged positions, and trading sentiment noticeably weakened in the short term. This article will provide an in-depth analysis of on-chain data, market indicators, and actual trading conditions to give you a glimpse of the current state of the market.
Bitcoin
Bitcoin Active Addresses

Figure 1. Bitcoin Active Addresses (2015-2025)
From historical experience, whenever a Bitcoin bull market is about to end, the number of active addresses fails to exceed the previous high point on the second rebound, and then it begins to enter a bear market. Unfortunately, this time's bull market seems to exhibit the same situation; the number of active addresses has shown a clear downward trend and has not exceeded the previous high point. This indicates that market participation is increasingly low, and investors may need to start paying attention to the risks of the upcoming bear market.
Note: The number of Active Addresses refers to the number of unique addresses active in the network as senders or receivers, counting only those addresses active in successful transactions.
Bitcoin Short-Term Holder Profit Ratio (STH-SOPR)

Figure 2. Bitcoin STH-SOPR (2021-2025)
The Short-Term Holder Profit Ratio (STH-SOPR) has dropped below the recommended entry point for this bull market pullback (green range). Past experience tells us that a better entry timing is to wait until this indicator drops to the yellow or even red ranges, indicating a market bottom or the low points of a bear market downward trend. Therefore, it is advisable for investors to be a little more patient and see if the market will provide a better entry opportunity.
Note: The Short-Term Output Profit Ratio (STH-SOPR) is a key indicator used to measure the behavior of short-term holders, particularly focusing on the holding period between 1 hour and 155 days. This indicator excludes data where the holding time is less than 1 hour or exceeds 155 days, aiming to track the movements of short-term investors. When the SOPR value exceeds 1, it means that more short-term investors are selling when in profit; when the SOPR value is below 1, it indicates that more short-term investors are selling when at a loss, reflecting changes in market sentiment and short-term trading strategies.
Bitcoin Net Unrealized Loss (NUL)

Figure 3. Bitcoin Net Unrealized Loss (2021-2025)
When we mention the STH-SOPR indicator, it is usually looked at alongside NUL, as NUL is a useful indicator during declines. Currently, NUL has entered the 5% range of bull market pullback, with the next more severe stage being 20%, which typically appears at the beginning of a bull market. More severe bear market states are around 35%, 50%, to 65%. Investors can continue to monitor this indicator and wait for a safer entry point to emerge.
Note: Net Unrealized Loss (NUL) refers to the value of all unspent transaction outputs (UTXOs), multiplied by the price difference between their creation price and destruction price (calculating only the loss portion), then divided by the market capitalization to obtain the value.
Assuming the recent coin movement is the result of purchasing behavior, NUL represents the total number of UTXOs currently in a loss state. When the NUL value shows an upward trend, it means that more and more investors are entering a loss state, possibly indicating that the market is approaching a 'potential bottom.'
MicroStrategy Buys BTC
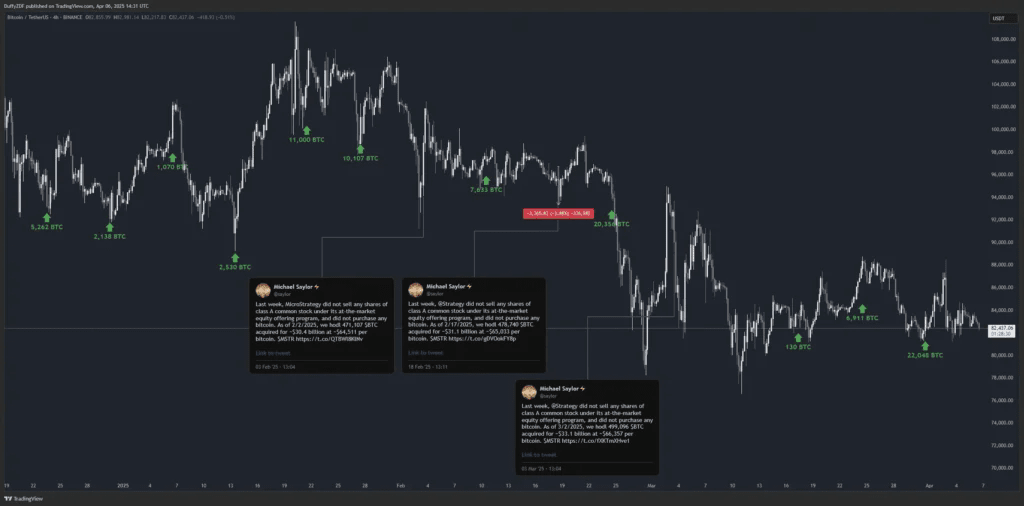
On 2025/03/31, Michael Saylor announced on X (Twitter) that Strategy increased its holdings by 22,046 BTC (average price 86,969).
Currently, the strategy holds a total of 528,185 BTC (average price 67,458)
On-chain operation records: Related links
Bitcoin Market Share
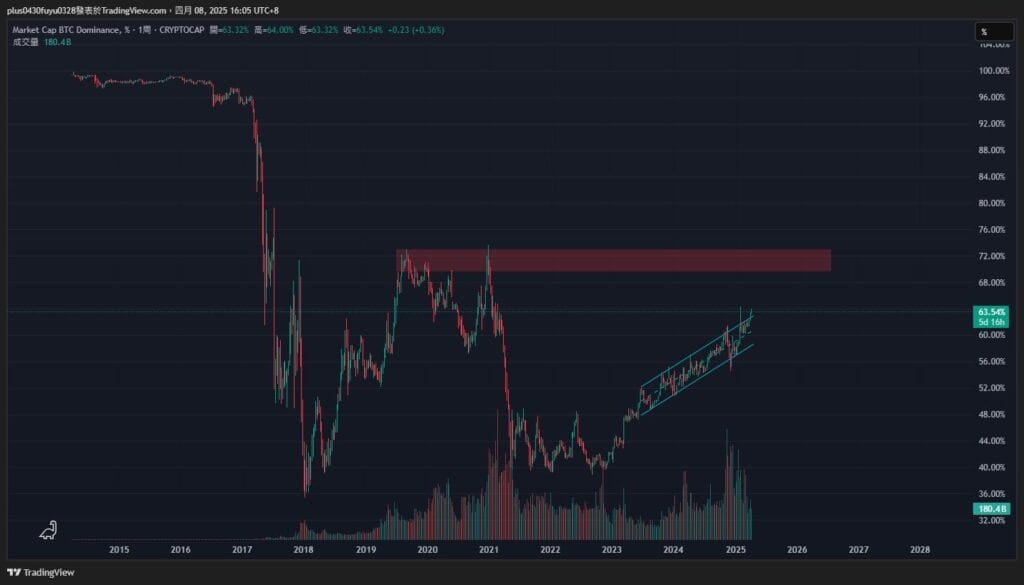
Currently, the market share of Bitcoin is undergoing channel climbing. If the altcoin season is to arrive, the proportion of Bitcoin in the overall market must be reduced. Rise > Channel > Rise is the end of a cycle. Coupled with horizontal pressure levels, it can be estimated that if BTC.D reaches around 70%, a wave of altcoin season may be on the horizon.
BTC Weekly

In the weekly timeframe, Bitcoin has completed a 1:1 rise through a descending channel.
BTC 3-Day Moving Average

From the three-day moving average, if the white line range is the top, it will at least complete a decline of the same magnitude as the rise. As for the green box, which everyone is more concerned about regarding support and resistance exchange zones, I personally don't reference it. In my experience, support that hasn't been tested for a long time is inferior to the effectiveness of densely held areas. Therefore, during the previous upward continuation pattern, I drew a VPVR and focused on observing whether the POC price level (67~68K) reacts with the drop.
BTC 4H

Currently, in terms of volatility, it can be seen that a large number of orders were triggered after breaking below the low point and then rose after re-establishing at the lower edge of the range. If the lower edge of the range is retested, it can be expected to test the mid-axis, and even the upper edge of the range with equal height liquidity can be seen as a target for attack.
Ethereum
Ethereum Coinbase Premium

Figure 4. Ethereum Coinbase Premium (2022-2025)
From the Coinbase premium index, it is evident that US investors have significantly reduced their investment in Ethereum during this bull market, which is also an important reason why Ethereum has been performing poorly in this round. From a long-term perspective, if US funds continue to decrease, the support for Ethereum's price will weaken, and investors should pay special attention to the trends in the US market.
Note: The Ethereum Coinbase Premium Index refers to the percentage difference between the price on the Coinbase Pro exchange (USD trading pair) and the price on the Binance exchange (USDT trading pair). When this index value is high, it usually indicates that US investors are showing strong buying pressure on Coinbase.
Ethereum New Contracts

Figure 5. Ethereum New Contracts (2022-2025)
In the past six instances of significant increases in new contract numbers, only once did it occur at a relative high point; the other five times were at phase low points, usually accompanied by obvious price rebounds. This time, the number of new contracts for Ethereum has reached the highest point in nearly three years, which may indicate some support near the current price level. However, the overall market sentiment is still very pessimistic, so investors may still want to observe and not rush to enter the market in the short term for safety.
Note: The number of new contracts on Ethereum refers to the total number of smart contracts newly created on the Ethereum network, used to measure the development and activity level of the blockchain ecosystem.
ETHBTC

It can be seen that the green block represents support and resistance that has not been tested for a long time, which does not provide much support against the decline, and ETH/BTC is undergoing a gradual decline in an arc pattern. The author pessimistically believes that it may need to test the previous low (around 0.016) before ETH can enter a strong phase.
ETH Weekly

Compared to BTC, ETH is already in a rescue state. After hunting the equal high white line, it has broken below the support line established over the past two years. Currently, caution is needed while waiting for a bottom.
ETH 3-Day Moving Average

The yellow dashed line represents the position of this decline at 1:1. If the blue circle is considered a pullback of this head, it may drop to lower price levels. If one wants to enter with a bullish strategy, waiting for a bottom pattern or a second test would be a more robust approach.
Altcoin
Dogecoin Smart Money Transfers Dogecoin

On 2025/04/05, a Dogecoin address starting with A8tdn transferred 4,000,002 DOGE to the Coinex exchange.
According to past records (Aside from Musk: Is Dogecoin's real price driver?), this address is smart money. Every time there is a transfer, there is a period of decline.
On-chain operation records: Related links
Binance Internal Transfer Layer

Following the previous Binance internal transfer, Layer has risen by 28.50%. Subsequently, on 2025/04/03, a Binance hot wallet starting with 5tzFk transferred 10,547,000 Layer to a Binance cold wallet starting with 9WzDX.
On-chain operation records: Related links
Conclusion
Overall, the current situation for Bitcoin is not optimistic. The number of active addresses has decreased, and the STH-SOPR has dropped below the bull market adjustment low point. Market risks have indeed increased significantly, and it is advisable for investors to patiently wait for clearer bottom signals before entering the market. Regarding Ethereum, due to the reduced investment from US funds, the Coinbase premium index continues to remain sluggish, and the chances of a rebound in the short term are slim. Although the number of new contracts is high, the overall market atmosphere is poor, so it is recommended to be cautious in the short term and continue to observe the market situation before deciding on the next steps.
This report is for informational sharing purposes only and does not constitute any form of investment advice or decision basis. The data, analysis, and opinions cited in the text are based on the author's research and public sources and may be subject to uncertainty or change at any time. Readers should make investment judgments cautiously based on their own circumstances and risk tolerance. For further guidance, it is recommended to seek advice from a professional consultant.

