Technical analysis of ADA against USDT
First: the short term (days to a week)
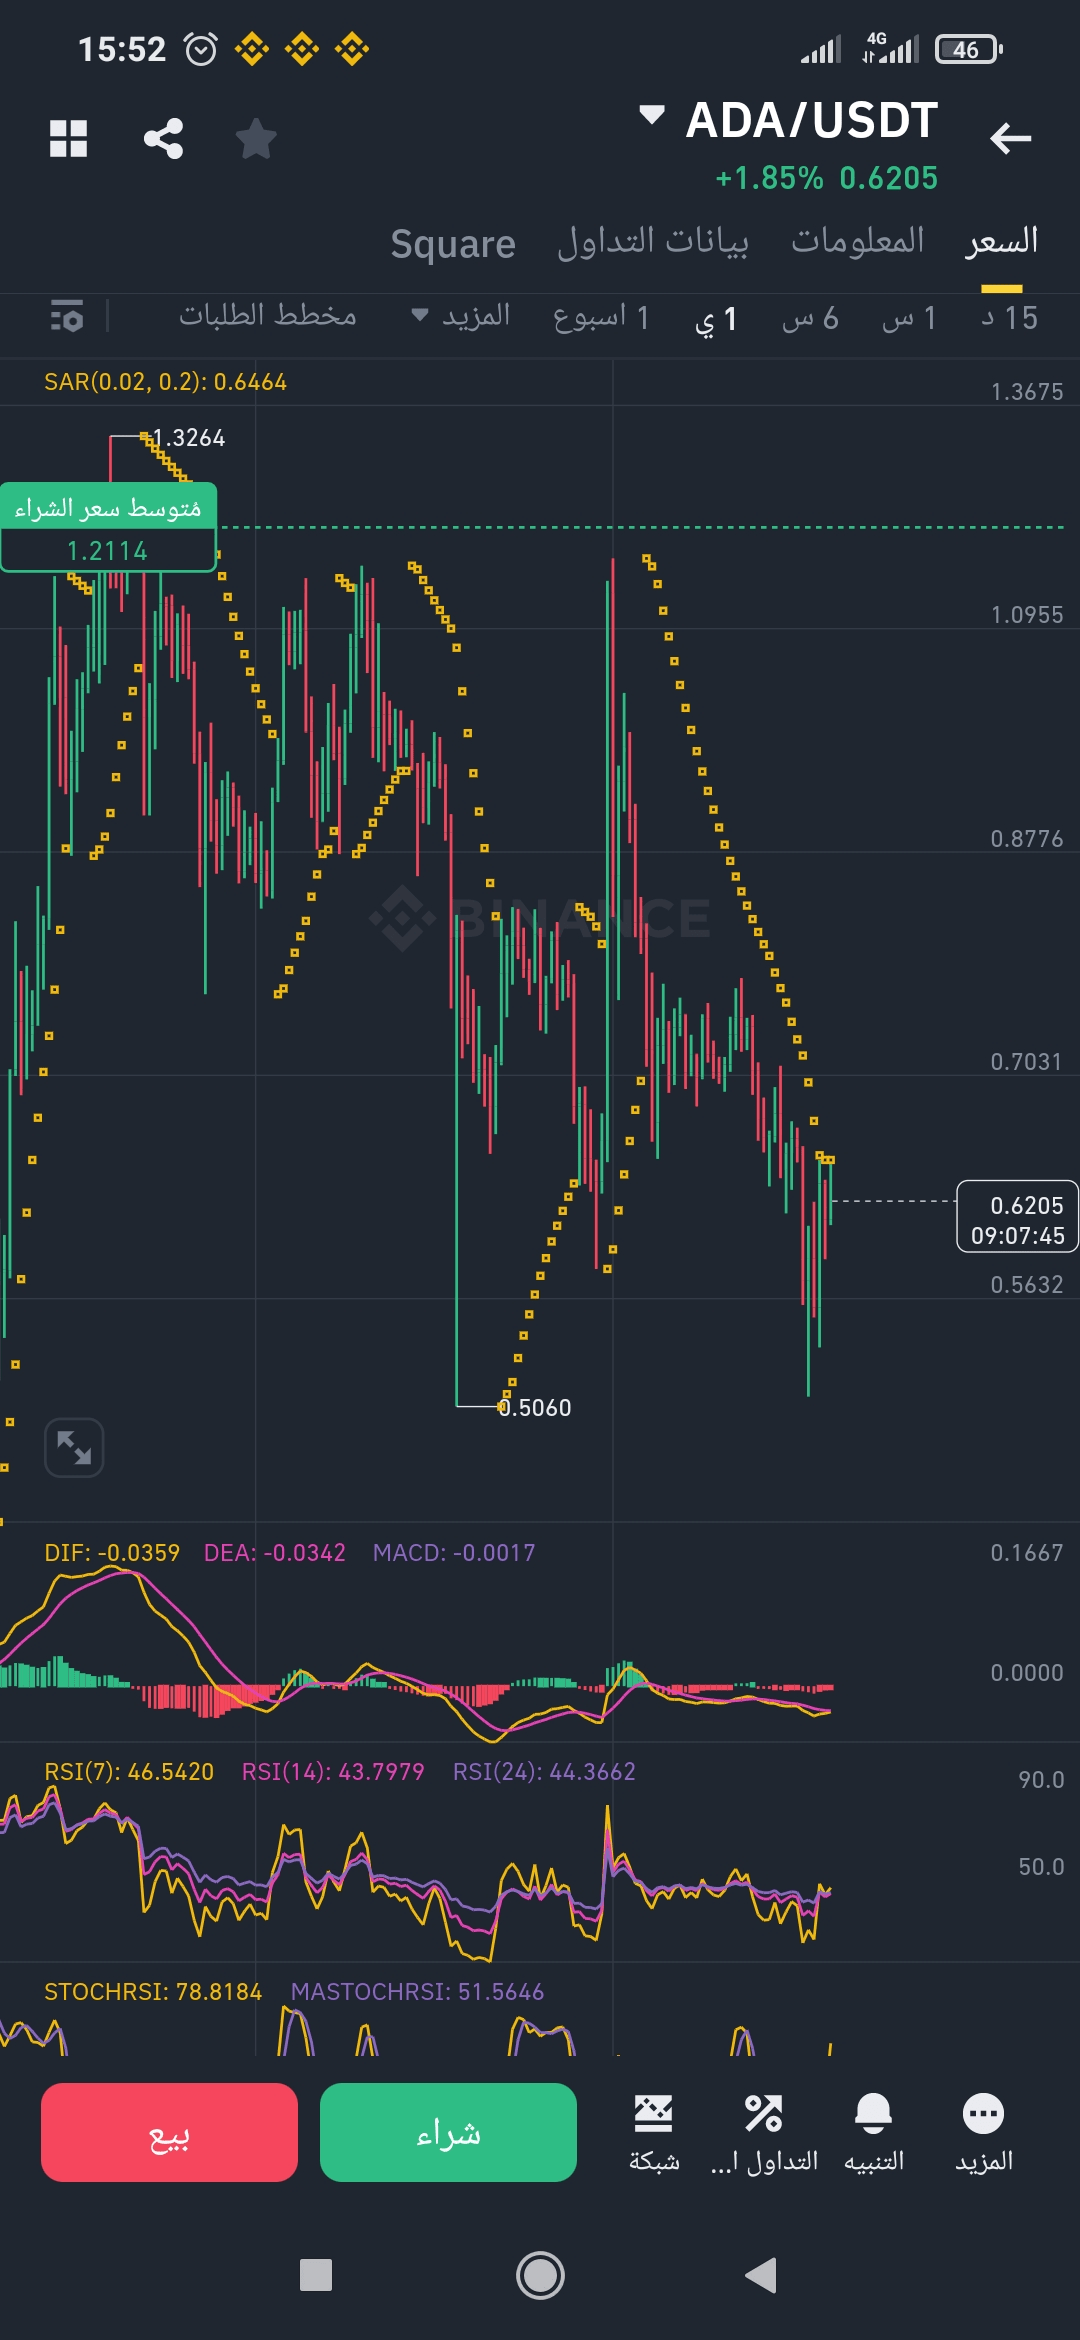
- Current price: 0.6205 USDT
- Indicators:
- RSI (Relative Strength Index): ranges between 43 and 46, indicating that the currency is not in an overbought or oversold zone but slightly leans towards rising.
- Stoch RSI: at high levels (78.81), which may indicate an approaching overbought condition in the short term.
- MACD: shows a slight negative crossover, but the sideways movement indicates market caution.
Limited potential for a bullish rebound towards 0.65 before facing resistance, and it may drop again to test the 0.58 - 0.60 area.
Second: the medium term (weeks to two months)
- General trend: sideways with a downward bias, clear from the averages and descending peaks.
- Important support level: 0.5060 (tested and bounced back strongly).
- **Average purchase price: 1.2114, indicating that many investors are currently at a loss.
If the price stabilizes above 0.60, it may retest the 0.70 - 0.75 areas in the coming weeks, provided good liquidity enters. A break below 0.58 may bring the price back to the 0.50 - 0.52 range.
Third: the long term (months to a year)
- Overview: The currency has lost more than 50% from its peak and is still trading below the average purchase price.
- Annual indicators: The currency's performance is positive over the year (+5.85%), indicating potential for an upward trend if the market stabilizes.
If resistance at 0.75 is broken, we may see a gradual rise to 0.90 - 1.00 in the coming months, especially if the bullish market momentum returns.
Recommendation:
- Short term: cautious, no buying currently except after confirming a breakout above 0.65.
- Medium term: monitoring, with the possibility of entering after breaking above 0.70.
- Long term: investment is possible with measured amounts while adhering to a stop-loss strategy at 0.50.
Not financial advice, do your own research.