After the last wave of U.S. stock decline of -10% is completed, a rebound occurs due to the temporary easing of panic and issues like tariff easing. Currently, we are experiencing a rebound period. I believe that until there is a change in the big macroeconomic environment (tariffs/inflation/recession expectations/slowdown in tech stock EPS growth, etc.), the rebound is limited and will not exceed the 5.8% and 7.2% positions in U.S. Stocks Chart 3.
U.S. Stocks Chart 3↓

In fact, I believe the most it can rebound is to 5.8% (with the remaining increase of 0.98% as of 2025/3/25/04:00 closing at 5767 points), because while the easing of tariffs is a negative factor and eliminates uncertainty, it also marks the beginning of specific tariff policy contention, and the start of the 'macro data validation period' for the inflation impact brought by tariffs, as well as the start of Q1 earnings season. There are still many uncertainties, and the tendency for negative factors outweighs the positive ones.
Thus, the end of this round of increase and the arrival of the next round of decline will be at the daily level target positions indicated by the red box in U.S. Stocks Chart 3 (calculated from 5824 points, declining between 6%-9%), and also between a decline of -12.5%-16% from the highest point of 6147, with the final decline range indicated by the green box in U.S. Stocks Chart 3 (-12.5%-16%).
Therefore, the ratio of the rise and fall of BTC to U.S. stocks is 1:3. If U.S. stocks rise by 0.98%, BTC could rise by 3%.
① Between 89500-90500 (as in the gray area of BTC Chart 3 where this round of rebound ends);
② If BTC rises due to short-term events like the 'implementation of reserve currency policy'/'Crypto Working Group Roundtable'/'Senate abolishing IRS DEFI broker rules' during this period, it may surge to 5%-7%, which is between 92300-94000 (as in the gray area of BTC Chart 3 where this round of rebound ends). During the consolidation period of U.S. stocks, BTC may achieve a slight overshoot due to its own positive factors, but such short-term positives cannot change the downtrend in the larger macro context, and it will soon continue to decline, ultimately reaching the downturn position of the larger cycle.
BTC Chart 3↓
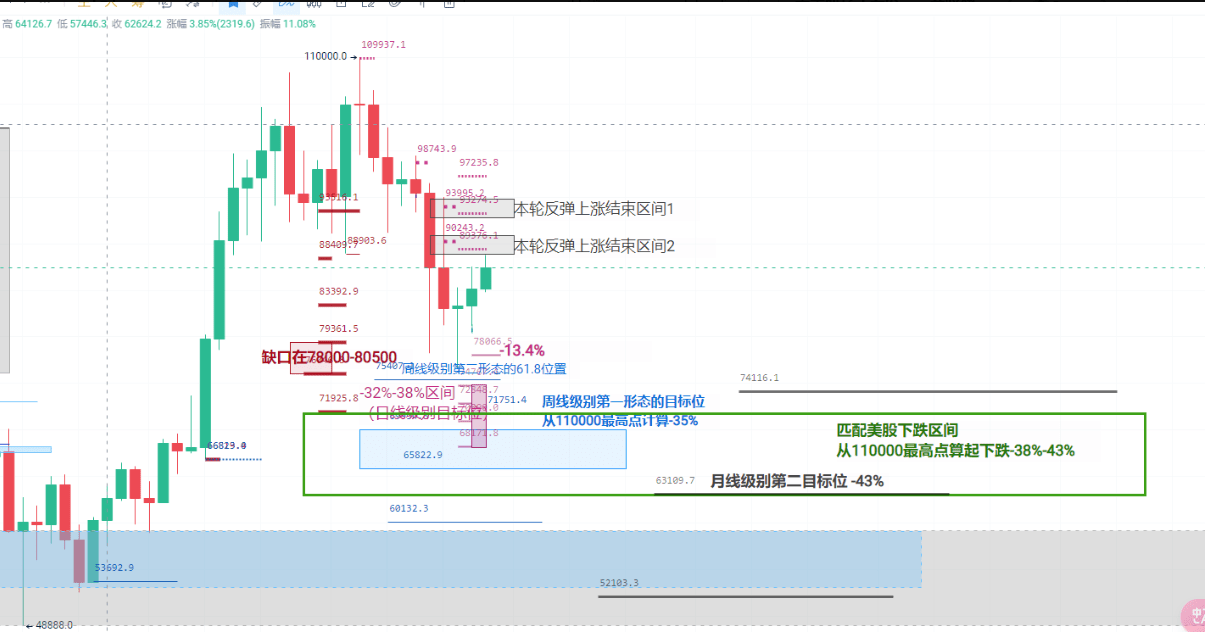
The short-term rebound of BTC ends, with the decline position indicated by the green box in BTC Chart 3, which is a resonance area of the daily level target position + the first weekly shape target position + the important 61.8 level of the second weekly shape + the second monthly level target position, declining -38%-43% from the highest point (between 70000-62000). This range also aligns with the major players' URPD chip area. This is not a case of carving a boat to seek a sword; the target positions I derived and the URPD have been consistent for several years.
The above ranges of declines in U.S. stocks and BTC are limited to the position of the next downtrend after this round of rebound ends. The opportunities for reaching these positions will be based on the following aspects:
1) The tug-of-war between retaliatory measures from other countries after the implementation of equal tariffs.
2) The negative impact of hard data such as CPI/PCE/labor market caused by the implementation of tariffs.
3) The Q1 financial reports of the top seven technology stocks falling short of market expectations.
The time period to reach the target downtrend will be within the second quarter.
————————————————————————————————————————————————
The above forecast is the basic analytical work based on my own learning and trend judgment processes in recent years, and also serves as the fundamental basis for my real trading operations. It does not constitute any investment advice, and I hope that colleagues passing by can provide more suggestions and guidance for mutual exchange, learning, and progress.