Use 5000 to trade cryptocurrencies and turn it into 1 million. Listen to my practical advice! See what method I used to earn over 10 million in 5 years!
The core point is: rely on contract trading + amplify profits!
But don't rush in; first convert this 2000 into 300U (approximately 300 dollars). Let's take two steps: Step 1: Small capital snowball (300U → 1100U), take out 100U to trade, focusing on the most popular coins recently.
Remember two things: ① Run when you double your money (for example, stop immediately when 100 becomes 200) ② If you lose down to 50U, cut your losses. If you’re lucky and win three times, you can roll to 800U (100 → 200 → 400 → 800). But take profits quickly! Play a maximum of three rounds, stop after making around 1100U. At this stage, luck plays a large part, so don’t be greedy!
Step 2: When you have more money, adopt a combination punch (starting from 1100U).
At this time, split the money into three parts to play different tricks:
1. Quick in and out type (100U) focuses on 15-minute fluctuations, such as Bitcoin/Ethereum, which are more stable coins. For example, if you see Bitcoin suddenly surge in the afternoon, immediately follow the rise, making a 3%-5% profit and then exiting, just like street vending, with small profits on high sales.
2. Buddha-like fixed investment type (15U per week) regularly invests 15U weekly to buy Bitcoin contracts (for example, if it is currently 50,000 dollars, you think it can rise to 100,000 in the long term).
Just treat it like a piggy bank; don’t panic if it drops. Wait for half a year or a year; it's suitable for those who don't have time to monitor the market.
3. The main event trend single + (all remaining funds) strike hard when the big market arrives! For example, if you find that the Federal Reserve is going to cut interest rates, Bitcoin might surge, so directly open a long position. But you must think in advance: how much to profit before running away (for example, double the profit), and how much to accept as a loss (maximum 20%).
This trick requires being able to read news and understand technical analysis; beginners should not act recklessly!
Important reminder: ① Bet a maximum of 1/10 of the principal each time; don’t be too greedy! ② Every order must set a stop-loss!
3. Trade a maximum of 3 orders per day; if you feel an itch, go play around.
4. Once you reach the target, withdraw it; don’t think about 'making another wave'!
Remember: Those who rely on this method to turn things around are ruthless - ruthless to others, and even more ruthless to themselves!

Summary of MACD indicator + trading operation techniques
How to interpret the MACD indicator for digital currency? MACD is the Exponential Moving Average Convergence Divergence, which absorbs the advantages of moving averages, allowing for buying and selling.
Trading works well when the trend is clear, but once encountering a choppy market, the signals from moving averages become too frequent and extremely inaccurate. In the futures market, the margin leverage effect can easily lead investors to suffer fatal losses.
And MACD just happens to achieve this:
1. In a choppy market, it can somewhat overcome the false frequent deceptive signals of moving averages.
2. In trending markets, it can maximize the effectiveness of moving averages!
The MACD patterns are similar to candlestick patterns, including: double tops, double bottoms, head and shoulders bottom, head and shoulders neck, top divergence, bottom divergence, golden cross above water, golden cross below water, etc. Upon closer inspection, they are all variations of double bottoms and double tops. We will discuss this in detail in the next article.
The MACD indicator contains several basic elements; investors unfamiliar with it can first understand it:
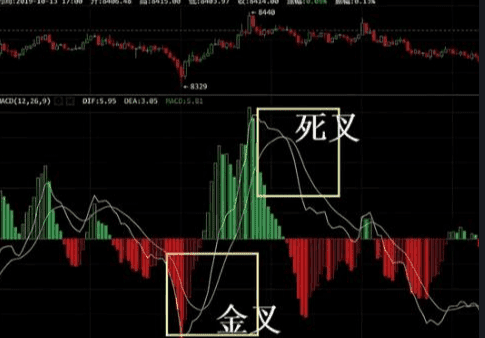
Golden cross: Fast line DIF crosses above slow line DEA, marking the first day of the green column's appearance.
Dead cross: Fast line DIF crosses below slow line DEA, marking the first day of the red column's appearance.
The four major functions of the MACD indicator for trading.
One: Helps to judge the bottom.
When the coin price and MACD area (or DIF value) show bottom divergence, it usually indicates the appearance of a bottom. At this time, pay attention to buying opportunities.
Two: Helps to judge the top
When the coin price and MACD area (or DIF value) show top divergence, it usually indicates the appearance of a top; at this time, it is necessary to consider escaping the top.
Three: Helps to judge the end of a pullback
Once the coin price enters a bullish area, a pullback will occur. After the pullback ends, the price will usually continue to rise or accelerate upward.
Four: Helps to judge the end of a rebound.
When the coin price enters a bearish area, a rebound will occur. After the rebound ends, the price will usually continue to fall or accelerate downward.
The ultimate practical usage of the MACD indicator for trading.
To be more practical, let’s look at common strategies in actual operations.
Classic MACD usage: 'Refusal of dead again' and 'Refusal of golden cross' trading methods.
1. 'Refuse to die again' - boldly go all in when the price surges.
(1) MACD 'refuses dead cross'
That is when the DIF indicator crosses above the DEA indicator, maintaining upward momentum for a period of time, then suddenly
Turns to run downward, but just as it is about to cross below the DEA indicator, it turns back upward, leading to the failure of the 'dead cross' pattern.
(2) Generally speaking, after the 'refusal of the dead cross' appears, the stock price will rise, but the price rarely rises to the previous high.
Degree.
(3) 'Refusal of dead cross' is one of the tricks used by the main forces to wash positions. For friends in the cryptocurrency circle,
'Refusal of dead again' is a very strong buy signal; when discovered,
When the MACD indicator is about to form a 'dead cross', we should increase our attention and be ready to intervene in that coin.
(4) The best buying opportunity is when MACD starts to rise after forming the 'refusal of dead cross'.
Key points for MACD indicator trading:
1) When the MACD appears a refusal dead cross buy signal above the zero axis, and the price is already running above the 60-day moving average, it is a strong characteristic, and buying can be proactive.
Enter. Especially when the refusal of dead again buy signal first appears above the zero axis, you should be actively buying.
2) When the MACD appears a refusal dead cross buy signal below the zero axis, the coin price is still running below the 60-day moving average, it can be considered a rebound.
Observing first is not suitable.
Intervene.
2. 'Refusal of golden cross'
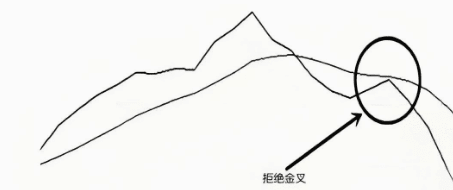
(1) MACD 'refusal of golden cross' means the DIF indicator crosses below the DEA indicator, maintaining downward momentum for a period of time, then suddenly reversing upward, but just as it is about to cross above the DEA indicator, it turns back down, leading to the failure of the 'golden cross' pattern.
(2) Generally speaking, a 'golden cross' is a typical buy signal, but 'refusal of golden cross' is a typical sell signal.
(3) If after the formation of 'refusal of golden cross', other strong buy signals appear, then you can consider intervening in that coin. Key points for MACD indicator trading:
1: Similar to refusing to die again, when the 'refusal of gold' pattern occurs below the zero axis, it indicates stronger downward momentum.
2: If the DIF line gradually approaches the DEA line while the trading volume decreases, it signals that the subsequent strength of the bulls is insufficient. In this case, the anti-dip signal for this formation will be more reliable.
Summary of MACD indicator trading strategies
1. When monsters invest in the cryptocurrency market, they must pay attention to the charts for signs of MACD about to form a 'dead cross'.
Or is it about to form a 'golden again'?
Give it high attention. Before making decisions, be sure to have a clear look at whether it’s 'dead again' or 'refusal dead cross',
Is it 'golden cross' or 'refusal golden cross'?
2. When there is a pullback, if the trading volume continues to decrease and the coin price hovers near an important 30-day moving average, as long as the MACD indicator has not formed a 'dead again' or 'refusal golden cross', it can be tentatively intervened.
3. When the MACD indicator forms a 'refusal of dead again', the price is bound to rise.
Wise speculators always deliberately maintain a proper distance from the market's cryptocurrency 1 minute 15 minutes 30 minutes 60 minutes trading tips.
Trading cryptocurrencies refers to an investment behavior of obtaining profits through buying and selling virtual currencies. With the development of blockchain technology and the prosperity of the digital currency market, trading cryptocurrencies has become a widely adopted investment method. For beginners in cryptocurrency trading, mastering some basic trading mantras is very important.
Trading periods can be divided into 1 minute, 15 minutes, 30 minutes, and 60 minutes. Different time periods correspond to different trading strategies and risks.
In the 1-minute time frame, the market fluctuates greatly, requiring quick decision-making and operations. The '1 minute' in the trading mantra refers to closely monitoring market trends during this time frame to grasp the timing of buying and selling. Stay calm, don't blindly chase highs or panic sell, and ensure good risk control.
In the 15-minute time frame, the market fluctuations are relatively small, but close monitoring is still needed. The '15 minutes' in the trading mantra means we need to observe and analyze the market for a longer time to find suitable timing for buying and selling. Pay attention to risk management, avoid overtrading, and prevent losses due to greed and fear.
In the 30-minute time frame, market fluctuations are relatively stable, allowing for better judgment of market trends. The '30 minutes' in the trading mantra indicates that we should analyze market dynamics more closely to determine the timing for buying and selling. Pay attention to market hotspots and trends, and avoid blindly following the crowd.
In the 60-minute time period, the market fluctuations are relatively small, making it more suitable for long-term investors. The '60 minutes' in the trading mantra means we need to study the market more deeply and find virtual currencies suitable for long-term holding. Pay attention to the overall market trend and avoid trading blindly due to short-term fluctuations.
The cryptocurrency trading 1 minute 15 minutes 30 minutes 60 minutes mantras are basic skills needed for cryptocurrency investors to trade in different time frames. By mastering these mantras, we can better grasp market trends, reduce risks, and increase profits. It is important to emphasize that trading cryptocurrencies is a high-risk investment behavior; novice investors should approach it cautiously, control risks well, and avoid over-investment. Continuous learning and research are necessary to improve one's cryptocurrency trading skills to achieve better investment returns in this market.
A nanny-level tutorial on market position management
Whether in the stock market or cryptocurrency market, good position management means you have outperformed the vast majority of people.
Today's topic is about managing trading positions. Whether it's spot trading or contracts, how you manage your position directly determines your risk control level, average holding price, and ultimately your profit size. This can be said to be the most important aspect aside from direction and mindset.

What is position management?
Position management refers to a specific plan set when you decide to trade cryptocurrencies, regarding opening positions, adding positions, reducing positions, and how to exit the market. Good position management is one of our important means to avoid risks, achieving minimal losses and maximizing profits! How should positions be managed?

Is there a standard? Many traders fail because one of the key reasons is that they treat market analysis as everything in trading, as if analyzing the market can determine victory or defeat. In fact, market analysis is just the most basic work; what truly determines victory or defeat is the work after market analysis, which is the issue to consider after entering the market.
Position management includes capital management and risk control. The term 'position' should not be understood as its literal meaning; it expresses more about when to add positions, how much to add, when to reduce positions, and how much to reduce. It's essentially a roadmap of 'entry, adding positions, reducing positions, and exit'.
Thus, the complete trading process should be:
1. Market analysis; you can use any technical analysis.
2. Position management: After entering the market, you need to consider the possible subsequent events: what to do if profits arise, whether to add positions, close all for profit, or continue holding. What if profits expand again? What if there are losses? Should you stop-loss, or hold the positions, or partially exit? How much loss will lead to a complete exit? Position management considers both risk and return factors.
3. Strictly execute trades. When your plan is clear in your mind, you must start implementing it without letting market fluctuations disrupt your thinking.
4. Summarize the trade. After completing a trade, you need to review the trades from the previous period, covering the three market conditions of rising, falling, and consolidating. Based on this, improve and optimize market analysis, position management, and the process of executing trades.
We must first find the entry point based on our trading skills, which is certainly a support line. When the market is above the support line, the trend is upward; when the market breaks below the support line, the trend is downward. More importantly, the support line is also our basis for defining potential risks, and when the stop-loss is placed below this support line, the potential risk margin is determined. If the initial stop-loss area below the support line is touched, we should first exit or close most of the positions, and then gradually reduce the positions as the market continues to fall, until all positions are closed.
Therefore, the potential profit margin is above the support line, and the market's upward trend has not ended, so theoretically, the potential profit is unlimited. After entering the market and rising, we can hold the original position while waiting for the rise, or gradually reduce the position based on the original position. We will move the stop-loss based on market developments. When the market goes as we expect, we should move the stop-loss close to the cost price or leave a certain margin below the support line. Moving the stop-loss continuously reduces the risk in the market, which is equivalent to locking in floating profits.
When the price rises again to a new support or resistance level but then starts to fall back, the area below this support or resistance is where positions should be reduced, and at this point, we should gradually close all positions. To summarize: First, we need to find a support resistance line at the cost price. When the price rises far from the cost line, we gradually add positions. Adding positions must be incremental, and when the price falls far from the cost line, we gradually reduce positions, which should also be incremental. Your position management technique must balance risk and return.
The six basic principles of position management:
First: Do not operate on full positions; always maintain a certain proportion of spare funds.
Second: Batch buying and selling, reducing risk, averaging costs, and amplifying profits. The advantage of buying in batches downward and selling in batches upward is that your average price is lower than others, resulting in higher profits.
Third: In a weak market, one should hold light positions; it is best not to exceed half a position in a bear market. In a strong market, moderate heavy positions can be taken, and in a bull market, it is suggested that the maximum position be 8 layers, leaving 20% for short-term or reserve funds for unexpected events.
Fourth: Adjust positions accordingly as market conditions change, appropriately adding and reducing positions.
Fifth: During a sluggish market, you can temporarily hold no positions and wait for opportunities.
Sixth: Change positions: Keep strong coins and sell weak coins.
The above 6 principles apply to both spot and contracts. If you still don’t understand, please read it carefully a few times; reviewing can help you learn and improve!
Next, let's talk about position management methods, which is batch operation.
Batch operation refers to the act of dividing the invested funds into segments, and performing operations such as building positions, adding positions, or reducing positions in batches. Batch operations can be completed in one day or over a period of time.
Why do these actions? Because the cryptocurrency market is unpredictable, with both rises and falls being likely events. No one can accurately predict short-term price fluctuations, so enough funds should be reserved to cope with unpredictable fluctuations.
If you operate on a full position without sufficient confidence, once the market changes in the opposite direction, it will lead to huge losses. Therefore, you can use the batch method to reduce the risk of full position investment, averaging costs, which is the basis for reducing costs and amplifying profits.
Next, let's discuss how to batch: Two types: equal division and non-equal division
First: Equal distribution, also known as the rectangle buying and selling method, refers to dividing funds into several equal parts and buying or selling in sequence, with the amount of money used for each buy or sell being the same. It usually uses 3 or 4 equal parts. For example, buy 30% first; if you start making a profit, buy another 30%. If you do not profit, refrain from using new funds for the time being. When the coin's price reaches a certain high point or the market changes, gradually reduce positions and sell.
Second: Non-equal distribution, referring to funds being divided into different proportions for buying or selling, such as 1:3:5, 1:2:3:4, 3:2:3, etc. The shapes produced based on proportions include diamond, rectangle, hourglass, etc., with the commonly used being the pyramid-shaped buying and selling method.
Third: Equal funds, equal positions, using different methods for comparison.
Pyramid: Buy 5 layers at 1000, buy 3 layers at 1100, buy 1 layer at 1200, average price 1055
Inverse pyramid: Buy 1 layer at 1000, buy 3 layers at 1100, buy 5 layers at 1200, average price 1144
Equal division rectangle: Buy 3 layers at 1000, buy 3 layers at 1100, buy 3 layers at 1200, average price 1100
When the price rises to 1200, profits are respectively: pyramid 145, inverse pyramid 56, rectangle 100. When the price drops to 1000, losses are respectively: pyramid +55, inverse pyramid -144, rectangle -100.
From the comparison, it can be seen that the pyramid-shaped cost is the lowest, and profits are greater when prices rise. When prices fall, the risk is higher.
In contrast, the inverse pyramid means that if the price drops to 1000, the inverse pyramid loses 144. In practical application, it is more reasonable to use the regular pyramid method for buying and the inverse pyramid method for selling.
After a significant drop in coin price, if we see a bottom but are uncertain whether it has reached the bottom, we can use the pyramid building method to buy. If we buy at this time, we fear a continuous drop causing us to be trapped; if we don’t buy, we worry about missing out on a market reversal and rise.
For example, if a certain coin falls to 10U, buy in at 20% position, and if the price falls to 8U, enter another 30%. At this point, the average cost is 8.6U. If the market continues to fall to 5U, enter another 40%, average being 6.5U.
If the price rebounds to 6.5U, it is considered breaking even. If it rebounds to 10U, that means a profit of 3.5U. However, if you buy in full at 10U, when the price returns to 10U, you are just breaking even.
When the price rises, the lower the price, the larger the position should be; as the price gradually increases, the position should gradually decrease. This method of buying falls under right-sided position building. This cost is relatively safe; even if the market drops, as long as it does not fall below the holding cost, there is no need to panic.
This method requires a heavier initial position, so the requirements for first-time entries are relatively high; it is suitable for technical players.
The inverse pyramid selling method, in contrast to the regular pyramid, has a wider upper section that narrows towards the bottom, resembling a funnel. When the coin price rises, gradually reduce the number of coins held, meaning the amount of coins sold increases as the price rises. This is the method for reducing or clearing positions.
The core of position management consists of the above points. Once you understand them, I believe that in the future, whether building positions in spot trading or contracts, you will have a clear direction.
If you can see this, then I believe you are definitely a loyal fan of the cryptocurrency circle!
Now let's get into practical teaching! (The following text will use simple language, in case you find it hard to understand!)
Spot position management
Example: If you have 100,000U, you should divide it into ten parts! Prepare to buy ten coins! Allocate 10,000U for each coin! Each entry should be the same amount of money!
Example: Building a position in XX currency, 50% position at XX price, and supplementing 50% position at XX price. The 50% position means allocating 10000U per currency, building a position with 5000U and reserving 5000U for supplementation.
A major taboo in spot trading is to heavily invest in coins you are confident in, and lightly invest in those you are not.
This coin is good, so I’ll buy a little more, let’s say 30,000U.
This coin is average, I’ll buy 10,000U.
When operating, you should buy the same amount for each coin, strictly following the examples above! If you don’t follow this position, a problem will occur: if the coin you bought heavily with 30,000U loses 10%, that's 3,000U. However, if the coin you bought lightly with 10,000U rises by 10%, that's only 1,000U, and you’re still at a loss!
Contract position management
ETH's position allocation is calculated by quantity!
The maximum position for a 1000u principal cannot exceed 5
The maximum position for a 3000u principal cannot exceed 10
The maximum position for a 5000u principal cannot exceed 20
The maximum position for a 10000u principal cannot exceed 30
The maximum position for a 30000u principal cannot exceed 50
The maximum position for a 50000u principal cannot exceed 100, with position allocation calculated by quantity!
The maximum position for a 1000u principal cannot exceed 0.5
The maximum position for a 3000u principal cannot exceed 1
The maximum position for a 5000u principal cannot exceed 2
The maximum position for a 10000u principal cannot exceed 3
The maximum position for a 30000u principal cannot exceed 5
The maximum position for a 50000u principal cannot exceed 10
Contracts are actually the same as spot trading, with the same initial capital for each order and the same number of orders each time. This way, you can follow the orders in the contract group smoothly! Take profits when needed, cut losses when needed, treat yourself as a trading machine!
Brother Sheng has been navigating the market for over 10 years, well aware of the opportunities and traps within. If you are not doing well in investments and feel unwilling to accept losses, leave a comment with 999 without trying.


