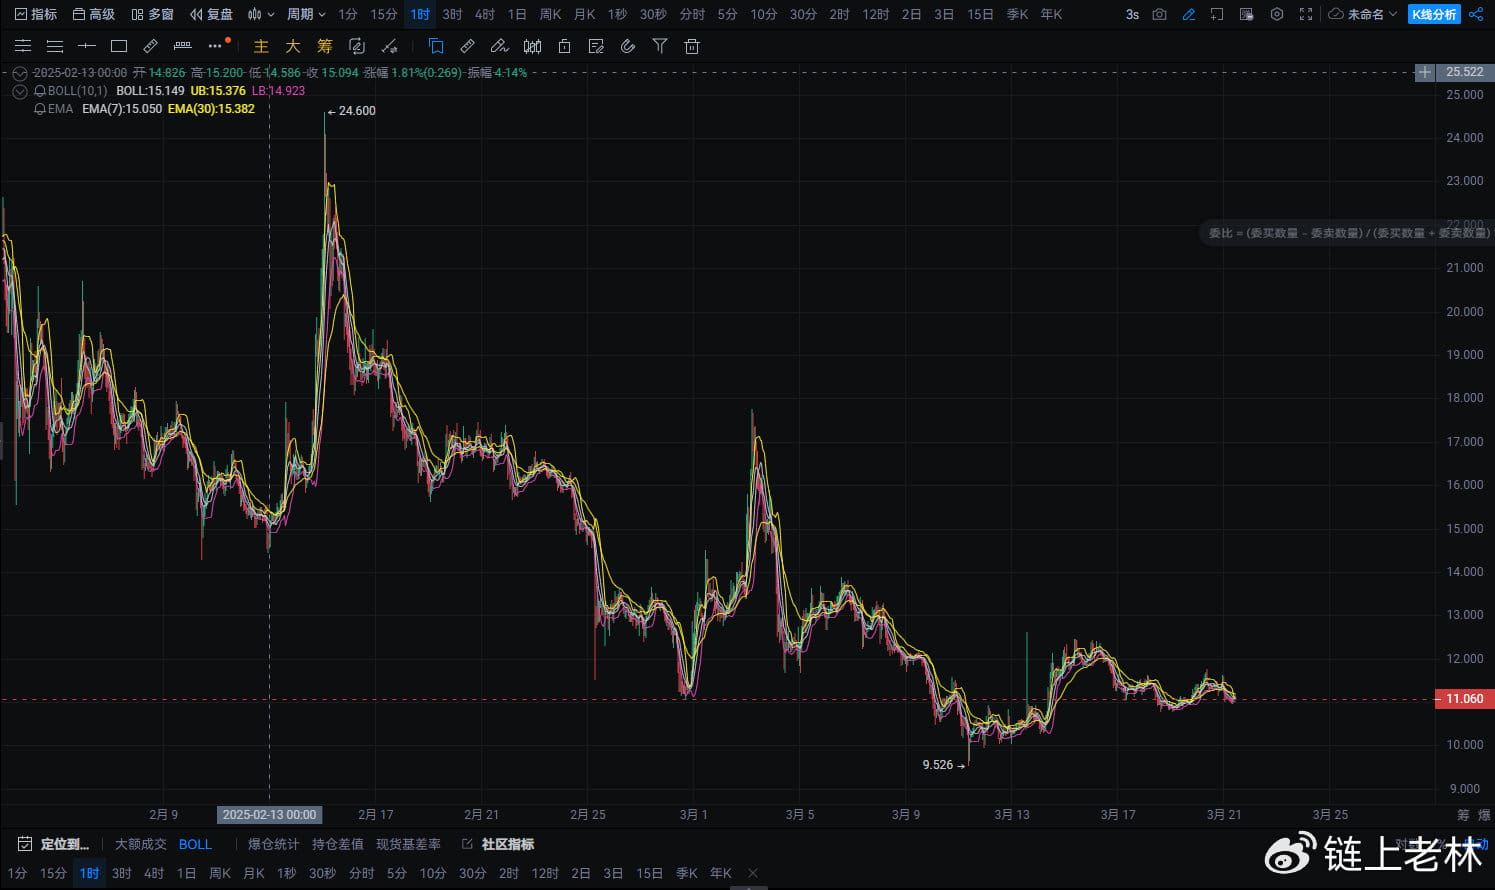
Yesterday's TRUMP trend continued to show a fluctuating downward structure, with the price touching a low of 9.526, followed by a slight rebound. It is currently maintaining a range of 11.060-11.069. Since February 13, the overall trend has shown a descending channel, with some local rebounds, but it has never effectively broken through the moving average suppression.
Technical analysis
Moving Average (EMA) suppression: Current EMA7 (short-term moving average) and EMA30 (medium-term moving average) show a bearish arrangement, and the short-term trend remains weak. If the price cannot effectively break through EMA30, it may continue to decline in the short term.
Bollinger Bands (BOLL): The current TRUMP price is running near the lower Bollinger Band. A short-term rebound correction is expected, but the overall trend has not changed, and the opening direction of the Bollinger Band still points downward.
Trading volume: The volume performance is relatively sluggish, with neither bulls nor bears showing significant advantage, indicating that the market is still in a wait-and-see phase.

Support and resistance levels:
First support level: around 10.500 (if broken, it may test yesterday's low of 9.526)
Second support level: 9.500 (short-term extreme support)
First resistance level: 11.500 (if broken, it can further look towards 12.000)
Second resistance level: 12.800 (strong resistance, breaking this level is needed to reverse the downward trend)
Today's operational advice
Short-term strategy:
If the price stabilizes after a pullback to the 11 range, consider entering with a light position, targeting 11.4-11.8, with a stop loss below 10.6.
#美SEC澄清PoW挖矿监管立场 #TRUMP #特朗普数字资产峰会演讲 #美联储3月利率决议 #美SEC将放弃对Ripple的上诉

