GM☀️ Good morning! I am Oupeng, today is 2025/03/19, and we are going to discuss the trend of TRX. As usual, let's first share today's buy and sell points, then analyze the current market situation in detail for your reference.
Today's Buy and Sell Points
Buy Point One: 0.225
Reason: Price retraced to the previous support level, close to the EMA7 moving average, with active buying, likely to stabilize and rebound.
Buy Point Two: 0.222
Reason: Further pullback to the previous wave low, forming strong support, increasing safety margin.
Long Stop Loss Point: 0.220
Reason: If the price breaks below the previous low, it indicates weakening support, and the market trend may reverse, requiring decisive stop loss.
Sell Point One: 0.245
Reason: Price approaches recent highs, there is a risk of selling pressure, suitable for taking profits in batches or going short.
Sell Point Two: 0.250
Reason: After breaking through the integer barrier, there may be temporary profit-taking pressure, with evident market selling pressure.
Short Stop Loss Point: 0.252
Reason: If the price continues to rise and breaks through Sell Point Two, it indicates strengthening bullish power, and the short strategy needs to stop loss in time.
Next, let's look at the K-line and three commonly used indicators to see what information we can gather:
1. K-line Patterns
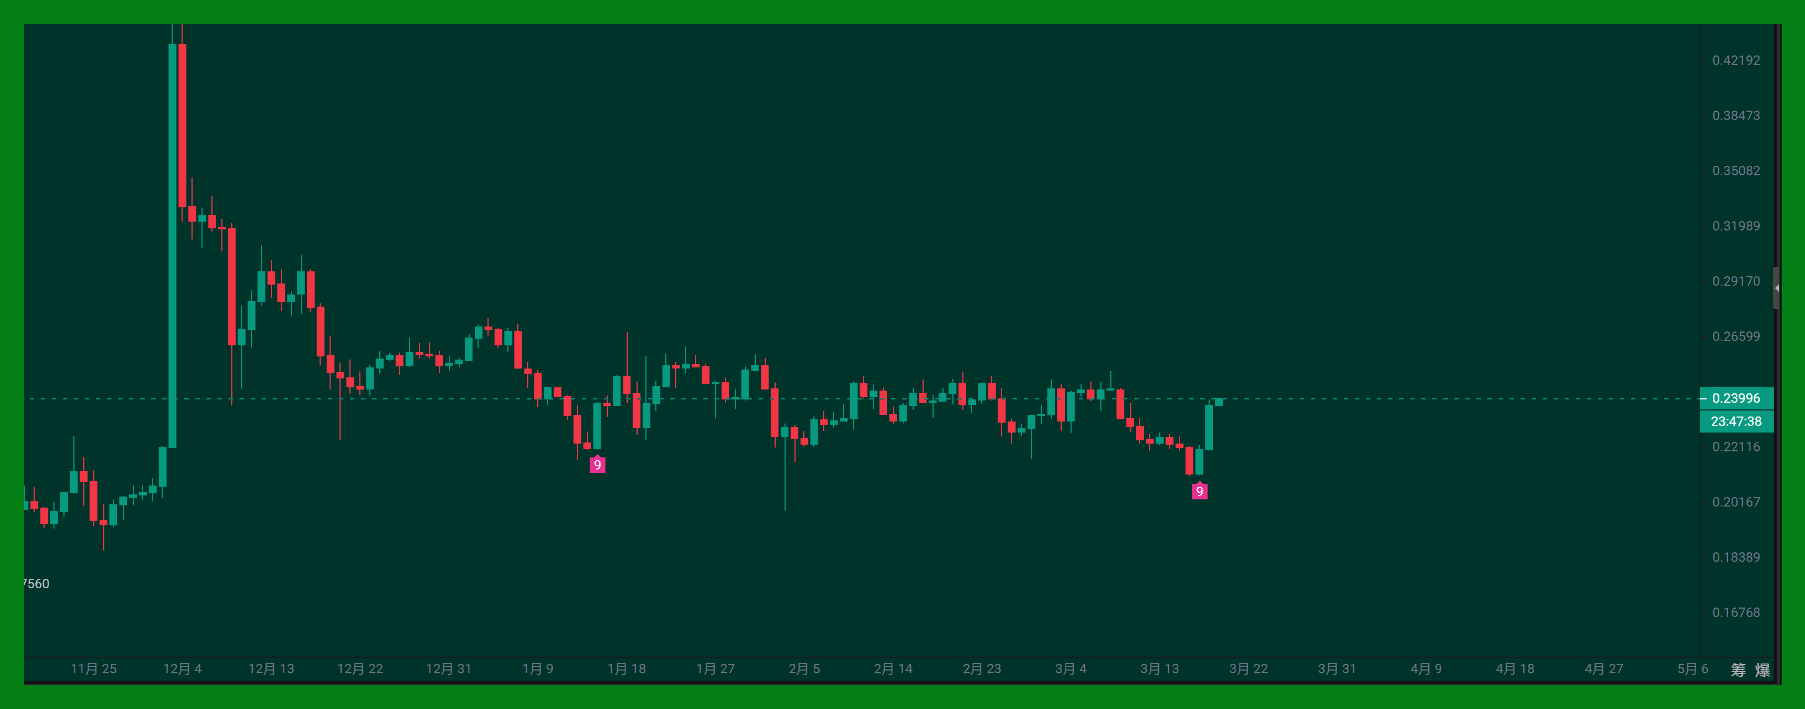
In recent days, the K-line of TRX shows a clear upward trend, especially the large bullish line on March 18 successfully broke through the previous high, releasing a strong signal.
Recently, the price has fluctuated between 0.2207 and 0.2394, forming a relatively stable upward channel, laying the foundation for subsequent attacks.
2. Technical Indicators
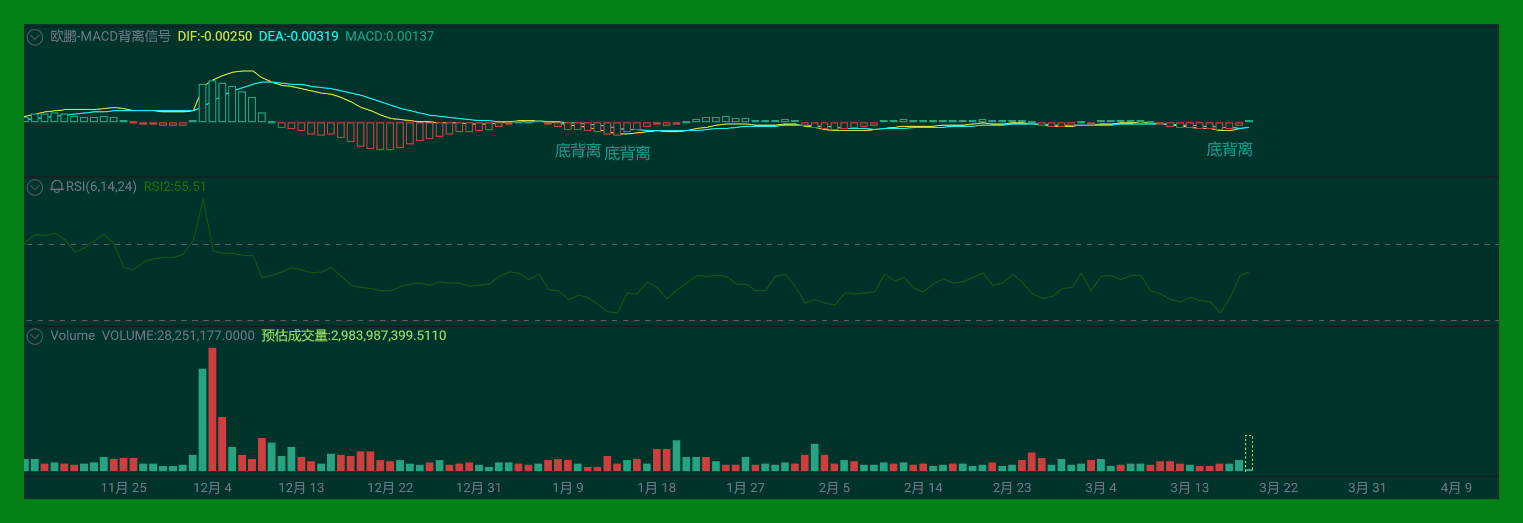
MACD: The current MACD value is close to the zero axis, and the DIF and DEA are gradually converging, indicating that bullish power is strengthening, and further rises are expected in the short term.
RSI: RSI has rebounded from the oversold zone, currently at 53.49, indicating market sentiment is optimistic, but has not yet entered the overbought zone, leaving room for upward movement.
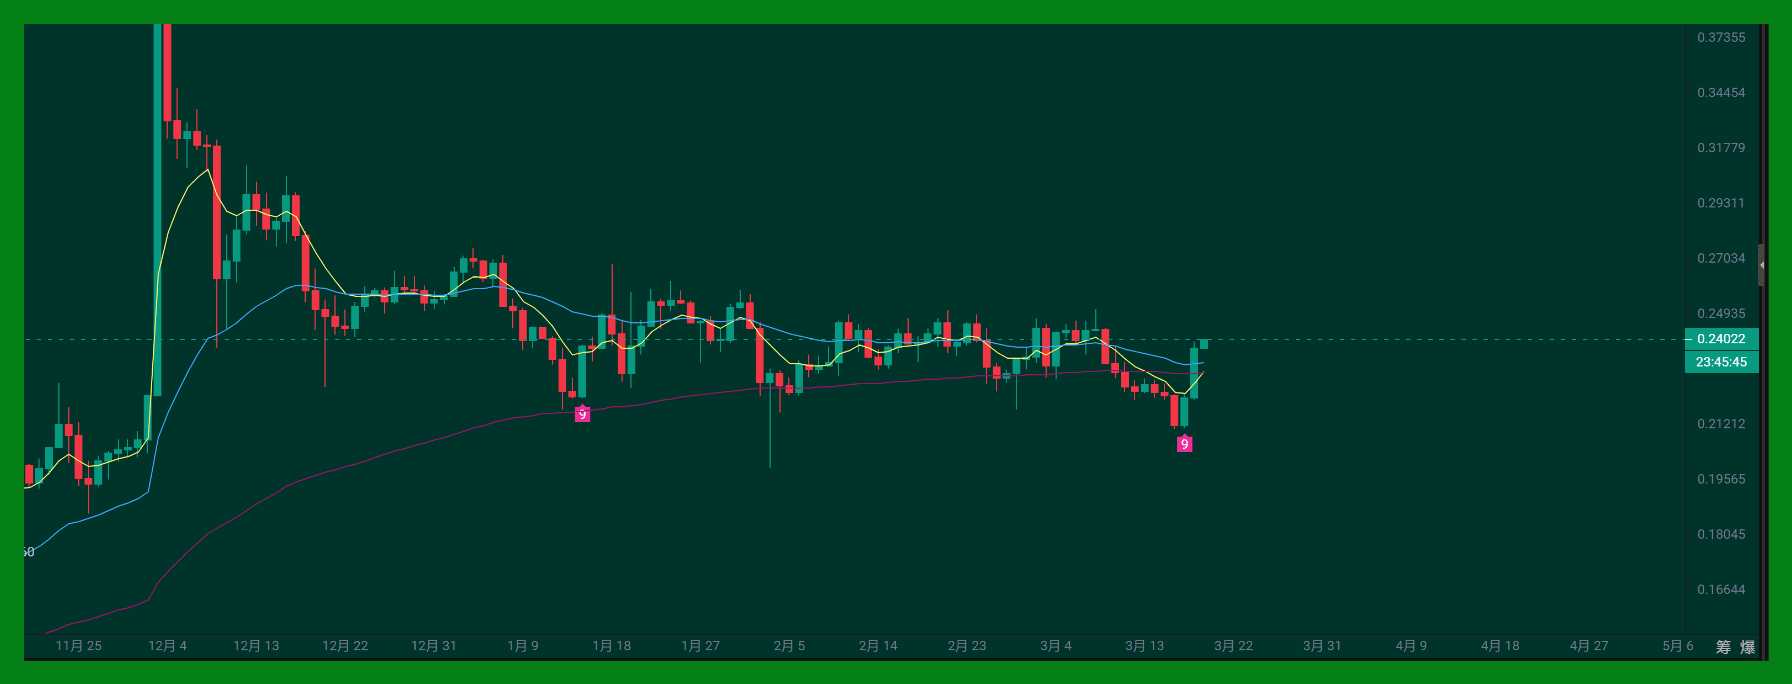
EMA: Short-term EMA(7) has crossed above mid-term EMA(30) and EMA(120), showing strong upward momentum, providing strong support for the market.
3. Trading Volume Situation
On March 18, trading volume significantly increased to 671,888,948, indicating active capital inflow, supporting price increases.
In the past few days, trading volume has remained relatively stable, increasing with the rise in prices, indicating improved market participation, which provides momentum for the bullish trend.
Personal suggestion (just personal thoughts 💡 please consider your own trading style)
Currently, TRX shows a clear upward trend, with technical indicators strengthening overall and bullish power gradually increasing. The significant increase in trading volume also confirms active capital involvement. It is recommended to accumulate positions at low levels in the range of 0.225 and 0.222, with strict stop loss set at 0.220 to guard against short-term market fluctuations.
During the price rise, it is recommended to take profits in batches or to layout short positions in the range of 0.245 to 0.250, to guard against short-term profit-taking risks, with stop loss set at 0.252 to avoid sudden reversal risks. Stay cautious, set strict stop losses, capture confirmed upward signals in the market, and stable operation is key.
(Strategy represents personal views only, for reference only; the market has risks, and all-in can lead to liquidation!)
Finally, don't forget to follow and like! Wishing you and me abundant fortune in 2025!
If you have favorite tokens you want to know about, feel free to leave a comment below 👇 I will reply one by one after seeing it, let's communicate and progress together. Hope you have good gains today! Bye~
Ten minutes a day, trading is simple!