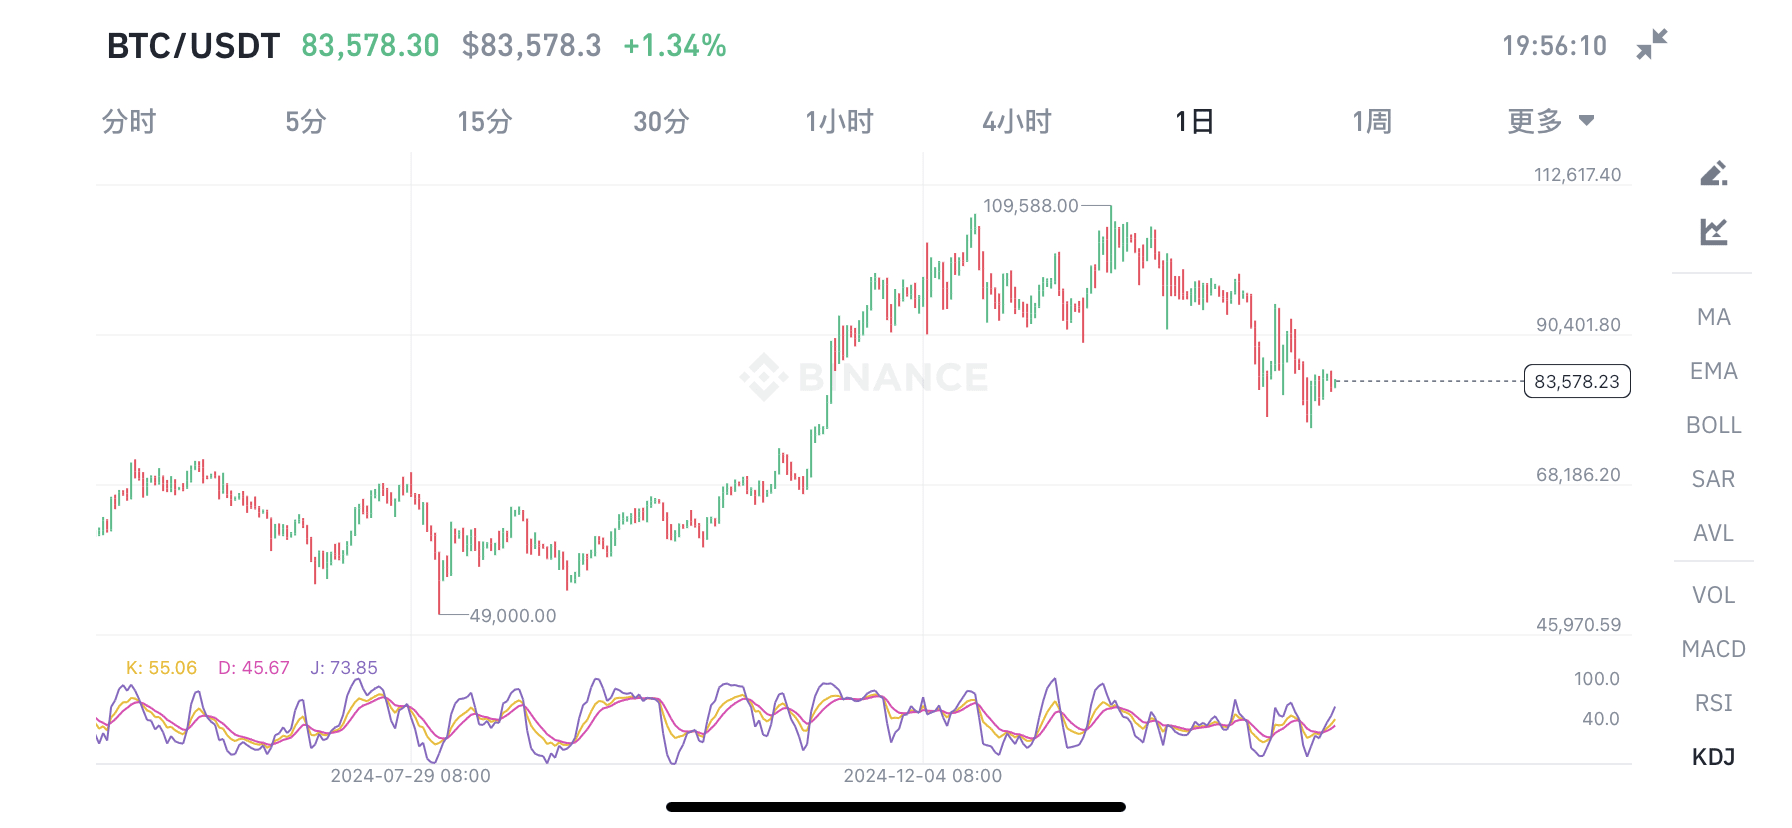
The market changes rapidly, and trading is all about the present. Whatever mountain you reach, you sing whatever song. Currently, the Bitcoin price is over $83,000. Does the golden cross that appeared at the daily level below Bitcoin continue its rebound momentum? Or will it plunge to a position it does not belong to? When exactly will this wave end? The Bitcoin price has been in a declining channel at the daily level, showing little change. However, fortunately, a golden cross has formed below the zero line. In the past, every time a golden cross formed, there was a decent small rebound, but the strength of such rebounds has indeed been limited, and there has not been a significantly strong upward trend.
Many friends do not believe that the Bitcoin market cannot rise again, but from both a historical and data perspective, the Bitcoin bull market has not ended. It has only been 11 months since the last halving, and generally, it takes 12-18 months to reach the peak after a Bitcoin halving. Therefore, based on the timeline, I believe this wave is not over yet. Moreover, the market cap of stablecoins is gradually increasing and is now close to breaking the $210 billion level. Recently, Bitcoin spot ETFs have seen continuous outflows for more than ten days, which is a very bad signal. Fortunately, there hasn’t been a significant outflow, with the biggest pain point during the day being $83,500, which is also the current maintenance level. The balance on exchanges has shown a steady decrease, and the liquidation map for exchanges indicates a liquidation position in the $82,000 to $85,000 range, still fluctuating within this range over the past two days. On August 20, there will be a dot plot, so we will operate around the dot plot for this wave. The Bitcoin rainbow chart is slowly approaching its bubble state, and we are still considering buying at this stage. $63,000 is a major sell-off zone; if it drops to $63,000, it is rare. Therefore, I believe that $70,000 should be its bottom state. However, is there a possibility of forming a daily double bottom pattern? That is also possible. Maintaining at the $83,500 position for so long will inevitably lead to endless panic if it drops a little further, unless there is significant selling pressure if miners continue to sell. However, currently, miners have not changed much and are even mining frantically. The greatest volatility comes from short-term traders whose back-and-forth trading actions have indeed affected Bitcoin's fluctuations. Compared to long-term holders, their numbers are still very, very small. We need to see if long-term holders show any signs of distributing Bitcoin. If Bitcoin is distributed, we need to pay close attention to whether it moves on exchanges during this market wave.
Currently, many traders are borrowing to short Ethereum. The exchange rate between Ethereum and Bitcoin is such that even Ethereum dogs don't pay attention to it. Many people choose to short, but if you choose to short, you are in great danger. Currently, it has entered a very extreme market condition. Once Ethereum rebounds to $4,000, many people will definitely face liquidation. Currently, I see that there are many contract pain points for Ethereum with liquidation positions around $2,500, which is close to $2 billion. This year, there will definitely be two interest rate cuts. Between June and September, there may be actions to lower interest rates. Therefore, we cannot rule out the possibility of a market crash in May. If May triggers a huge market movement, we will see a significant market change. If there is no movement in May, we will face a stagnation state, meaning this wave will be completely over. That's all for today.#比特币行情走势分析