Reversal signals help identify moments when the trend may change. They are divided into candlestick, technical, and volume signals.
1. Candlestick reversal signals
These patterns show the weakening of the current trend:
• Pin Bar – a long shadow (wick) and a small body of the candle indicate rejection of the level.

• Hammer / Hanging Man – long lower wick, body at the top. In a bullish trend (hanging man) – a signal to short.

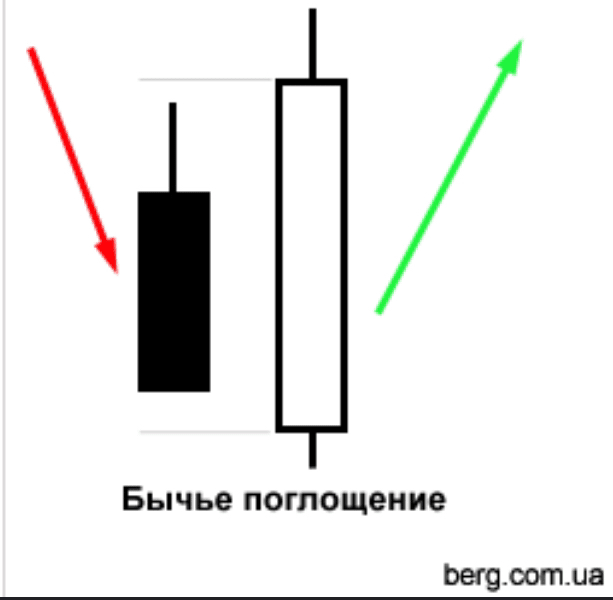
• Engulfing – a bearish candle completely closes the body of the previous bullish candle.
• Doji (Doji) – small body and long shadows (signal of indecision, possible reversal).
• Star (Evening/Morning Star) – a candlestick combination where first there is a strong trend candle, then a small neutral one, and then a strong candle in the opposite direction.

$BTC #Signal🚥. #SignalAlert #signalsfutures
2. Technical reversal signals
Indicators and graphic figures:
• RSI/MACD divergence – if the price updates a high, but the indicator does not update (bearish divergence), a downward reversal is likely.
• Bollinger Bands – if the price breaks above the upper boundary and cannot hold, a decline is possible.
• Trend lines – a break of support in an upward trend – a signal to short.
• Reversal patterns:
• Double Top – two resistance points, a break of the neck downwards – a signal to short.
• Head & Shoulders – a similar pattern where the middle peak is higher than the other two.
• Wedge – if an ascending wedge breaks down, it is a signal to short.
3. Volume reversal signals
Market profile, clusters, and volume delta are used:
• Abnormal volume – if large volumes form on the rise but the price does not go higher – a downward reversal is likely.
• Sales clusters at highs – large sales near resistance levels.
• Volume delta (impulse change) – if a strong negative delta appears during a rise, it means that market makers are closing longs and entering shorts.
How to apply?
To enter a short, it is best to combine several factors:
✔ The price has broken above the upper boundary of Bollinger Bands + weakness in the form of a doji or pin bar.
✔ There are many sales on clusters, and the price cannot break the level.
✔ MACD or RSI show divergence.
✔ A 'double top' or 'head and shoulders' pattern appears.
