In Price Action (PA, naked K) trading, the pin bar is a very important entry signal, also known as a Rejection Candle, and is usually a candlestick pattern that indicates a price reversal.
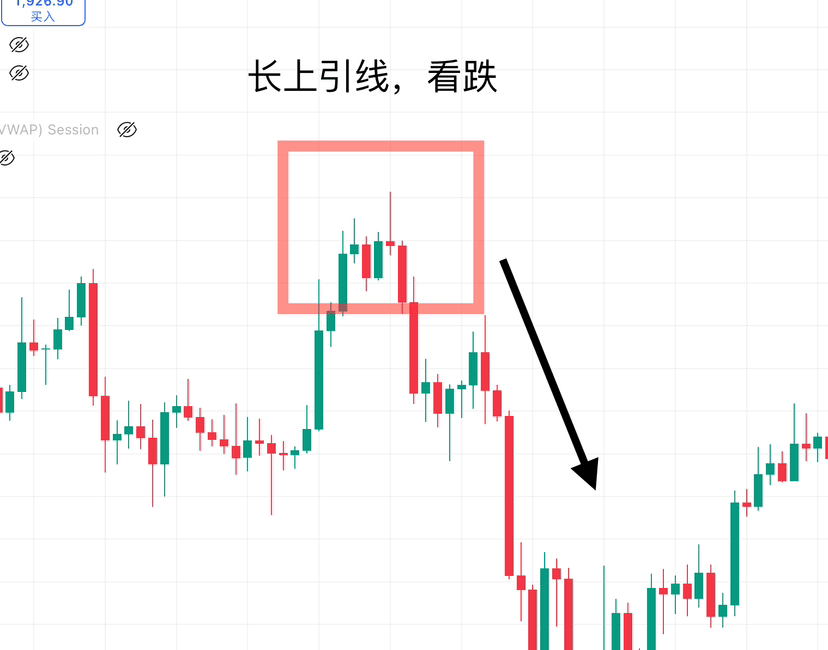
The formation of a Rejection Candle occurs when the price is strongly supported or suppressed at a certain position, resulting in a very small body but large shadows of the candlestick, including hammer and inverted hammer patterns, which are referred to as 'Pinocchio Back Bar', abbreviated as 'pin bar'.
In trading practice, we need to pay attention to the fact that a pin bar with a long lower shadow is a buy signal; one with a long upper shadow is a sell signal.
It is worth noting that not all pin bars can be referenced as trading signals.
So, under what circumstances can the pin bar serve as a necessary condition for an entry trading signal?
As mentioned above, the pin bar is usually a reversal signal that can help us find turning points in the market. If the pin bar appears at key support and resistance levels, at moving average positions in a trend, or at the upper and lower bounds of a consolidation range, or even on a trend line, it will have a very significant effect.
However, if the overall length of the pin bar is too short, it cannot be an effective trading signal. The best pin bar trading signals have a candlestick body of sufficient length (indicating strong buying or selling power that attracts market capital) and appear at the key positions mentioned above in a robust trending market.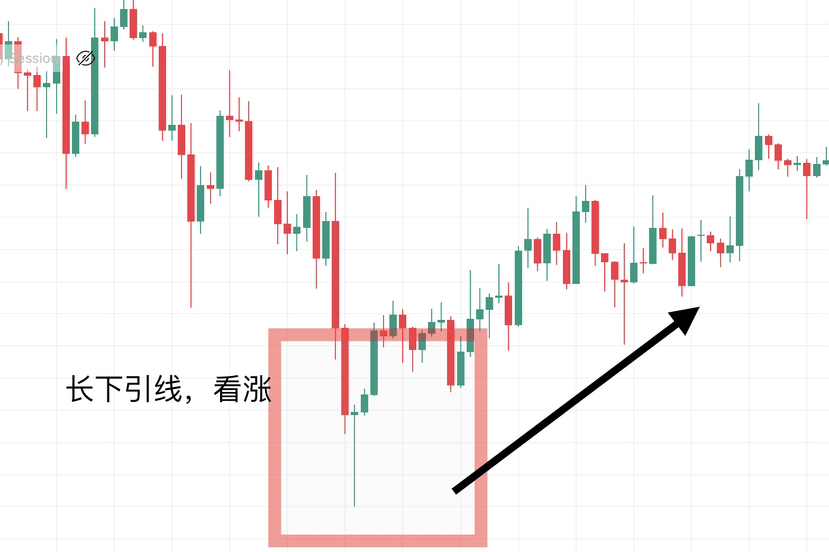
Moreover, using pin bars in conjunction with other indicators is more effective.
Moving Average System: Moving averages can reflect the direction of the market trend and support/resistance levels. If a pin bar appears near a moving average and aligns with the direction of the moving average, the reliability of its reversal signal is higher.
Fibonacci Retracement: Fibonacci retracement can determine potential support/resistance levels in the market. If a pin bar appears at key positions of the Fibonacci retracement, such as 0.618, 0.786, etc., the value of its reversal signal is also higher.
Volume Indicator: Changes in volume can reflect market activity and participation. If the volume significantly increases when a pin bar forms, it indicates that market participants are paying high attention to that price range, and the reliability of the reversal signal is also higher.