🔥 BTC Analysis – Detached from emotion, a typical analysis
🔹 First point: A lower high than the previous high
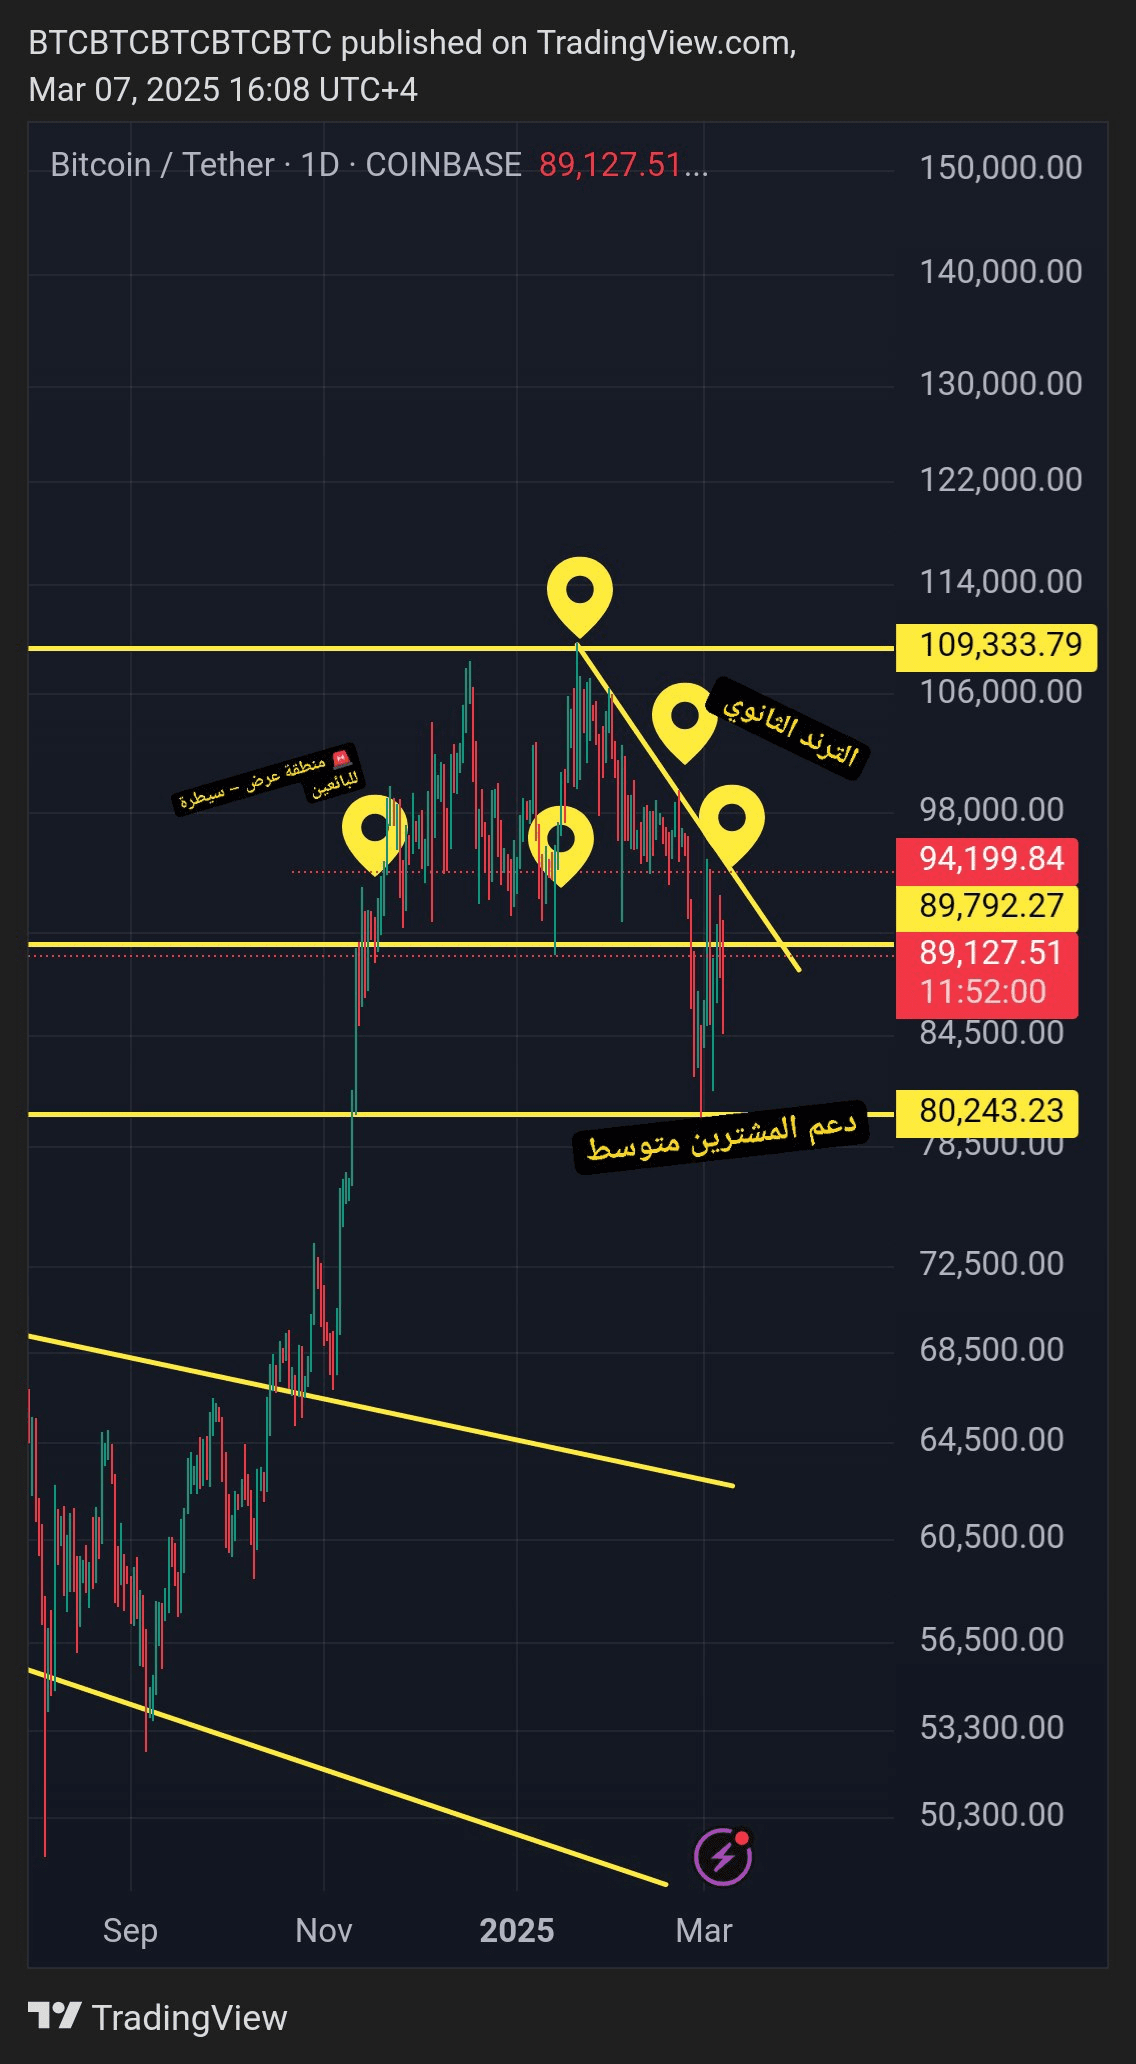
📉 Bitcoin made a lower high than the previous high – the chart in front of you shows that.
🔹 Second point: The secondary trend
So far, Bitcoin has not broken the secondary trend to better confirm the rise. If we want a strong upward movement, we need to break the secondary trend on the daily timeframe.
🔹 Third point: Seller control areas
📌 Sellers are completely in control of the following prices:
✅ $109,000 → $105,000
✅ $98,500
✅ And now they controlled $93,000
🧐 If you understand this point, you will easily realize where the supports and resistances lie!
🔹 Fourth point: Moving averages
📉 Bitcoin has broken the moving average on the daily and 3-day timeframe, but on the weekly timeframe, the breakout remains uncertain.
🔥 The price is currently moving below the moving averages, indicating weakness in the upward trend.
---
🚀 When does the rise start? 🤔
🔺 Simply put, if buyers regain control of $93,000 with a clear correction, Bitcoin will start forming a higher low to confirm the upward trend.
🔺 If the secondary trend breaks on the daily timeframe with a successful close and retest,
📈 Bitcoin will break the moving averages and the trend will be positive.
---
💡 How can we benefit from the analysis?
📍 The areas of $78,250 - $83,000 are considered medium strength support for buyers.
🎯 When the price reaches these areas, we can buy provided a buying pattern appears on the hourly timeframe ⏳
🔍 Best strategy:
When sellers are in complete control, that's when the real war between buyers and sellers happens – I will explain this analysis to you later because it's very interesting! 🚀
😂 Final note:
I am in a short position, I sold 70% at $78,000, and the remaining 30% I will hold until it reverses... Hahahaha! 😆
#TrendingTopic #NFPCryptoImpact
