Sharing the current market analysis.
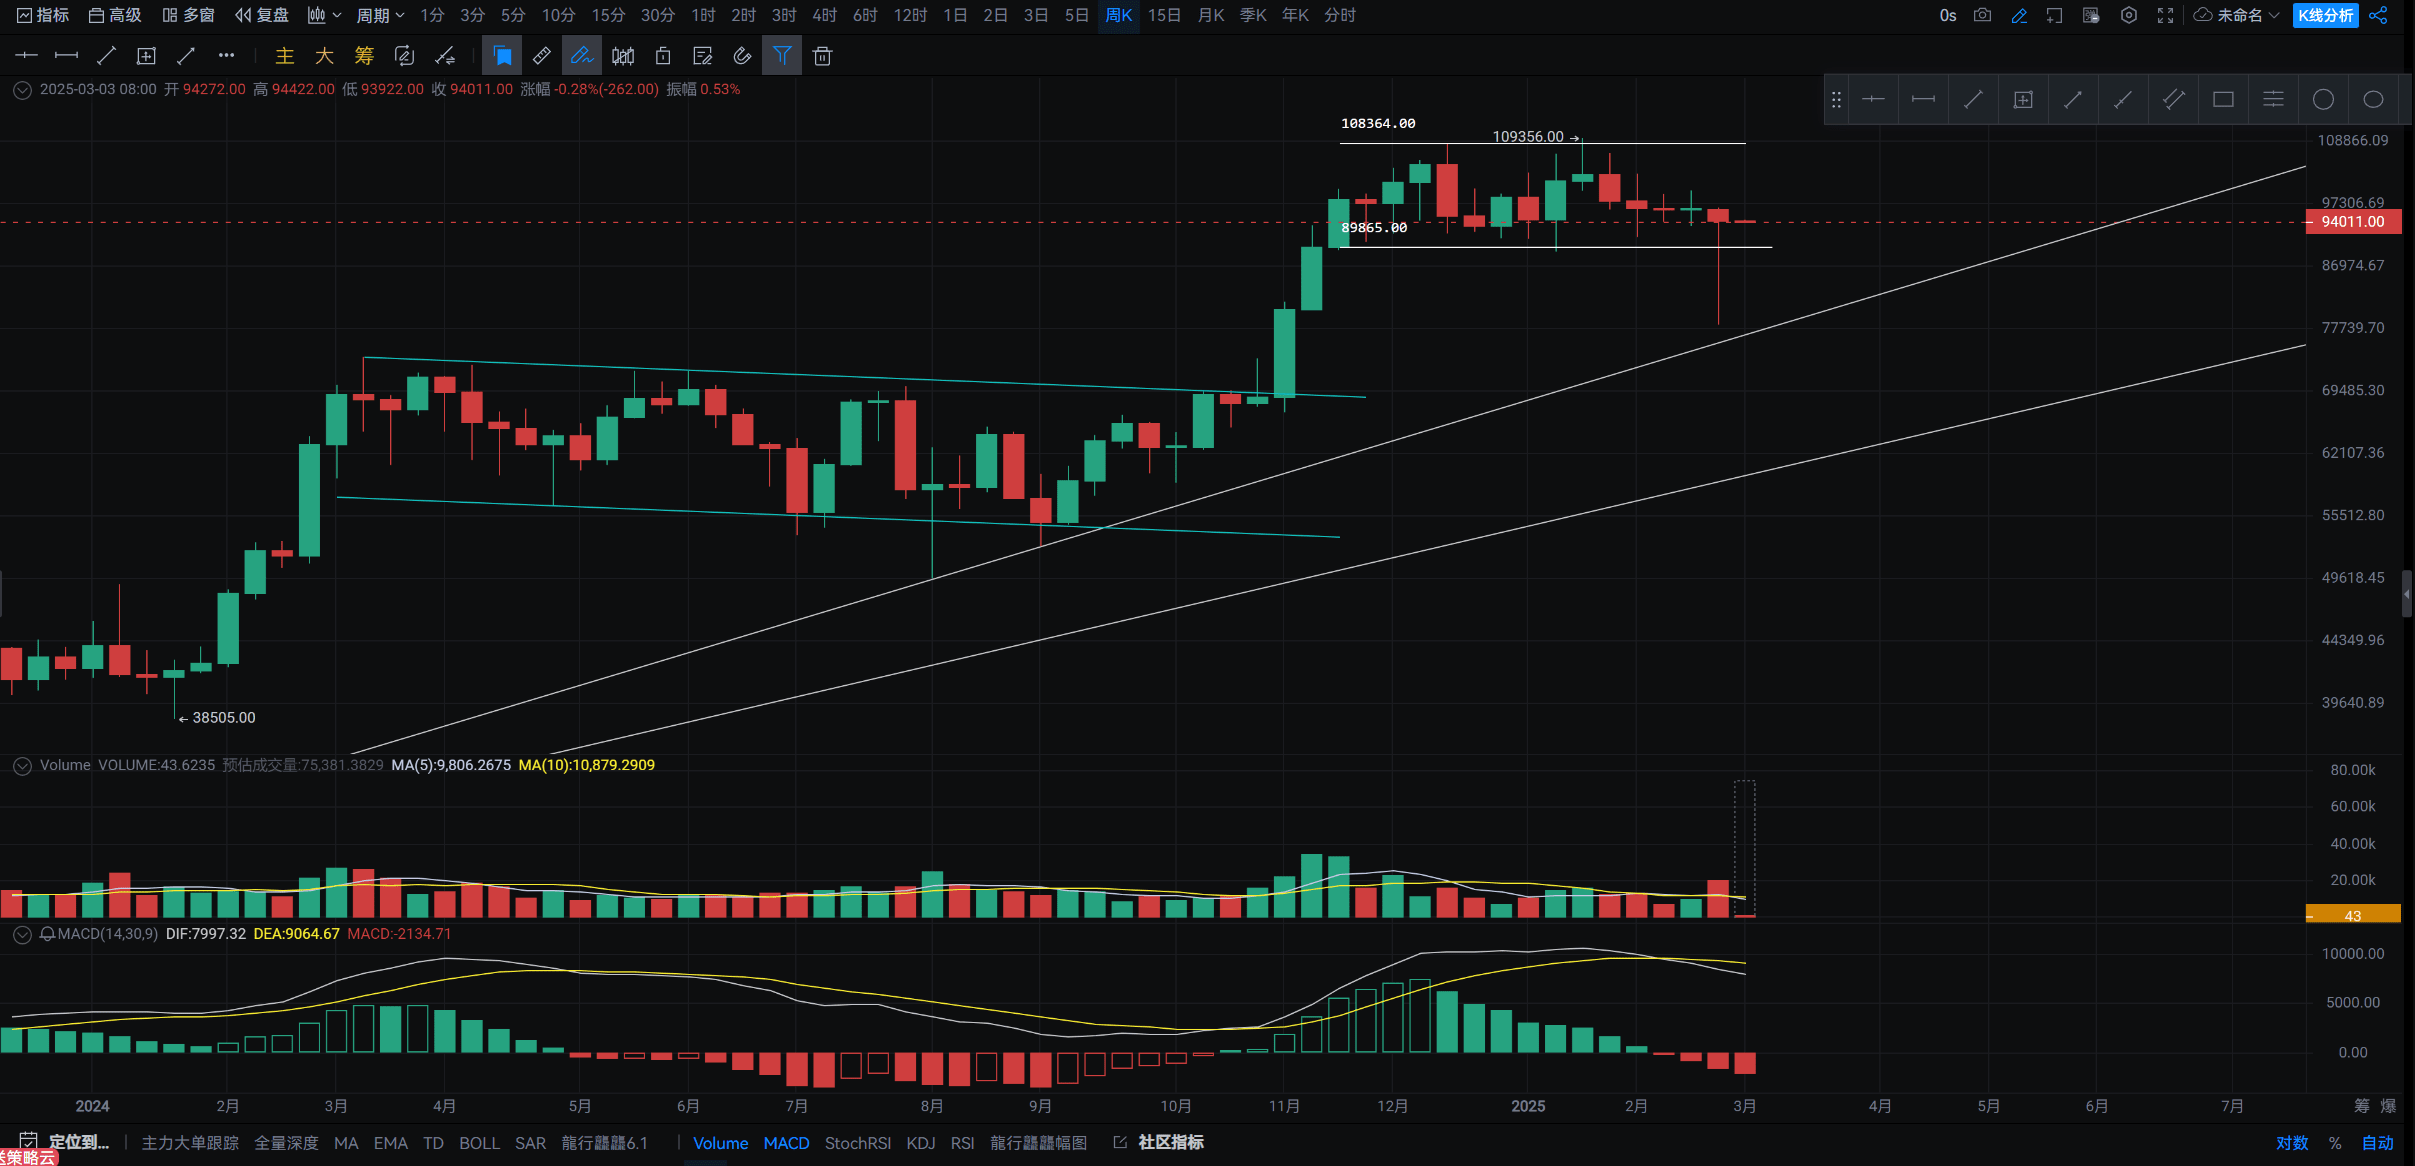
Weekly chart:
Last week closed with a large-volume bearish hammer line, indicating a bottoming signal, suggesting that the market is about to change. The long lower shadow indicates strong buying below, with the needle piercing above the long-term upward trend line on the weekly chart, but it quickly pulled back, cleaning up a lot of leverage, returning to the oscillation range, indicating a false breakdown and inducing short positions. It has returned to consolidate above 90,000, and if it continues to hold above 90,000, it will enhance the probability of stopping the decline. We will observe whether a bullish signal appears again during this period.
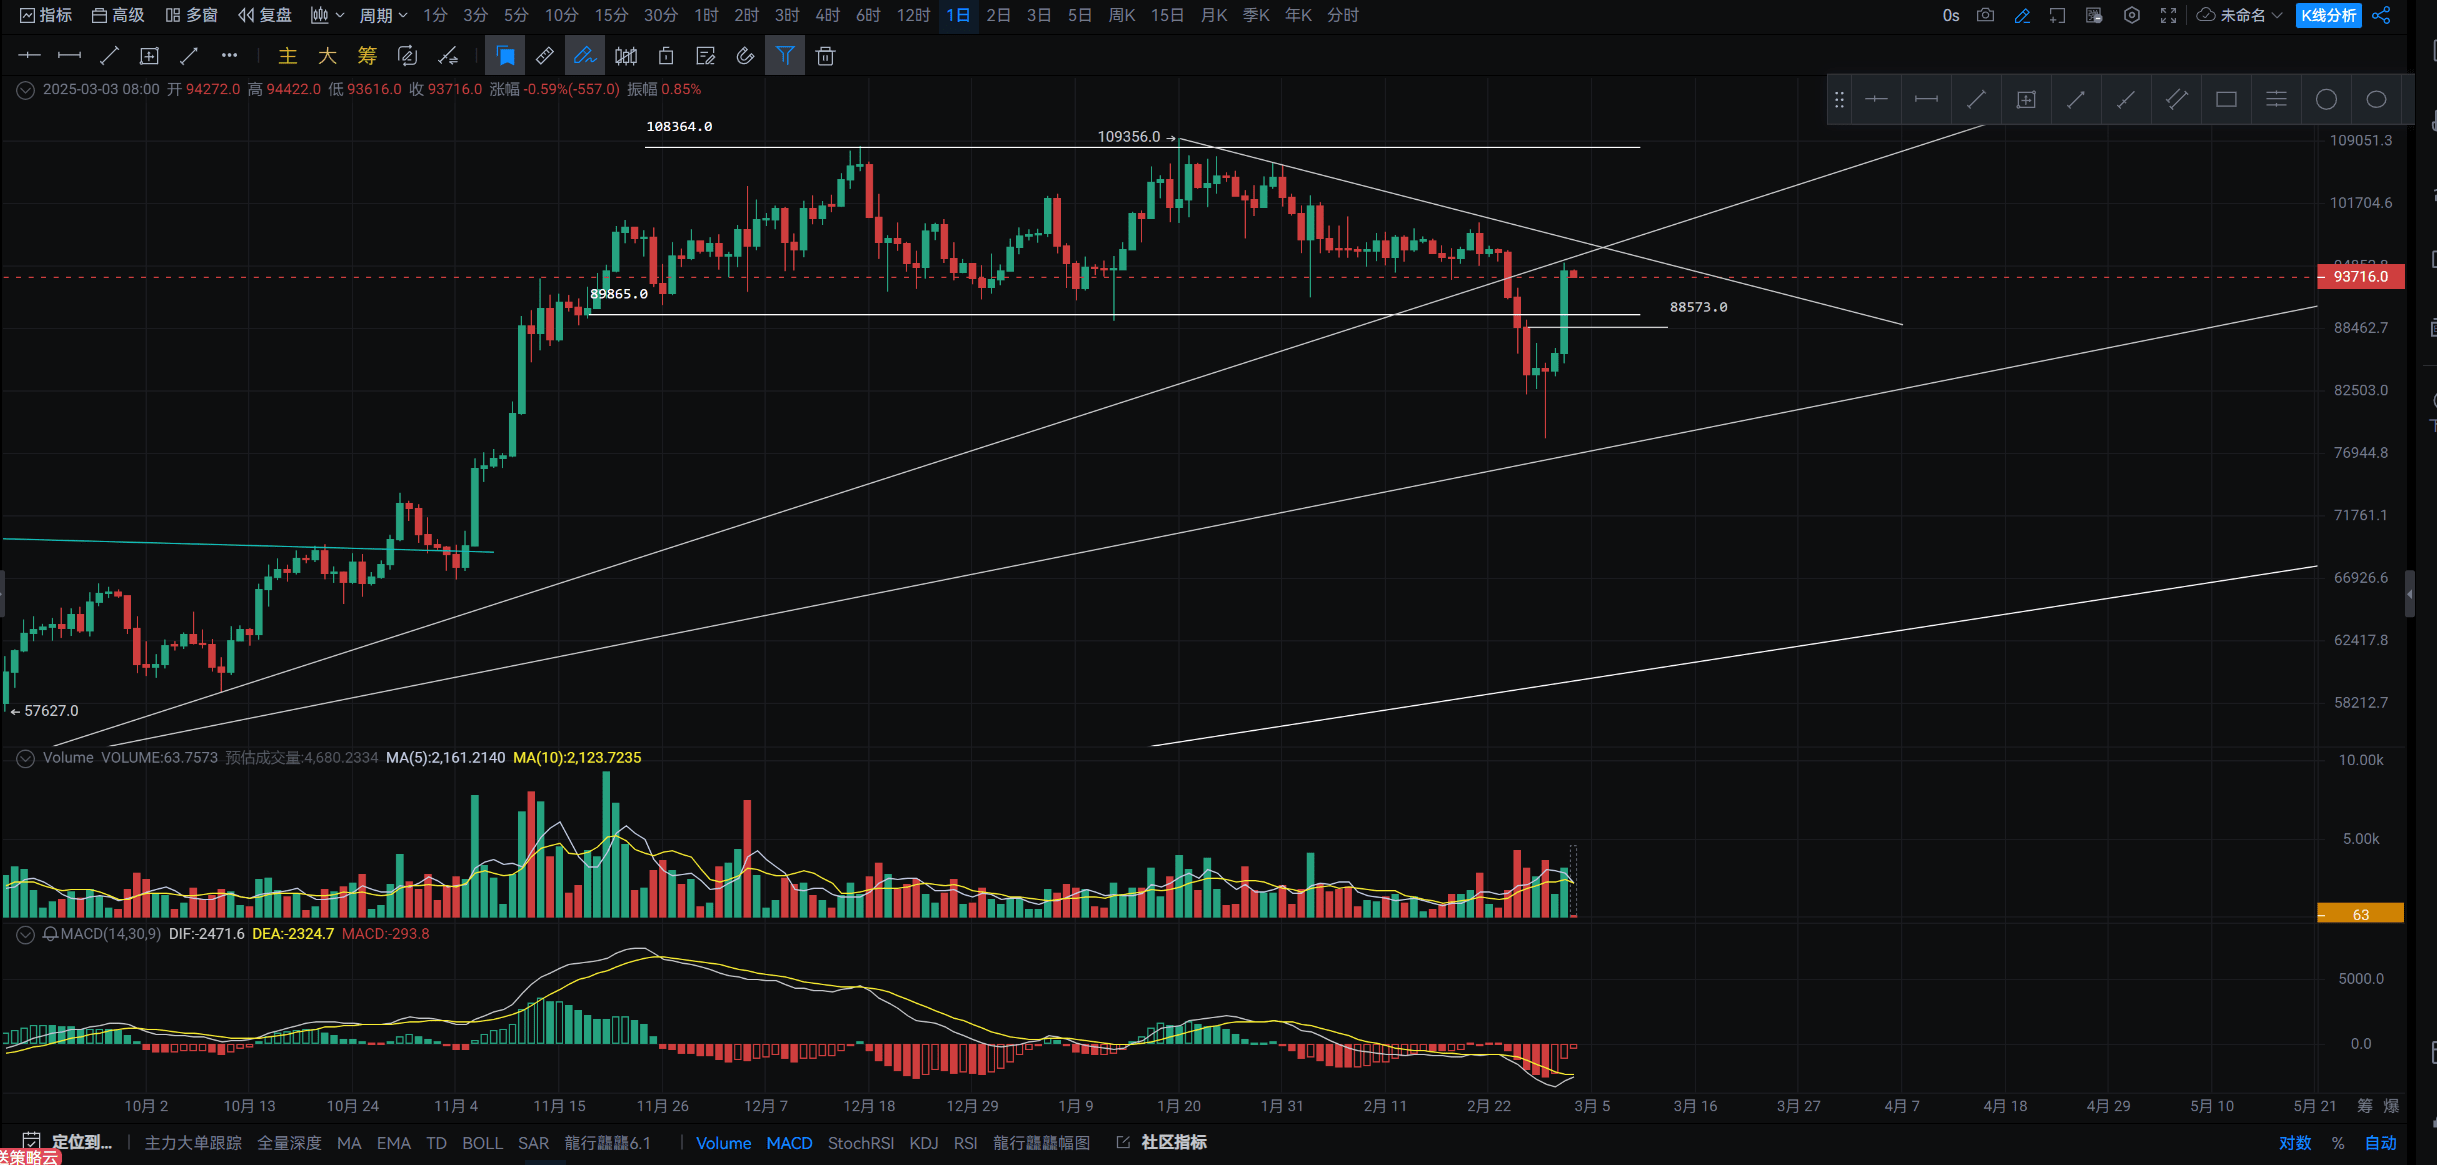
Daily chart:
Since the volume breakout below the recent daily upward trend line on February 24, the market attempted to probe above the long-term upward trend line on the weekly chart. On February 28, it closed with a large-volume bearish hammer line, indicating a bottoming signal, suggesting that the trend is about to undergo a significant change. This occurred at an important support level, enhancing the effectiveness of stopping the decline. Subsequently, a rebound was welcomed; this wave can be considered a false breakdown, cleaning up leverage + inducing short positions. After building a small tower bottom, it looks bullish as it breaks the neck line at 88573 with volume, returning to a larger oscillation range. Currently, it faces pressure from the recent downward trend line and the previously broken upward trend line, indicating strong pressure. There may be a need for a pullback; as long as it does not break below the neck line at 88573 during the pullback and shows a stop-loss signal near the neck line, the subsequent market outlook will be relatively optimistic.
Summary:
The background of the weekly chart is in the mid-stage of a bull market, currently in a consolidation phase after an uptrend. It attempted to test the support of the lower trend line and returned to operate within the oscillation range. We will observe whether a bullish signal appears at the end of this week.
The daily chart is in consolidation after an upward trend. Although it broke down from the oscillation range with increased volume, it quickly returned to the oscillation range. As long as it holds above 90,000 for a long time, the probability of stabilizing the market will be relatively high.
Last week's market was exciting. Due to macroeconomic expectations, a large amount of capital began to seek safety, while the Fear and Greed Index (FGI) dropped to 10. The last time it was this low was in June 2022, during a bear market. The saying 'When others are greedy, I am fearful; when others are fearful, I am greedy' remains true, making the 28th the best time to buy in terms of sentiment. This wave can only be described as a cleanup of leverage, targeted detonation of large holders, and a process of washing out retail investors to hand over their chips. Since the trends of Bitcoin and altcoins are still within a controllable range, there is no need to worry; just hold patiently.
