Solana’s (SOL) total value locked (TVL) fell to $9.90 billion, its lowest level since November 2024, before recovering slightly to $10.3 billion. Despite this recovery, SOL’s TVL is still down nearly 30% since January 18, reflecting lingering concerns about its ecosystem.
SOL price is also under pressure, down more than 8% in the past seven days and more than 31% in the past 30 days. Technical indicators show signs of recovery, but the downtrend remains dominant, with SOL trading below key resistance levels.
Solana's TVL hits lowest level since November 2024
Solana’s total value locked (TVL) is now at $10.3 billion, recovering from a low of $9.90 billion on February 17 – the lowest since November 14, 2024. Despite this recovery, TVL is still down nearly 30% from $14.2 billion on January 18, indicating waning investor confidence.

Solana TVL | Source: DeFiLlama.
The decline coincided with controversies surrounding the Solana ecosystem, including allegations of excessive value extraction and criticism surrounding the launch of the meme coin LIBRA, which caused capital to flow out of the ecosystem.
Tracking TVL is important because it represents the total amount of capital locked in a blockchain’s DeFi ecosystem, reflecting liquidity and investor confidence. While Solana’s TVL has recovered slightly, the sharp decline over the past month underscores ongoing concerns.
If these issues are not resolved, continued capital outflows could put pressure on SOL prices and slow the recovery. Conversely, if confidence is restored, a resurgence in TVL could signal renewed interest and support for SOL.
Solana Indicators Remain Negative But Recovering
Solana's Ichimoku Cloud chart shows that the price is currently below the red cloud, indicating that the downtrend is still dominant. However, the price is currently trading above the blue Tenkan-sen (conversion line) and the orange Kijun-sen (base line), indicating that the bearish momentum is weakening.

SOL/USDT 4-hour Ichimoku Cloud | Source: TradingView
This could signal a short-term recovery as buying pressure begins to pick up. However, the thick red cloud above still acts as a strong resistance level, which Solana needs to overcome to confirm an uptrend.
In this case, the fact that Solana is still below the red cloud suggests that the overall downtrend has not yet been reversed.
If the price can break above the cloud, it will be a strong bullish signal. Conversely, if it fails to break this resistance level, selling pressure may increase, prolonging the downtrend.
Solana's directional movement index (DMI) chart shows the average directional index (ADX) is now at 25.4, down from 43 just two days ago when SOL's price dropped to around $165.
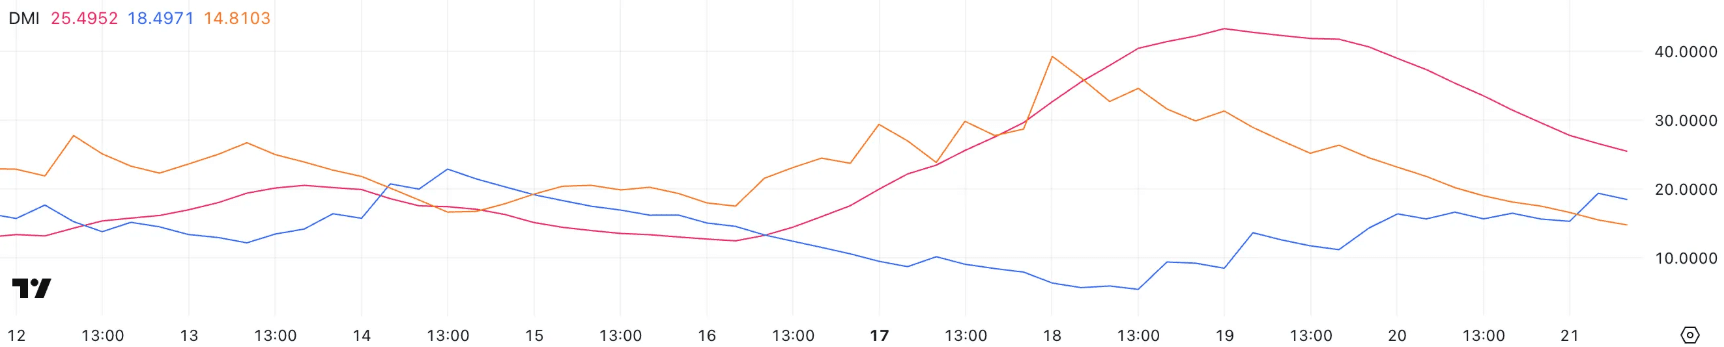
SOL/USDT 4-hour DMI | Source: TradingView
A falling ADX indicates that the strength of the downtrend is weakening, although the trend is still in place. An ADX above 25 usually signals a strong trend, but a falling value indicates that the downtrend is losing momentum, which could lead to a period of consolidation.
Meanwhile, the +DI is now at 18.4, up from 5.4 three days ago, while the -DI has fallen from 39.2 to 14.8 over the same period. This change suggests that buying pressure is increasing as selling pressure is decreasing. If the +DI continues to rise above the -DI, it could signal a trend reversal.
However, since SOL is still in a downtrend, strong and sustained buying pressure is needed to break this negative pattern. If +DI fails to maintain its upward momentum, the downtrend could resume.
Solana Could Reclaim $200 If Downtrend Reverses
Solana’s exponential moving averages (EMAs) are still showing a bearish bias, with the short-term EMAs below the long-term EMAs. However, the direction of these lines has started to change slightly since yesterday, with Solana’s price increasing by 4%.
This shows that selling pressure is waning and buying interest is slowly returning. If this momentum continues, it could lead to a trend reversal. However, for that to happen, the short-term EMAs need to cross above the long-term EMAs.

SOL/USDT 4-hour chart | Source: TradingView
If SOL can completely reverse the current downtrend, it could test the first resistance level at $183. A successful breakout would signal stronger bullish momentum, which could push the price towards the next resistance level at $197.
If buying pressure continues to increase, SOL price could target $220, marking a significant recovery.
Conversely, if the downtrend continues and selling pressure increases, SOL could retest the $159 support level.
A break below this level would indicate a continuation of the downtrend, potentially sending the price to $147 – its lowest level since October 2024.
