First confirm why 35%?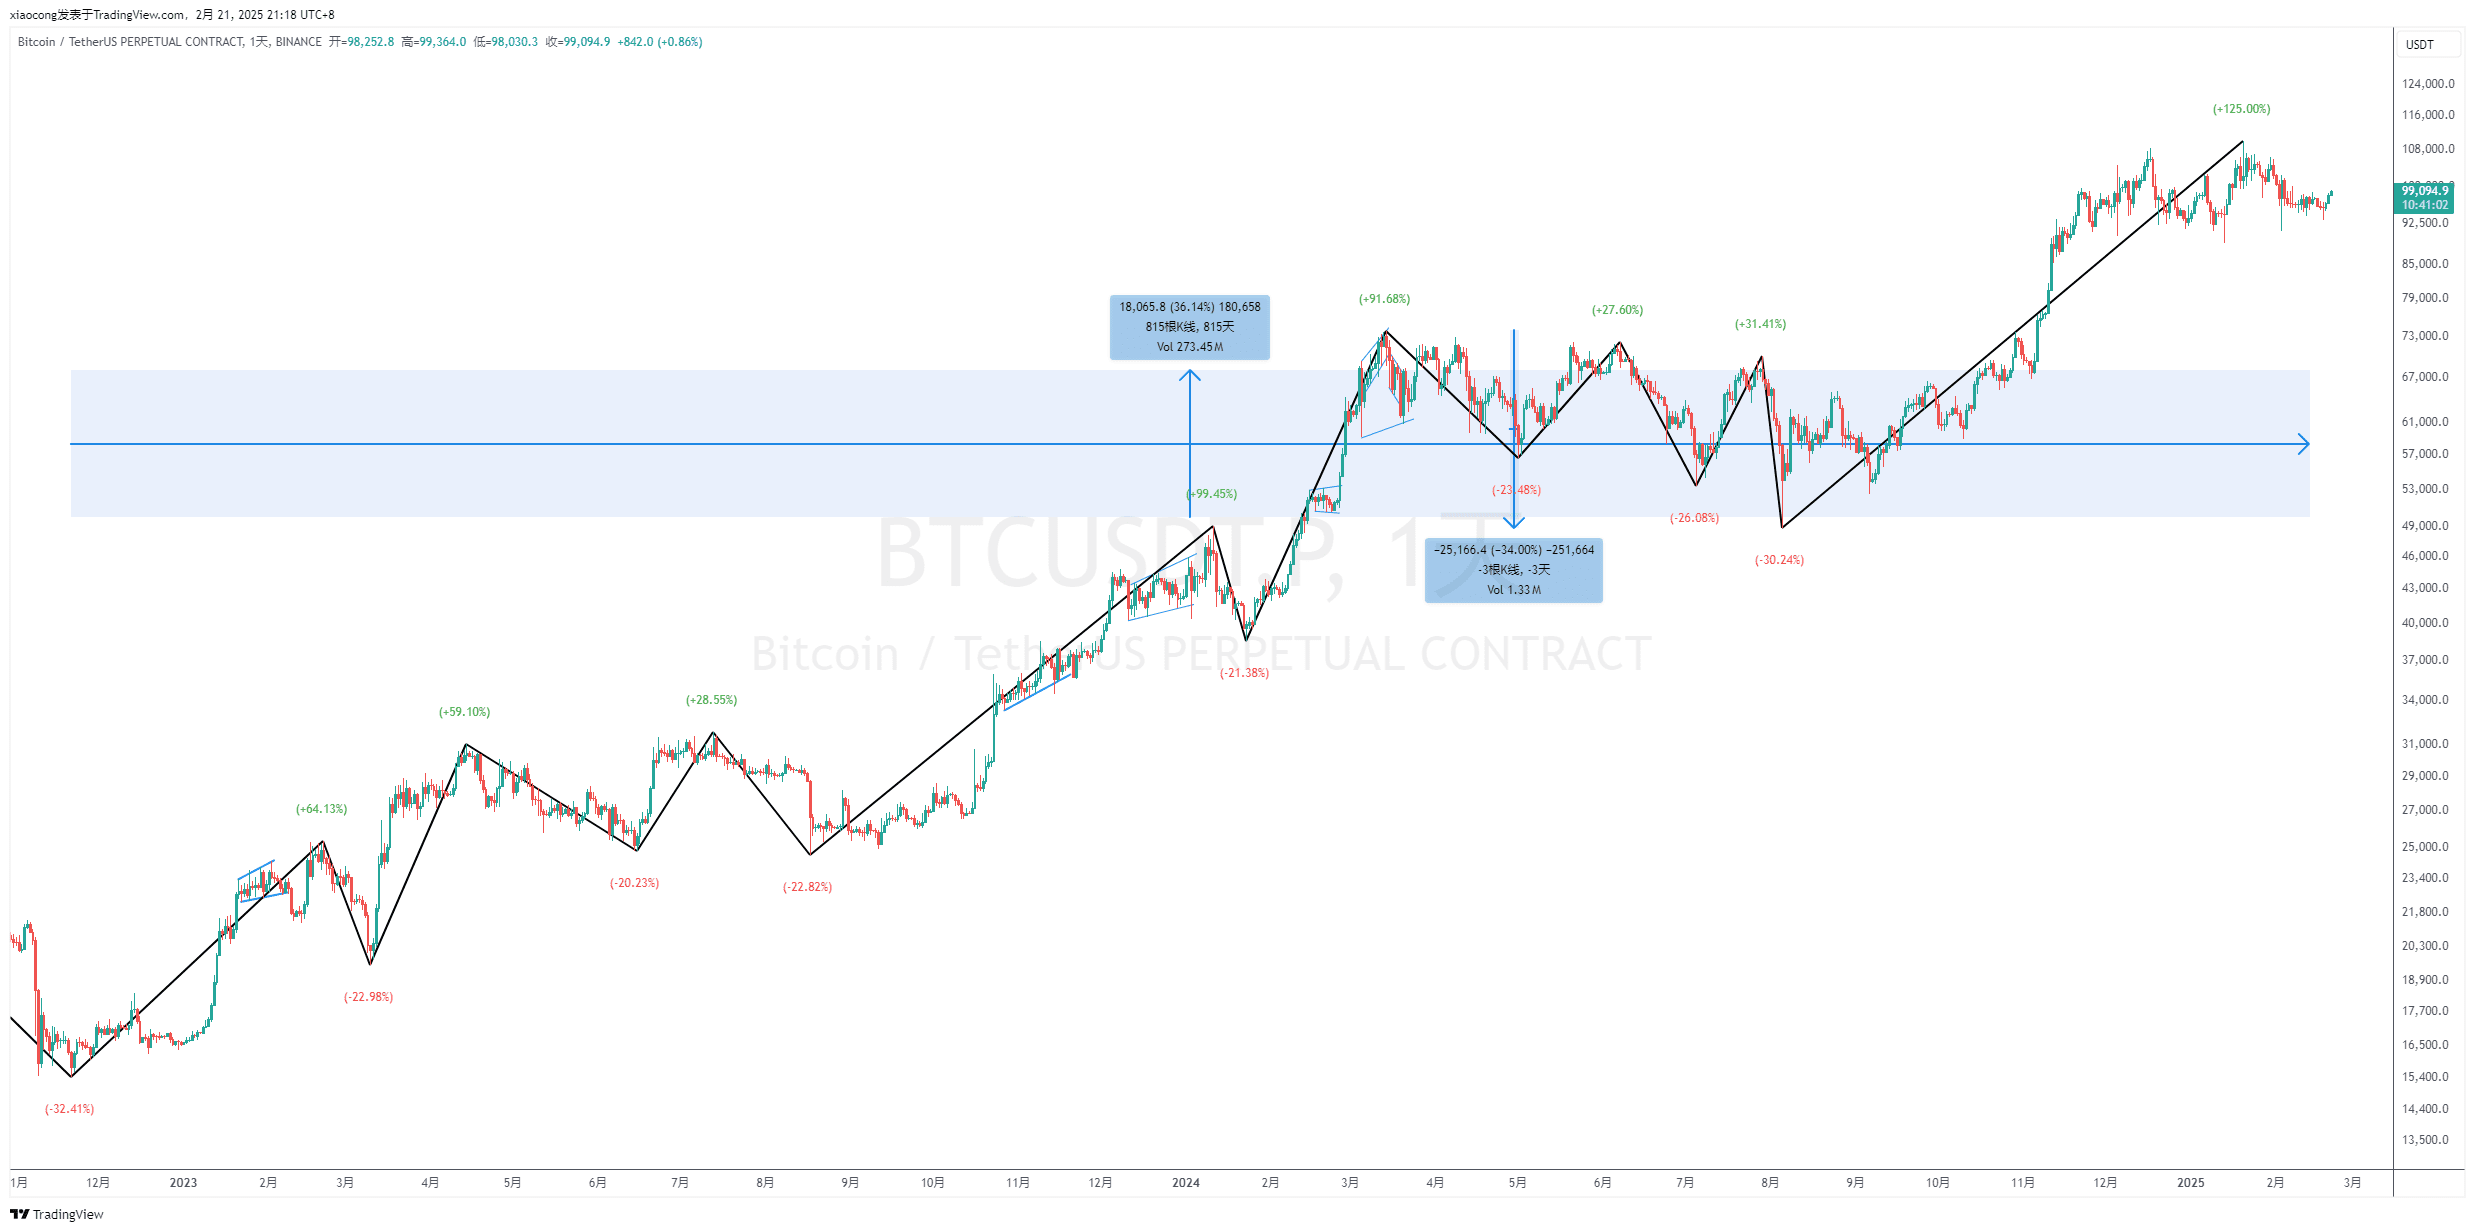
In 800 days, the maximum decline was only more than 30%
Of course, from a larger cycle perspective, the decline is deeper, at more than 80% and more than 70%.
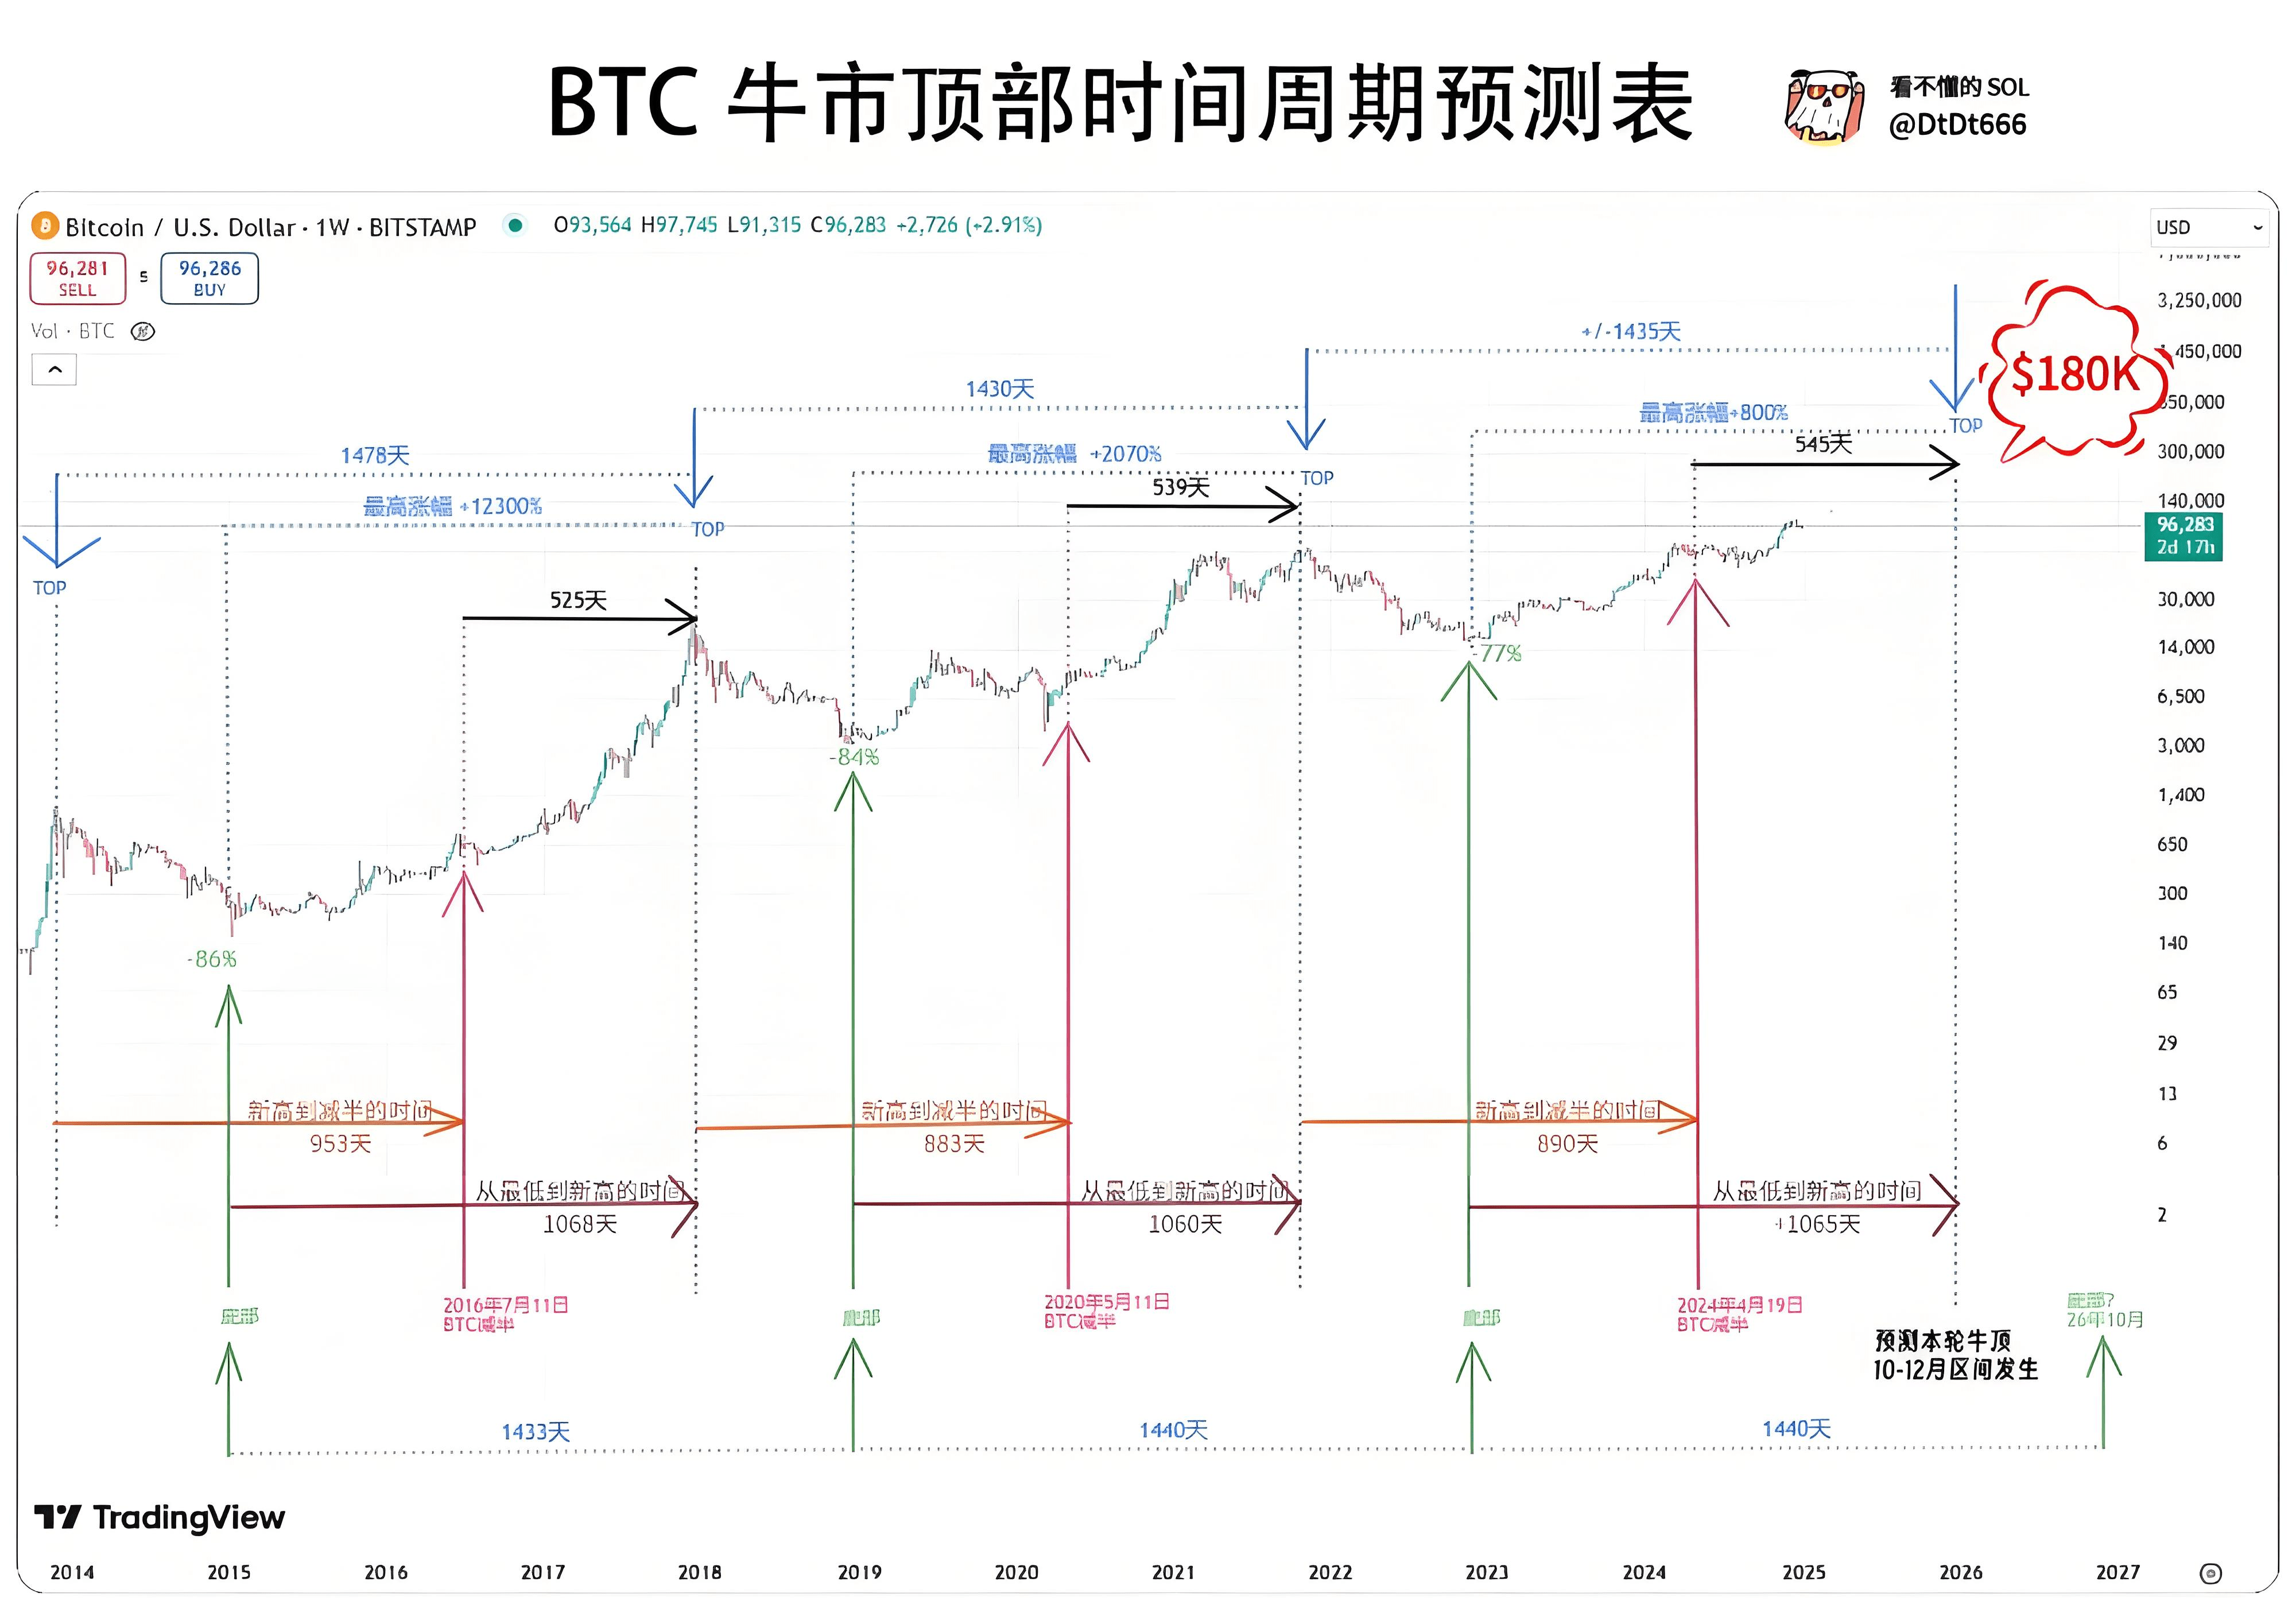
Of course, each bull market and bear market may be different, but only by understanding the cycle can you stay ahead of the curve. Of course, this kind of long-term investment in years does not fall within the scope of small funds.
Grid settings example
Grid range 65000-100000 Grid number 45 Ratio
Amount per transaction: 100 (actual situation may vary)
As shown in the figure below
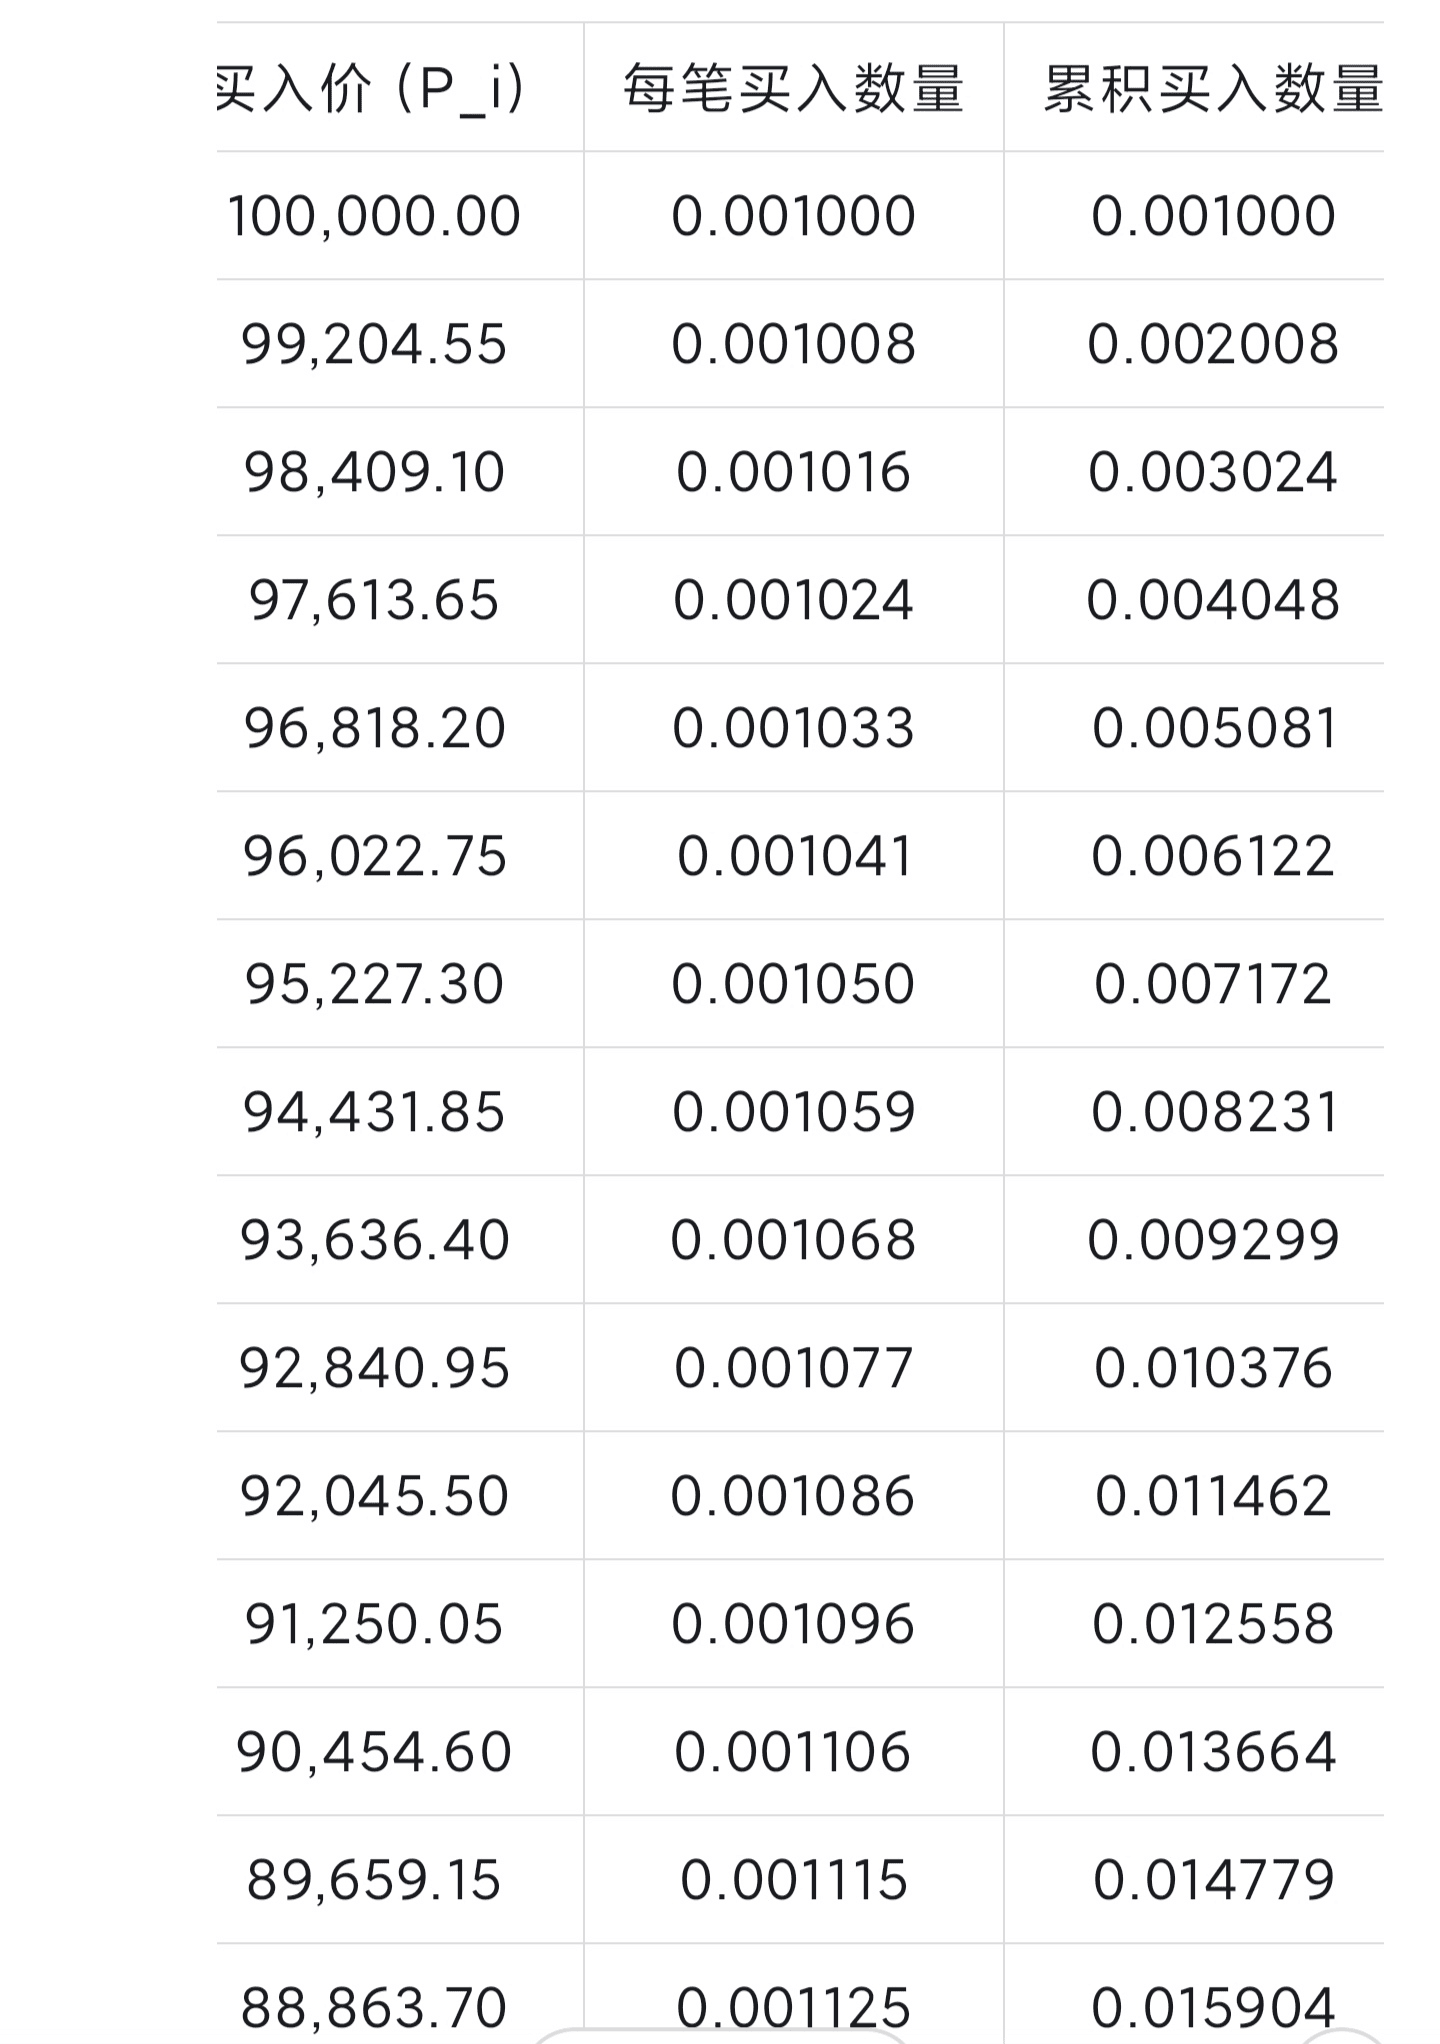
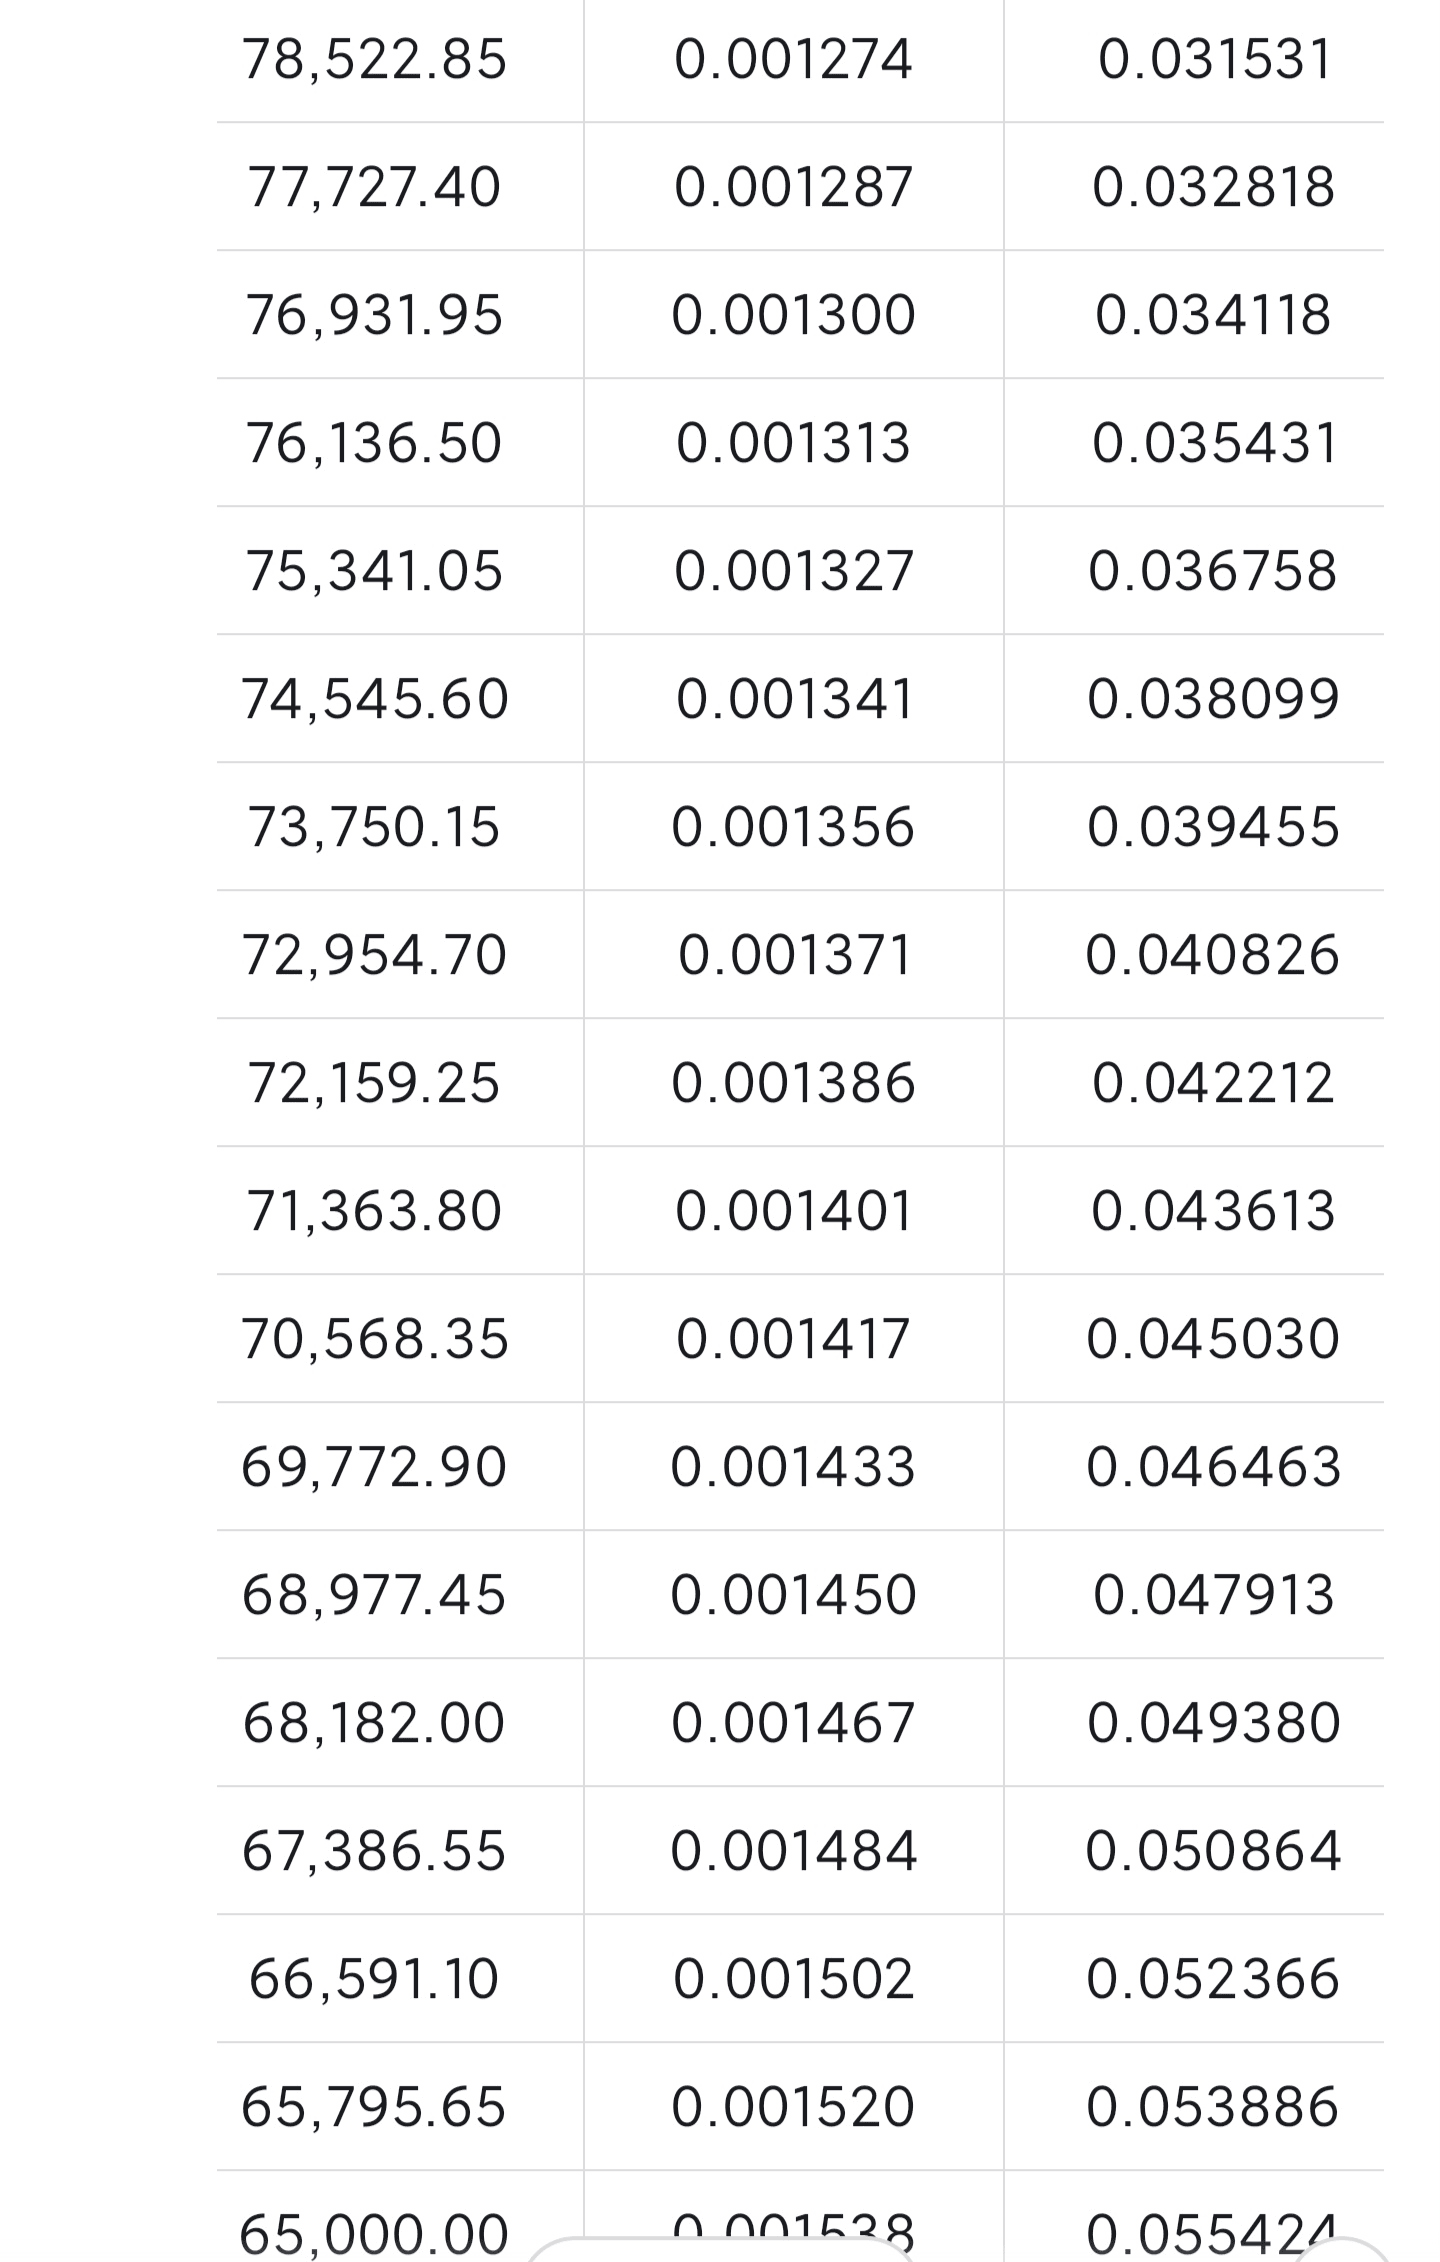
If the situation is extreme, it will drop all the way to 35%.
The loss is 897.44 USDT, which is about 19.94% of the 4,500 USDT.
A loss of 35% on 4500 is 1575 USDT.
897.44 USDT accounts for approximately 56.98% of 1,575 USDT.
The above data can be beneficial for the issue of capital utilization rate.
Regarding the issue of profitability.
Assuming 2 transactions per day.
The monthly profit is approximately 1.2% of 4500 and 6% of 897.
100 USDT compounded at 100% profit each time.
After 10 times, the profit is over 100,000 USDT.
After 20 times, it will reach 100 million USDT.
Of course, this is under ideal conditions.
Grid downward movement rule.
A drop of 35% requires an increase of 53.85% to return to the original position.
After moving down, buying within a lower price range, but the average price of these newly purchased assets may still be higher than the level after the subsequent price rise.
For example, if the original range is 100,000-80,000, moving down adjusts it to 80,000-60,000. Even if the price rises back to 80,000, if the average purchase price during the downward movement is 70,000, the overall holding cost will still be higher than the current price, leading to a loss.
The above is purely personal opinion and may be lacking.
