1. Trend Analysis and Technical Indicators
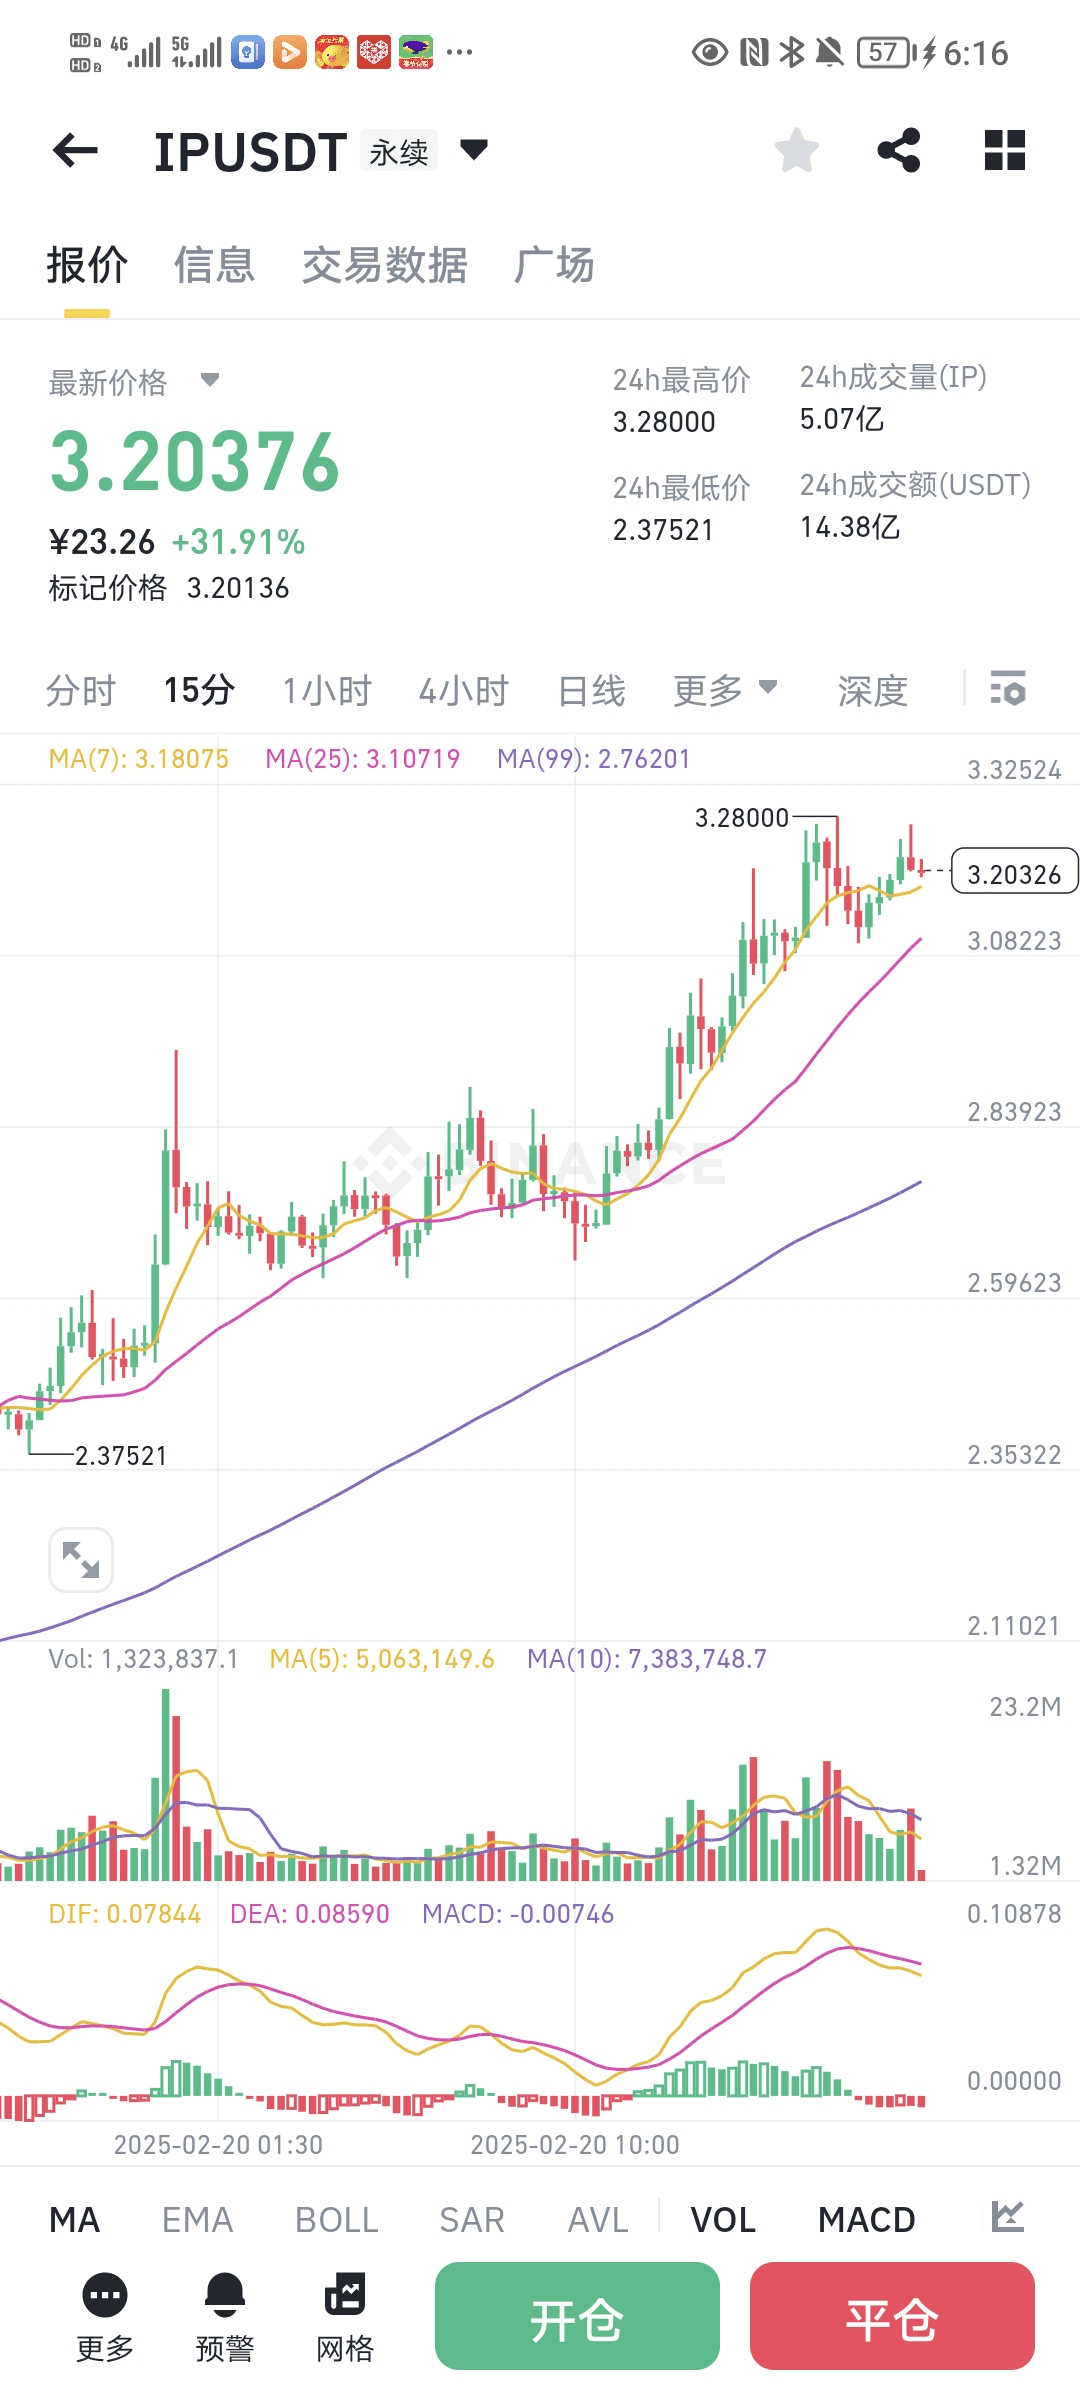
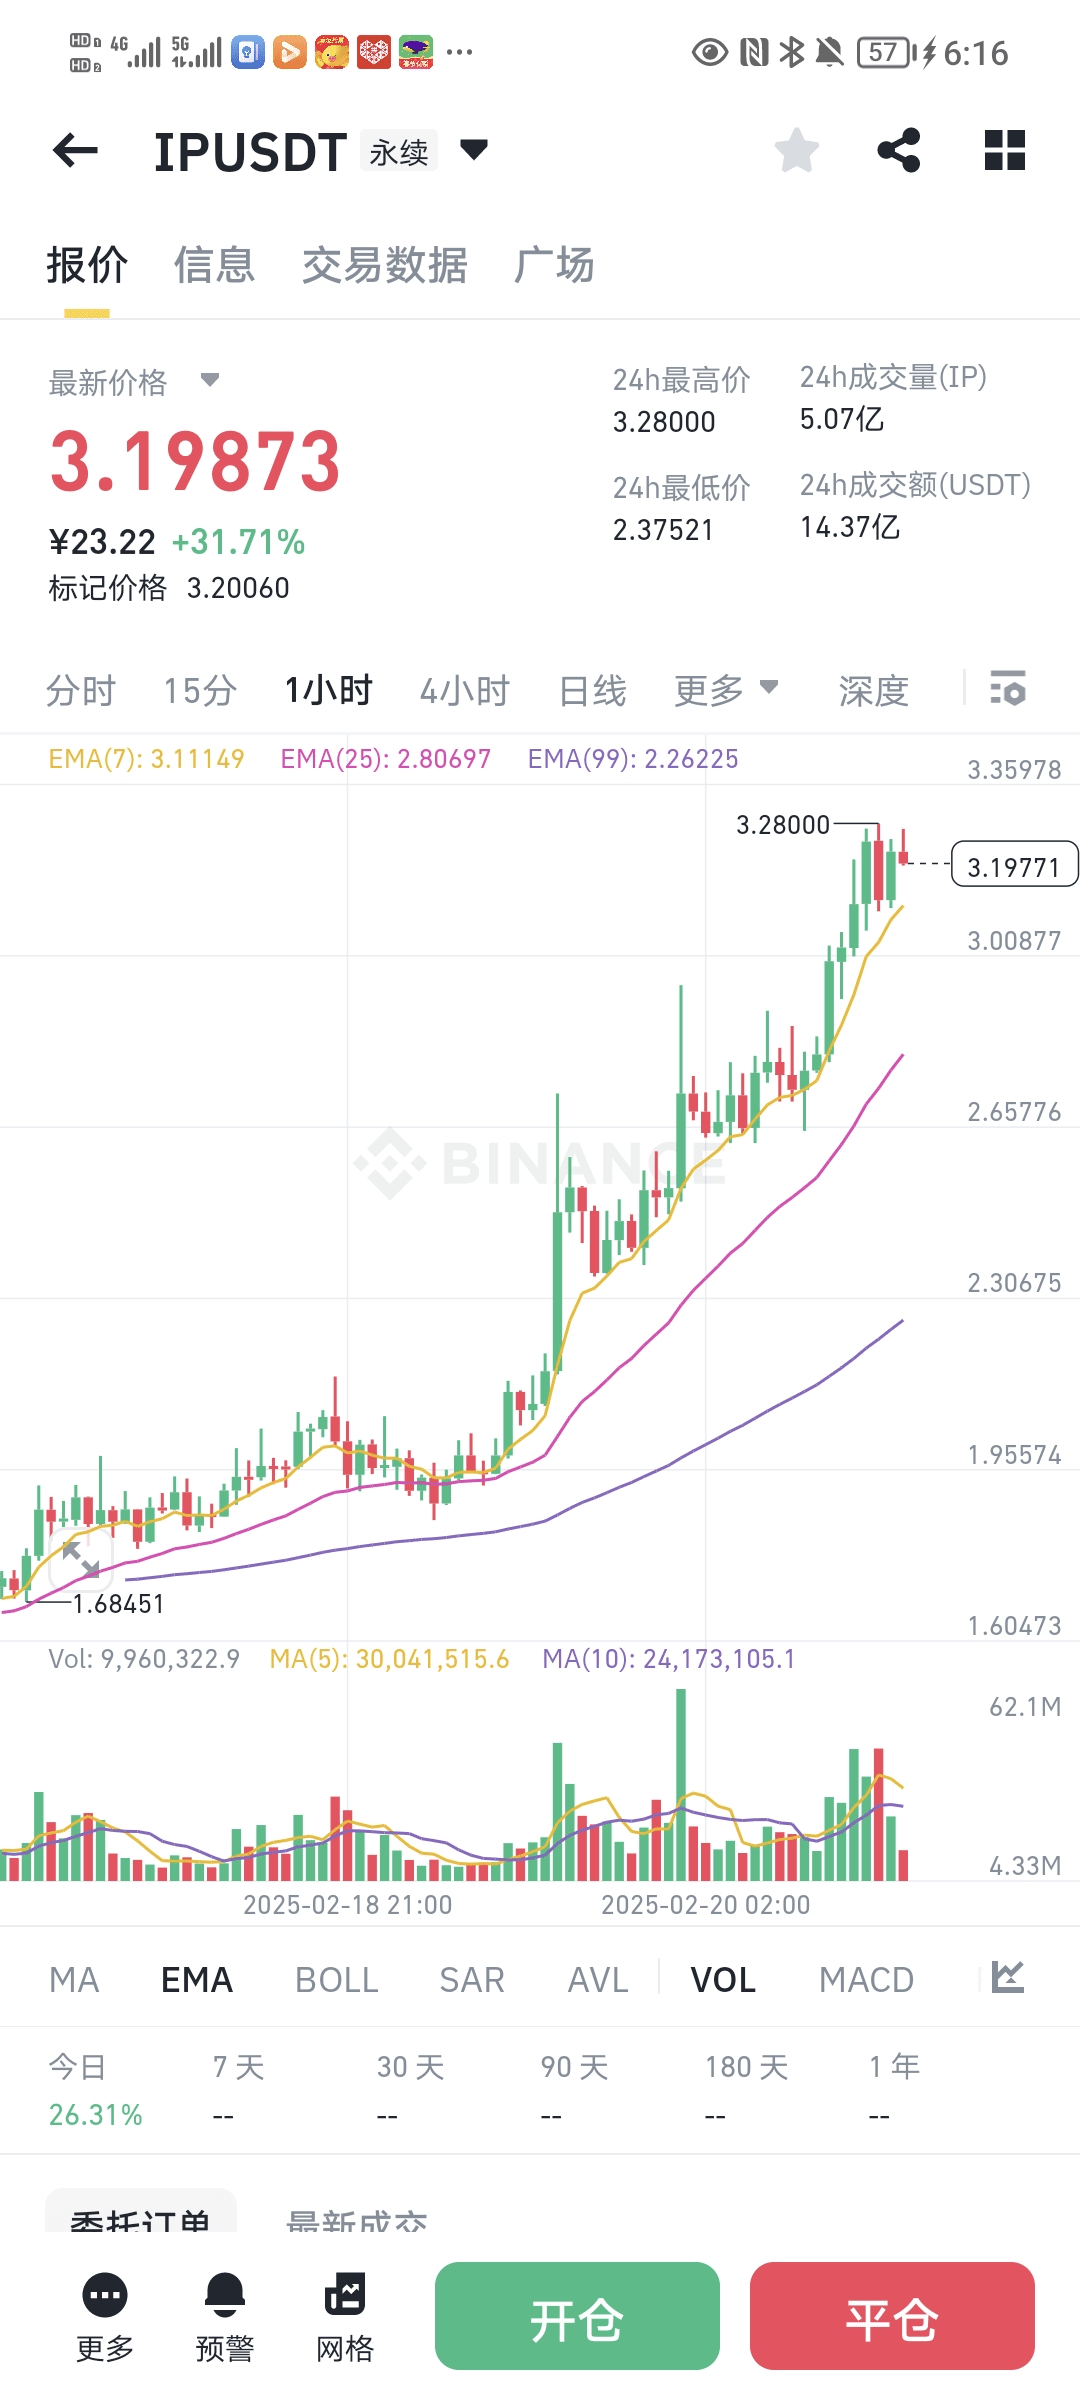
(1)Short-term Trend: Current price (3.20376) is above MA(7), MA(25), MA(99), and the short-term moving average (MA7) crosses above the medium and long-term moving averages, indicating a short-term upward trend. However, be cautious of the significant gap between the long-term MA (2.76201) and the current price, which may pose a retracement risk.
(2)Key Support/Resistance:
- Support Level: 2.37521 (recent low), 2.28000 (high trading volume area);
- Resistance Levels: 3.28200, 3.32524 (recent highs).
(3)Technical Indicator Combination:
- MACD: Observe golden cross/death cross signals to confirm trend continuation or reversal;
- Bollinger Bands (BOLL): If the price breaks through the upper band, it may be overbought; if it falls below the middle band (MA20), the trend weakens;
- Trading Volume: Current VOL is below the 5-day/10-day average volume. If the price continues to rise but trading volume does not increase, be cautious of chasing higher prices.
---
2. Opening Strategy
(1)Long Position Conditions:
- Price stabilizes above 3.20 (near marked price) and MACD forms a golden cross;
- Significant increase in trading volume, add position upon breaking the resistance level of 3.28.
(2)Short Position Conditions**:
- Price falls below MA7 (3.18075) and MACD shows a death cross;
- Rebound to around 3.28 faces resistance, along with shrinking trading volume.
---
3. Risk Management
(1)Set Stop Loss with Profit:
- Long Position Stop Loss: Set at 3.00 (psychological level) or below MA25 (3.10719);
- Short Position Stop Loss: Set at 3.30 (above recent high).
(2)Position Control: Single position not exceeding 5% of total capital, leverage not exceeding 10 times (to avoid high leverage liquidation).
(3)Take Profit Strategy: Take profit in stages, for example, close positions in batches at 3.30, 3.40, retaining part of the position to capture trend continuation.