Current open interest, the current contract open interest for this trading pair in the market, measured in USD rather than the quantity of the cryptocurrency, for convenience and uniformity. 1M represents a contract open interest of one million USD. How to form a contract open interest of one million USD? Just find two people to bet against each other; one is bullish and opens a position of one million USD, and the other is bearish and opens a position of one million USD. This way, the open interest increases by one million USD, not two million USD. These two are counter parties. The winners take the other party's money (mutual extraction of each other's funds). If the price rises by one percent, the long position gains 1% (can close at 101w), while the short position loses 1% (closing requires buying at 101w), and the contract open interest remains unchanged. Because one position has an actual value of 101 (earning 1w), while the other is 99 (losing 1w), averaging gives 100. Open interest does not change because of price increases unless new betting capital is introduced. Closing a position will lead to a decrease in open interest.
Open interest reflects the capital heat of that cryptocurrency. The chart below shows the open interest at the time of inquiry (in USD), and the data will change in real-time, with the latest being the standard.
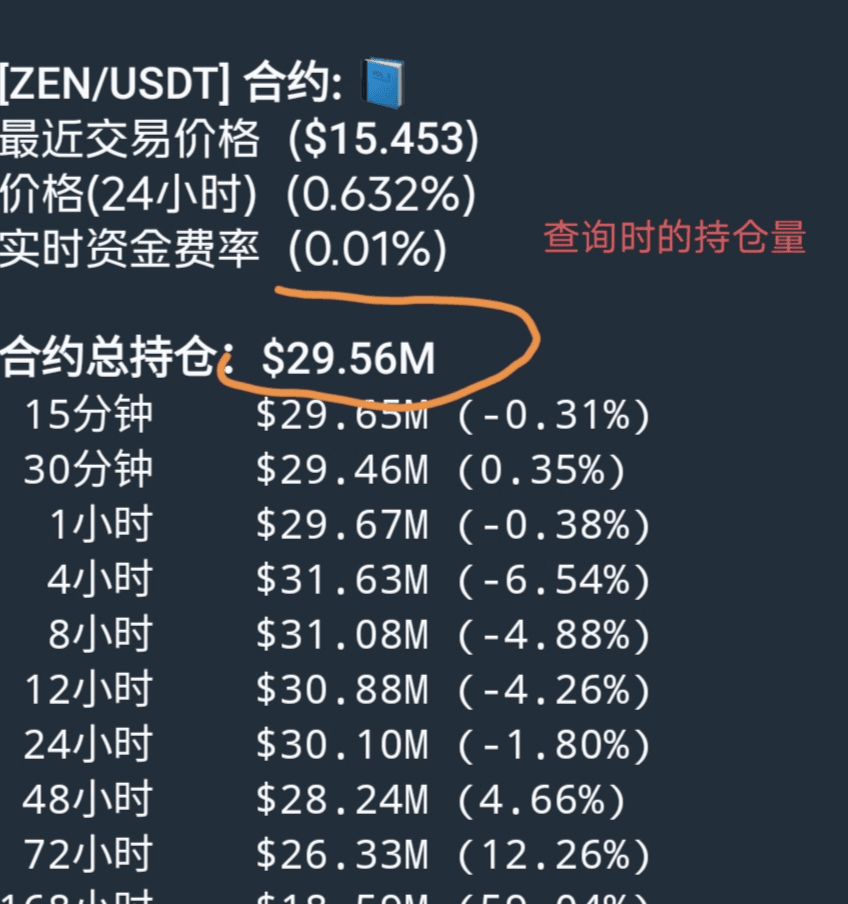
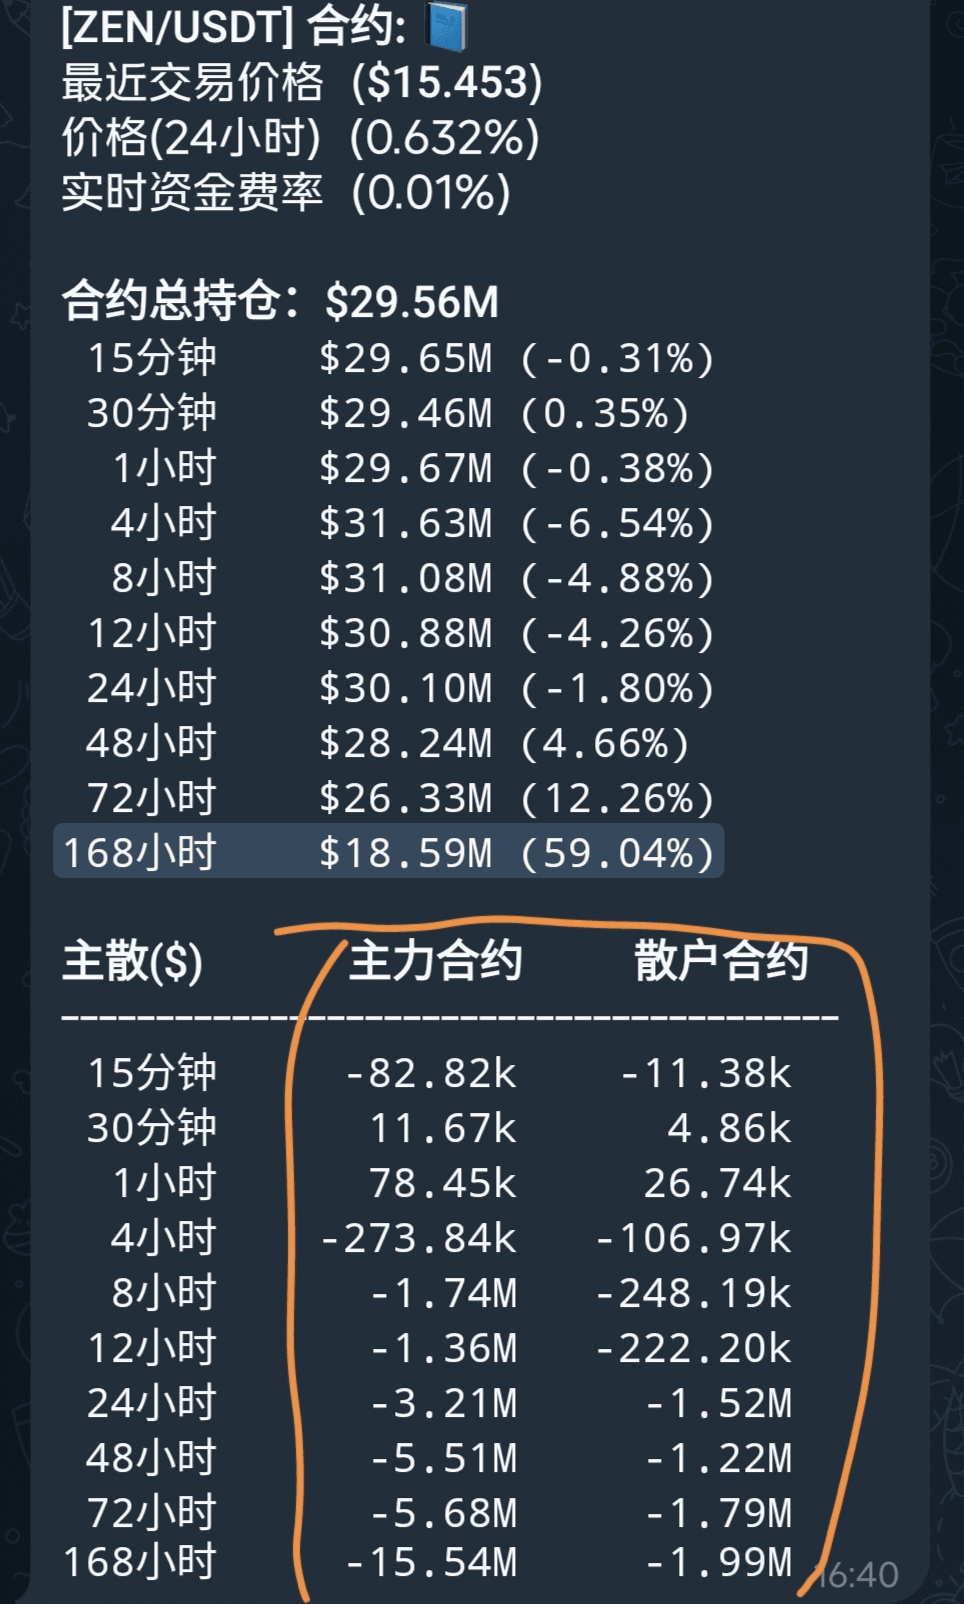
Change in open interest, how much the open interest has changed over a recent period of time. The above chart has multiple time levels, ranging from 15 minutes to 168 hours (which is one week) of open interest. The current is 29.56M, 15 minutes ago it was 29.65M, 12 hours ago it was 30.88M, one day ago (24 hours ago) it was 30.1M, and so on. The percentage that follows indicates how much the current open interest has changed compared to that time, for example, the current is 4.26% less than it was 12 hours ago.
Capital inflow situation, also displayed according to time levels. It indicates the capital inflow situation over a certain period of time. In the chart below, the main players have flowed out 3.21M in 24 hours, and retail investors have flowed out 1.52M (negative means outflow, positive means inflow). Mainly refer to the inflow and outflow situation within 24 hours, as data may become distorted over a longer period (not meaningful for reference). If the change in open interest is very close to the capital inflow value, it indicates that the main players have a strong willingness to take orders (it is better to also check if there is a base position held for more assurance). The main players refer to the statistics of larger orders, while retail investors refer to smaller amounts.
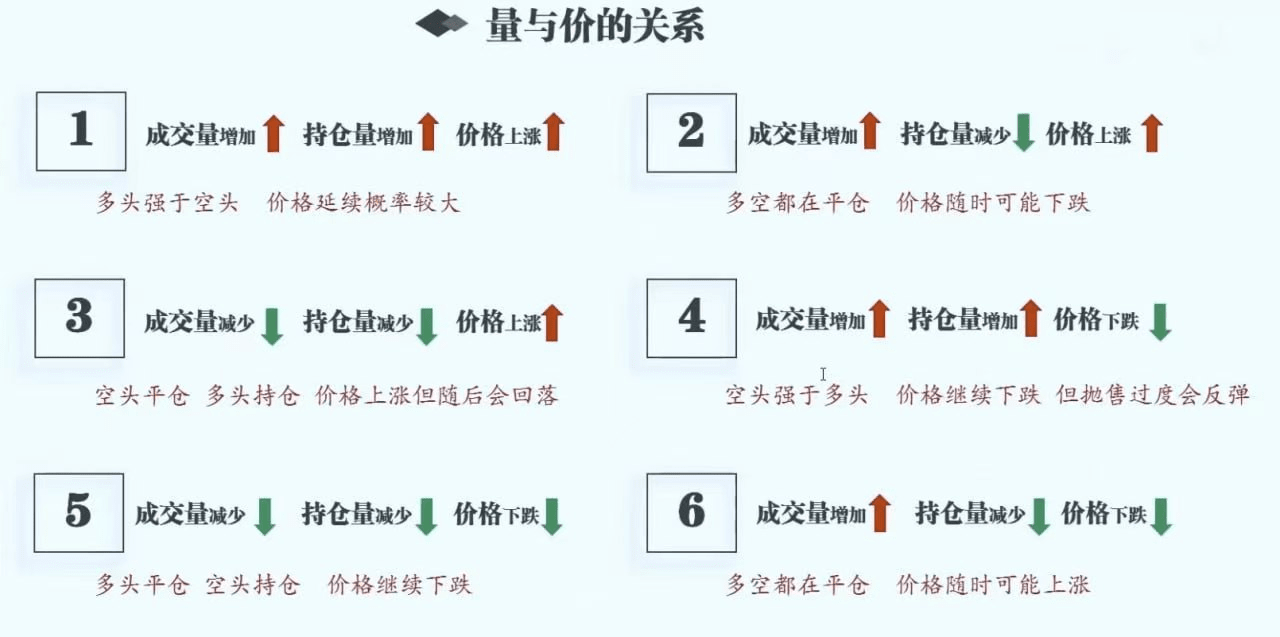
A simple judgment on what types of orders the main players are primarily opening; specific judgments may not apply if the main players are causing disturbances.
Price increases, open interest increases, primarily opening long positions.
Price increases, open interest decreases, primarily closing short positions.
Price decreases, open interest increases, primarily opening short positions.
Price decreases, open interest decreases, primarily closing long positions.
In addition to these situations, there may also be sideways trading to open long or short positions, which needs to be judged based on the inflow situation. Below is a chart for reference.
More complex analysis involves looking at the net long and short data and other indicators to make judgments. Also, it combines technical analysis and personal experience. When the direction is uncertain, one can either trade with a small position or not open a position at all while waiting for new opportunities to arise.
Explore the latest crypto news
⚡️ Be a part of the latests discussions in crypto
💬 Interact with your favorite creators
👍 Enjoy content that interests you
Email / Phone number
Relevant Creator
