

Before you know it, 2023 is almost over. In this article, we will conduct a systematic overview and review of the changes that have occurred on the chain this year, and explore how the landscape of Bitcoin, Ethereum, derivatives and stablecoins will evolve in 2023, and how they have laid the foundation for an exciting future. The road ahead.
Summary
2023 was an unforgettable year for the crypto industry, with Bitcoin rising by more than 172% and a correction of less than 20%, and a large amount of assets flowing into BTC, ETH and stablecoins.
In 2023, several important technologies and on-chain pricing models in the crypto market will break new historical records, and October is a key node for institutional capital flows.
Currently, the supply of Bitcoin held by long-term holders is almost at an all-time high, and the vast majority of Bitcoins are now profitable.
Major changes are taking place in the market structure, such as Tether re-establishing stablecoin dominance, CME futures surpassing Binance for the first time, and significant growth in the options market.
2023 was an unforgettable year for the crypto industry, with Bitcoin rising by more than 172%. Other digital assets have also performed quite strongly, with Ethereum and most altcoins increasing their market capitalization by more than 90%.
Bitcoin’s rising dominance can be seen, which is often seen as a sign of market recovery from a prolonged bear market such as 2021-22. Ethereum in particular has had a somewhat slow start relative to Bitcoin, with the ETH/BTC ratio falling to multi-year lows around 0.052, despite the successful launch of the Shanghai upgrade and the development of the L2 ecosystem.
While digital assets have significantly outperformed traditional assets such as stocks, bonds and precious metals throughout the year, most of the gains have come from the rebound since late October. Bitcoin first broke through the psychologically important price level of $30,000 after October, as well as many important price levels.
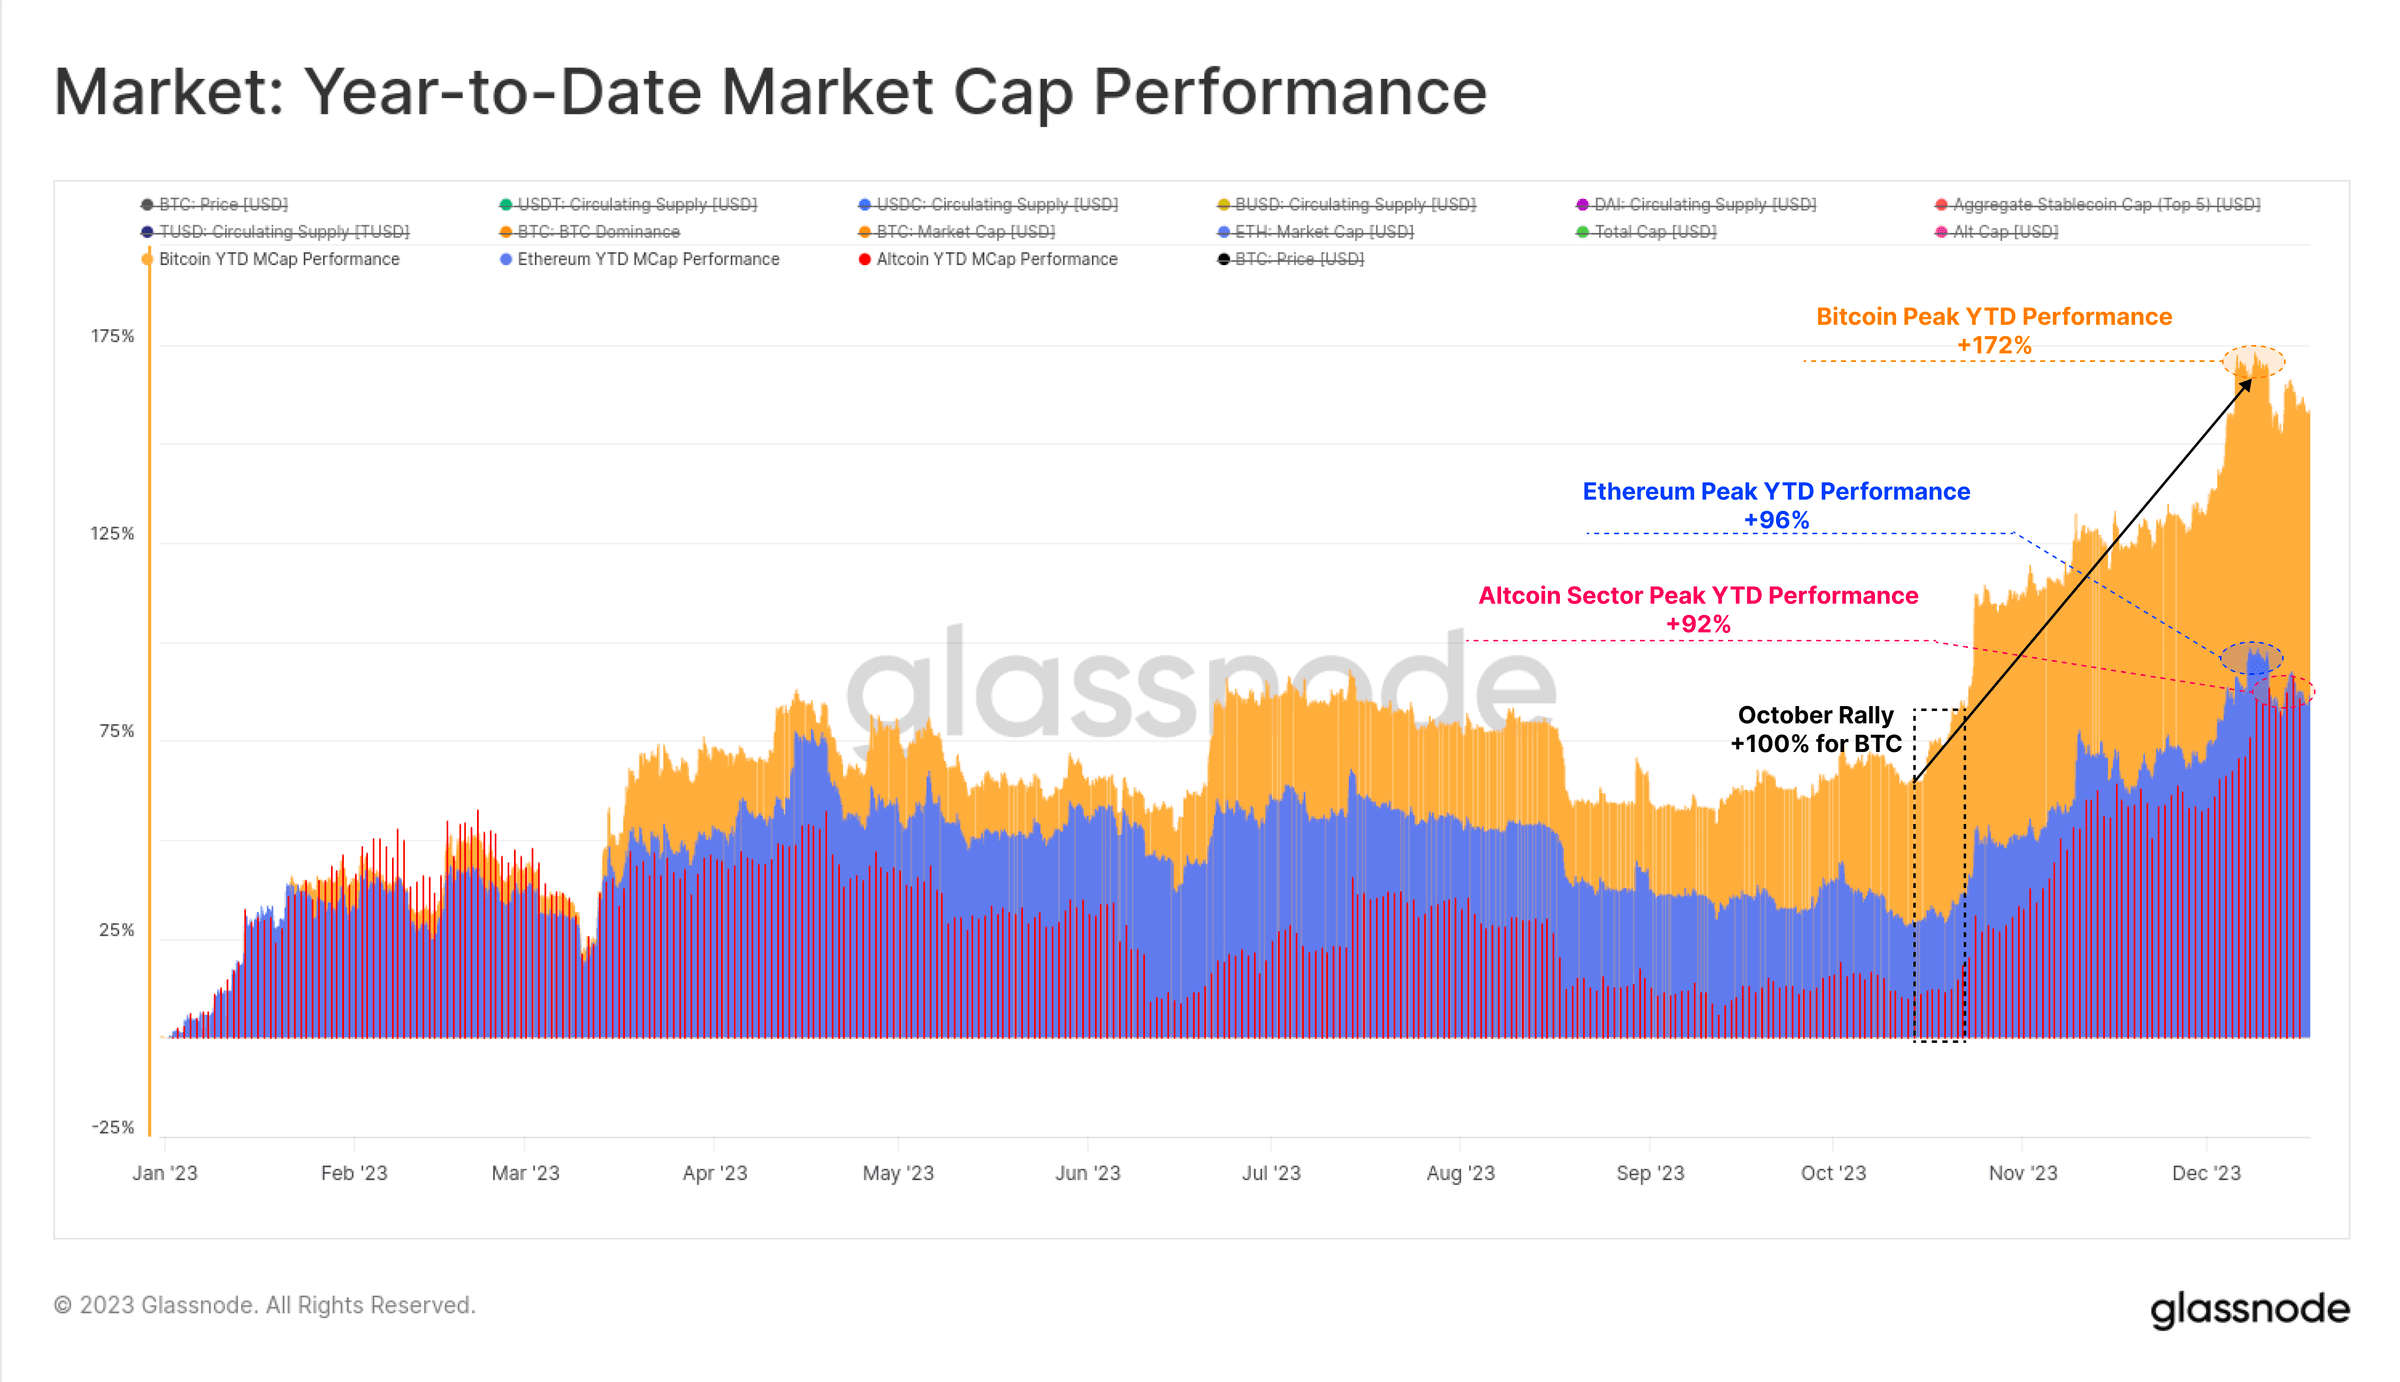 Figure 1: Market capitalization performance year to date
The magnitude of the correction is not obvious
Another unique aspect of 2023 is the very shallow depth of all Bitcoin price pullbacks. Historically, Bitcoin has typically retraced at least 25% from local highs during bear market recoveries and bull market uptrends, with many periods even exceeding 50%.
However, the deepest correction in 2023 closed just 20% below the local high, indicating buyer support at this level.
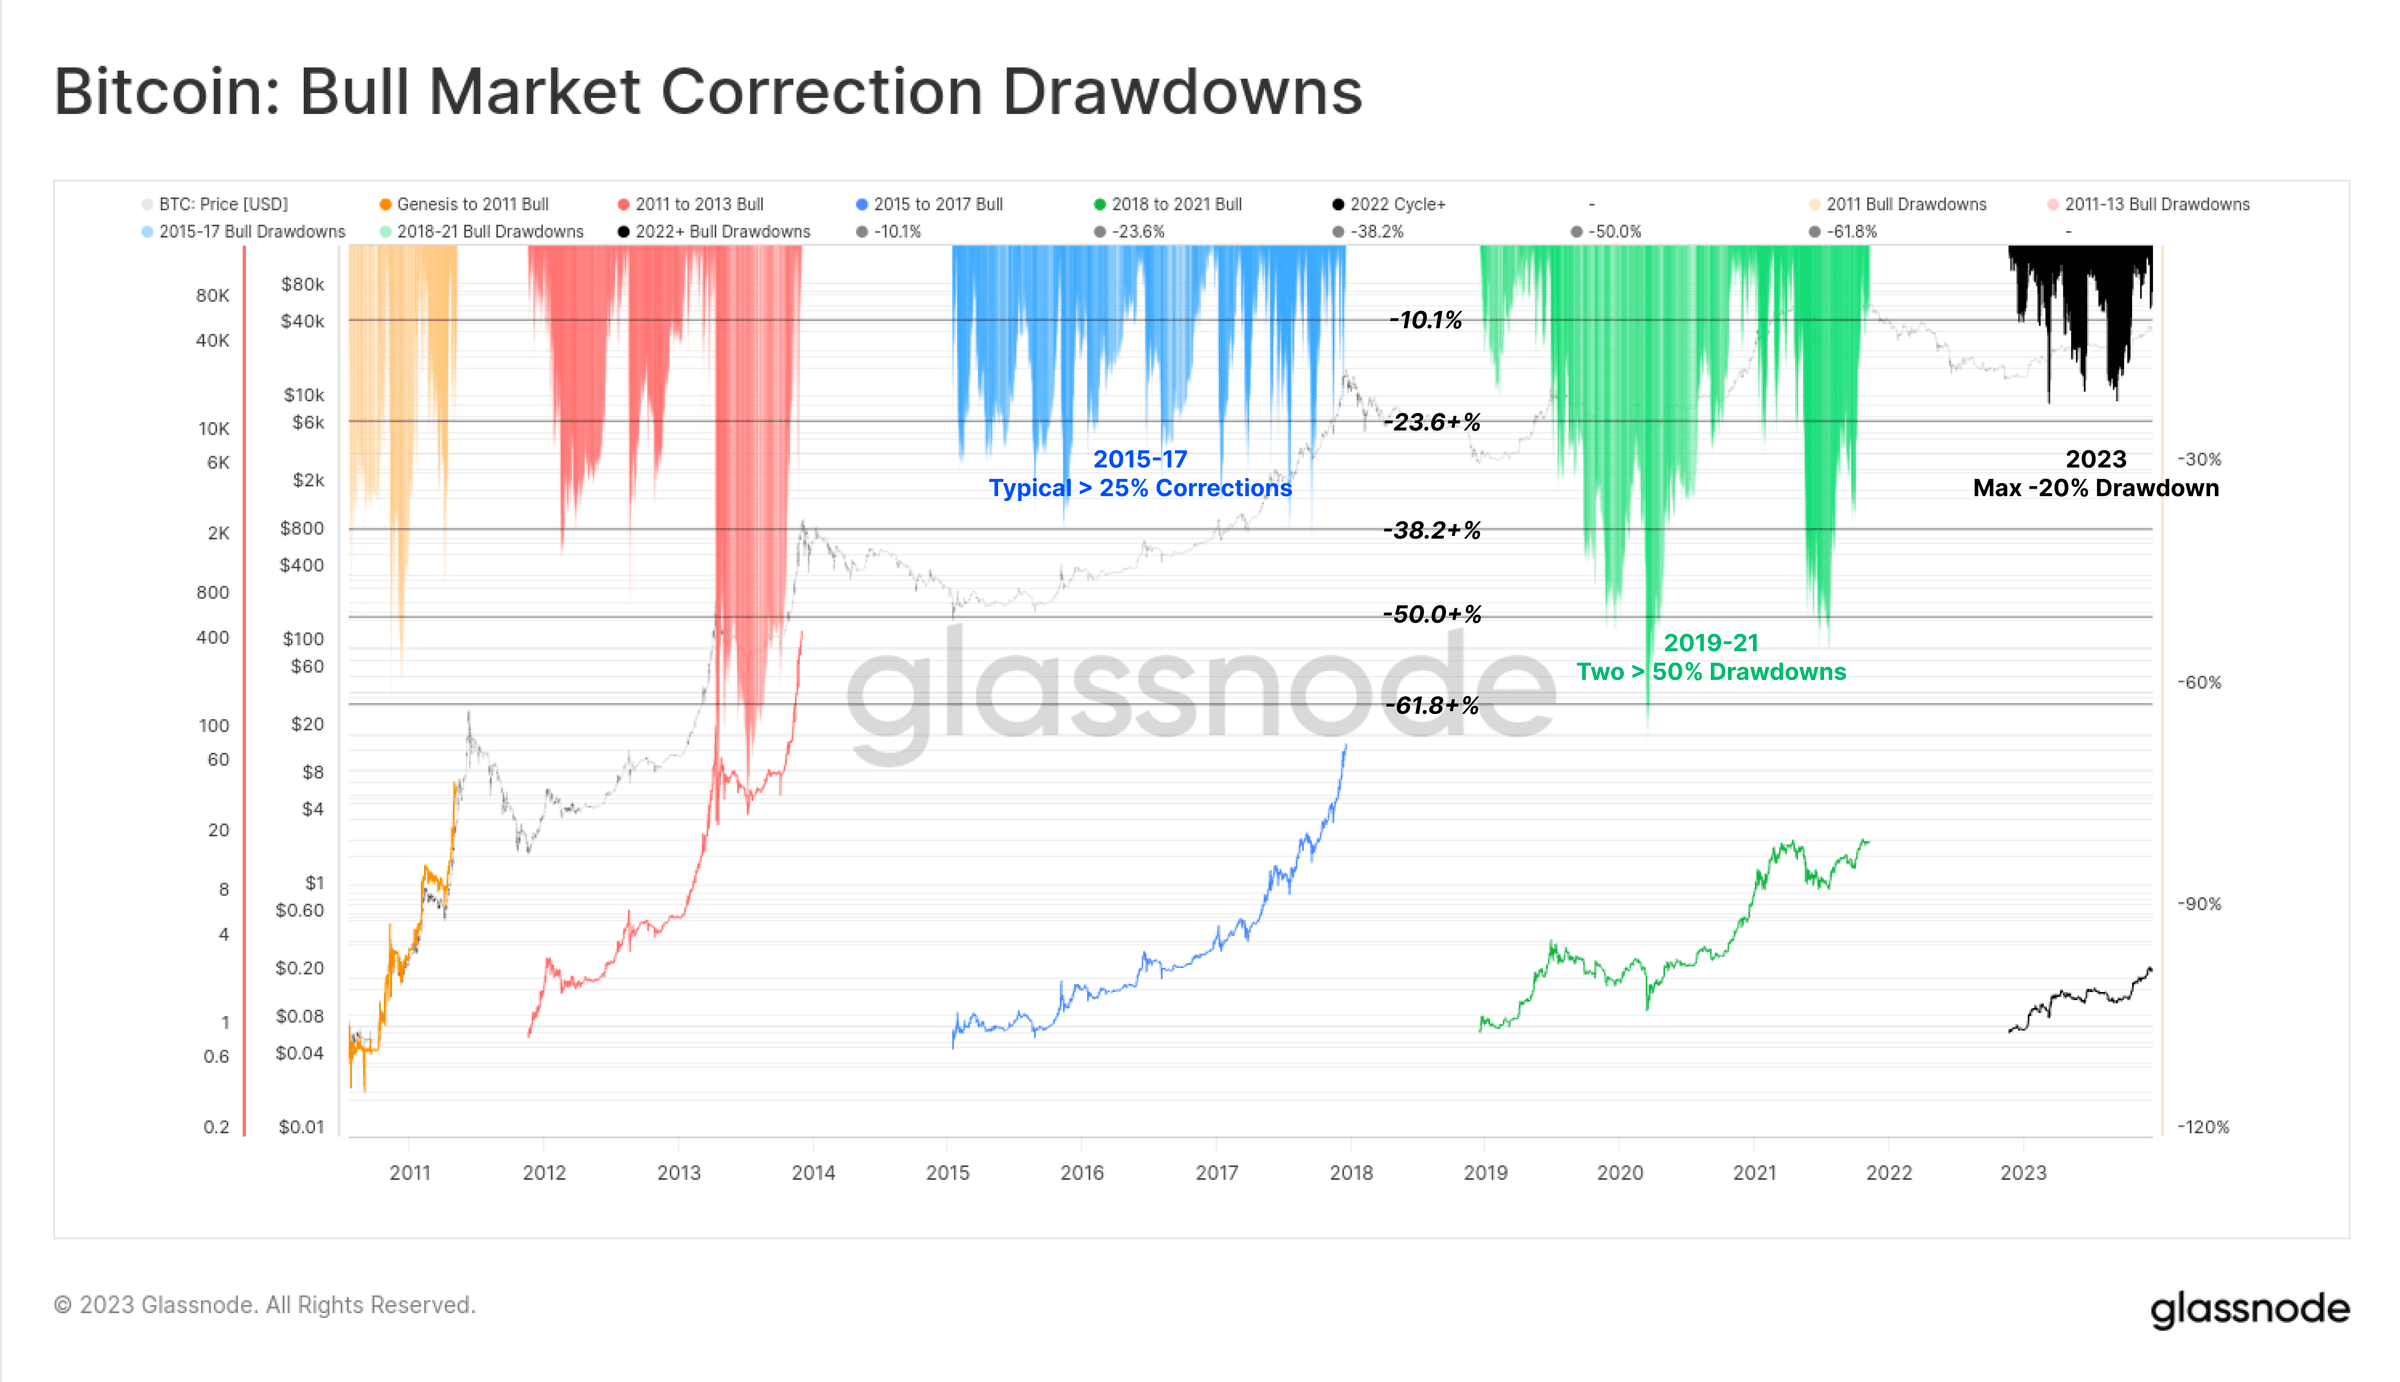 Figure 2: Bitcoin: Bullish Correction
Ethereum’s adjustment depth is also relatively shallow, with the deepest adjustment reaching 40% in early January. Despite its weak performance relative to Bitcoin, this also depicts a constructive background, that is, the reduction in Ethereum supply caused by the Merger meets the demand for relative elasticity.
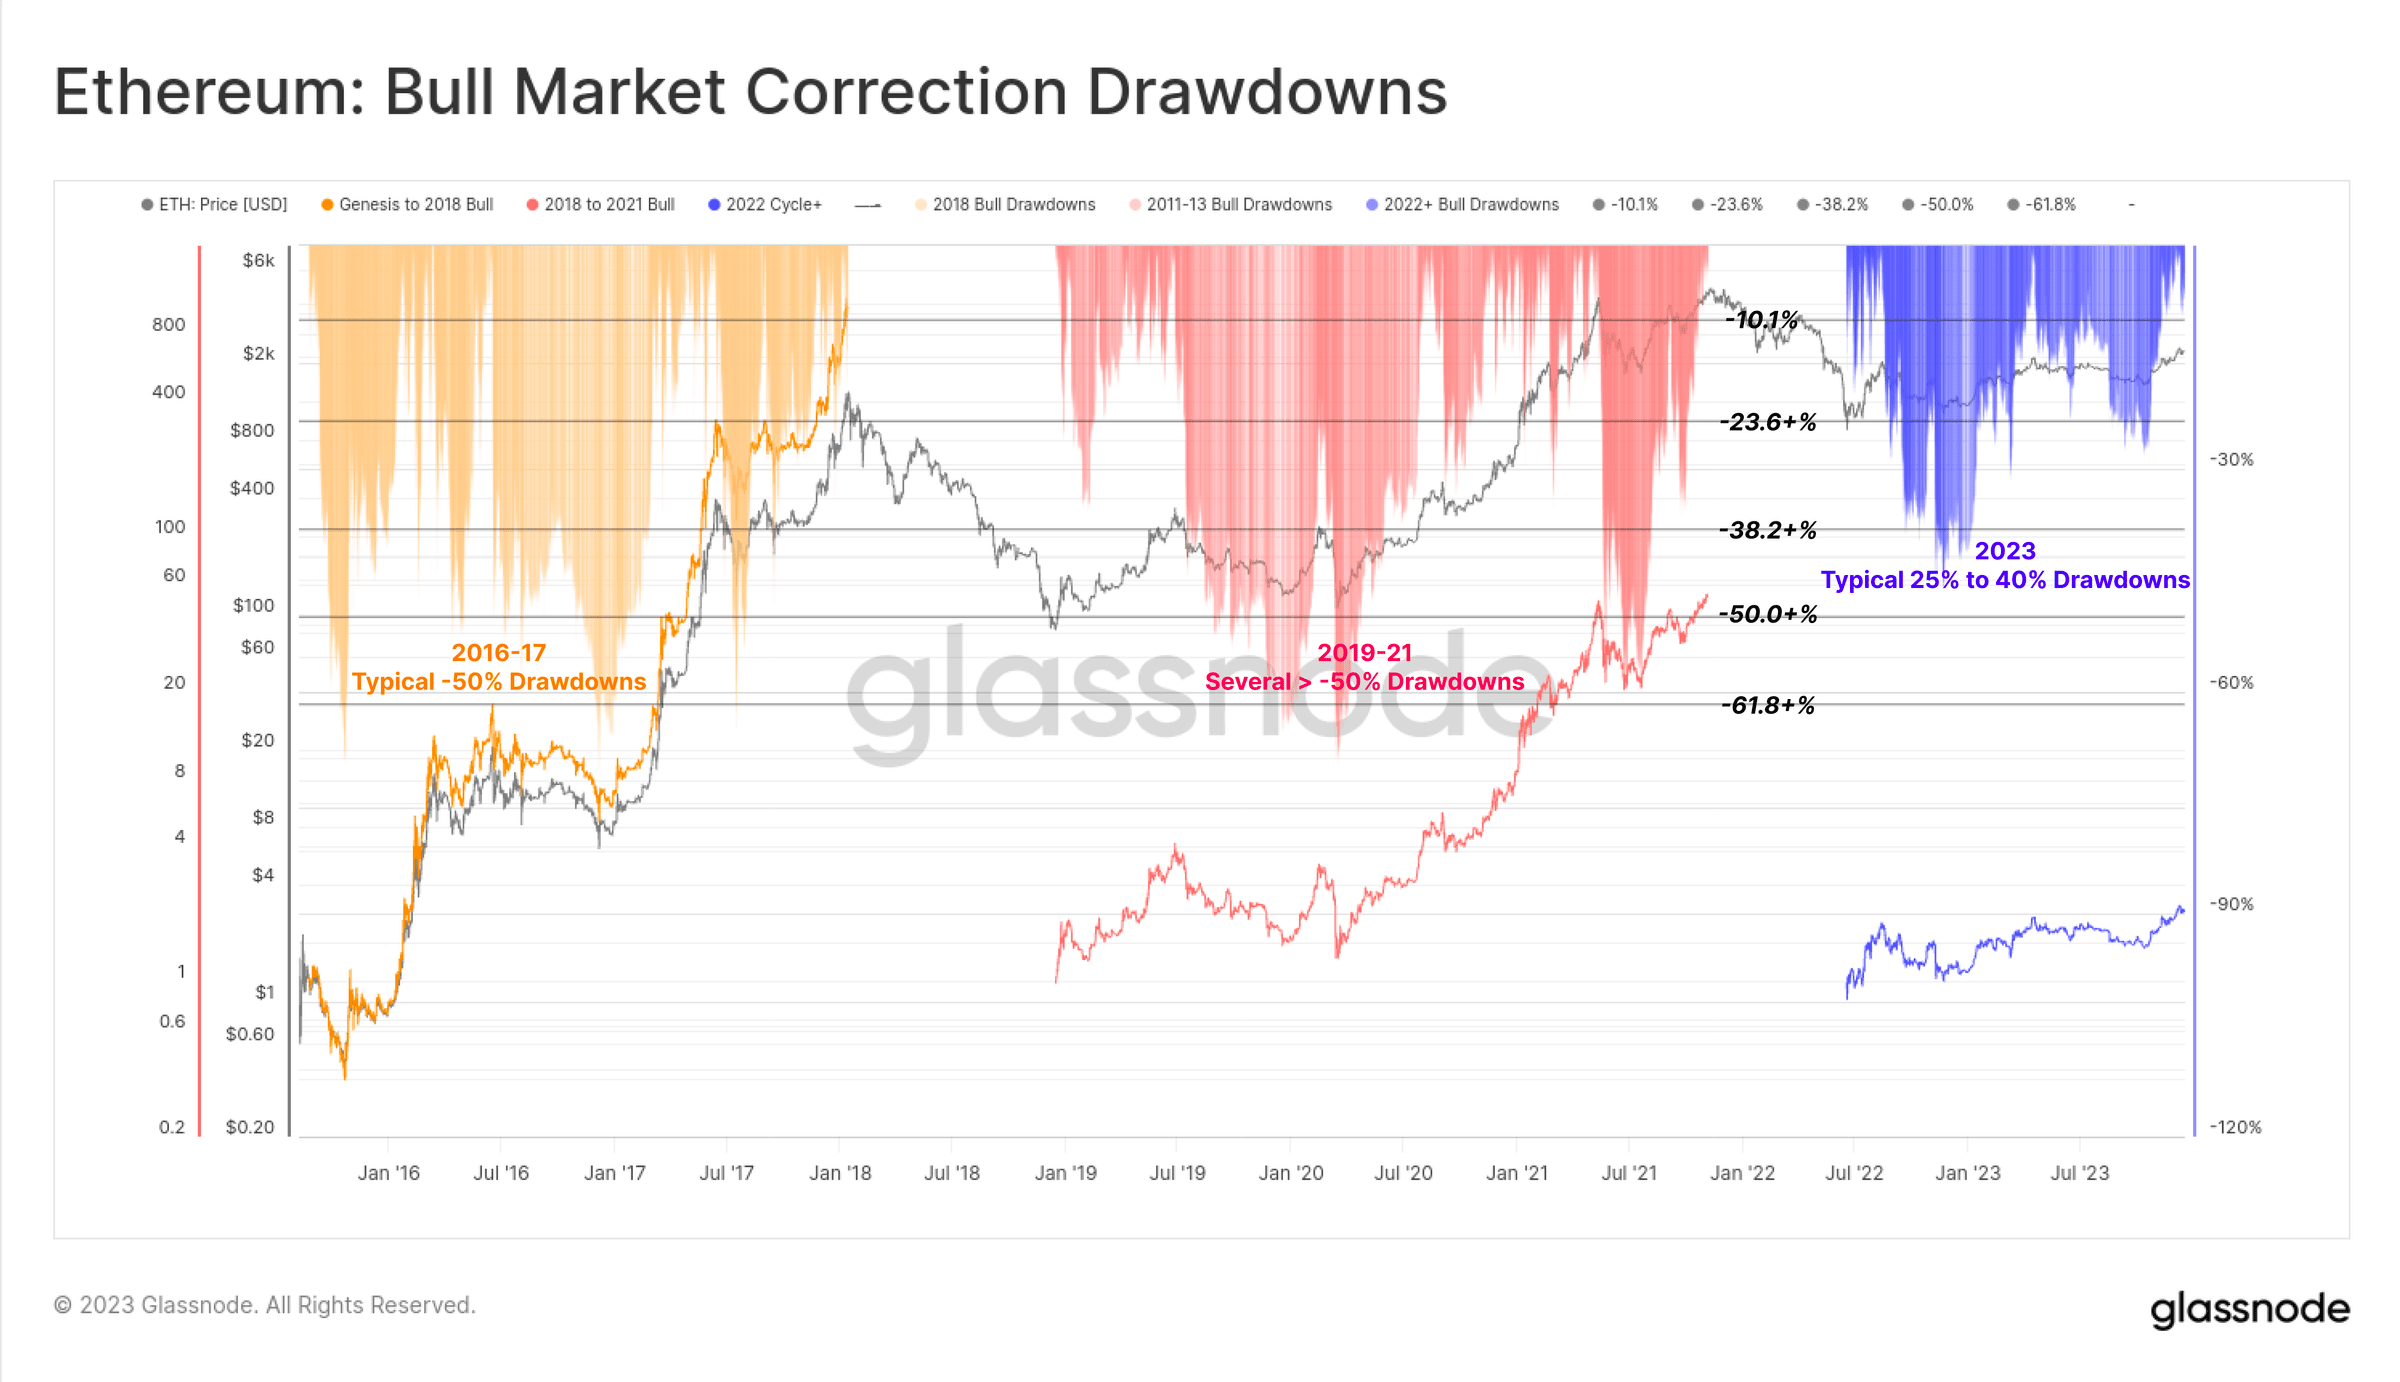 Figure 3: Ethereum: Bullish Correction
The 2022 bear market is slightly less brutal than the 2018-20 bear market cycle, with most mainstream digital assets down 75% from their ATHs since 2023, but recent strong performance has made up for most of the losses. The current mainstream digital assets have fallen 40% (BTC), 55% (ETH), 51% (altcoins, excluding ETH and stablecoins) and stablecoin supply (24%) from their ATHs.
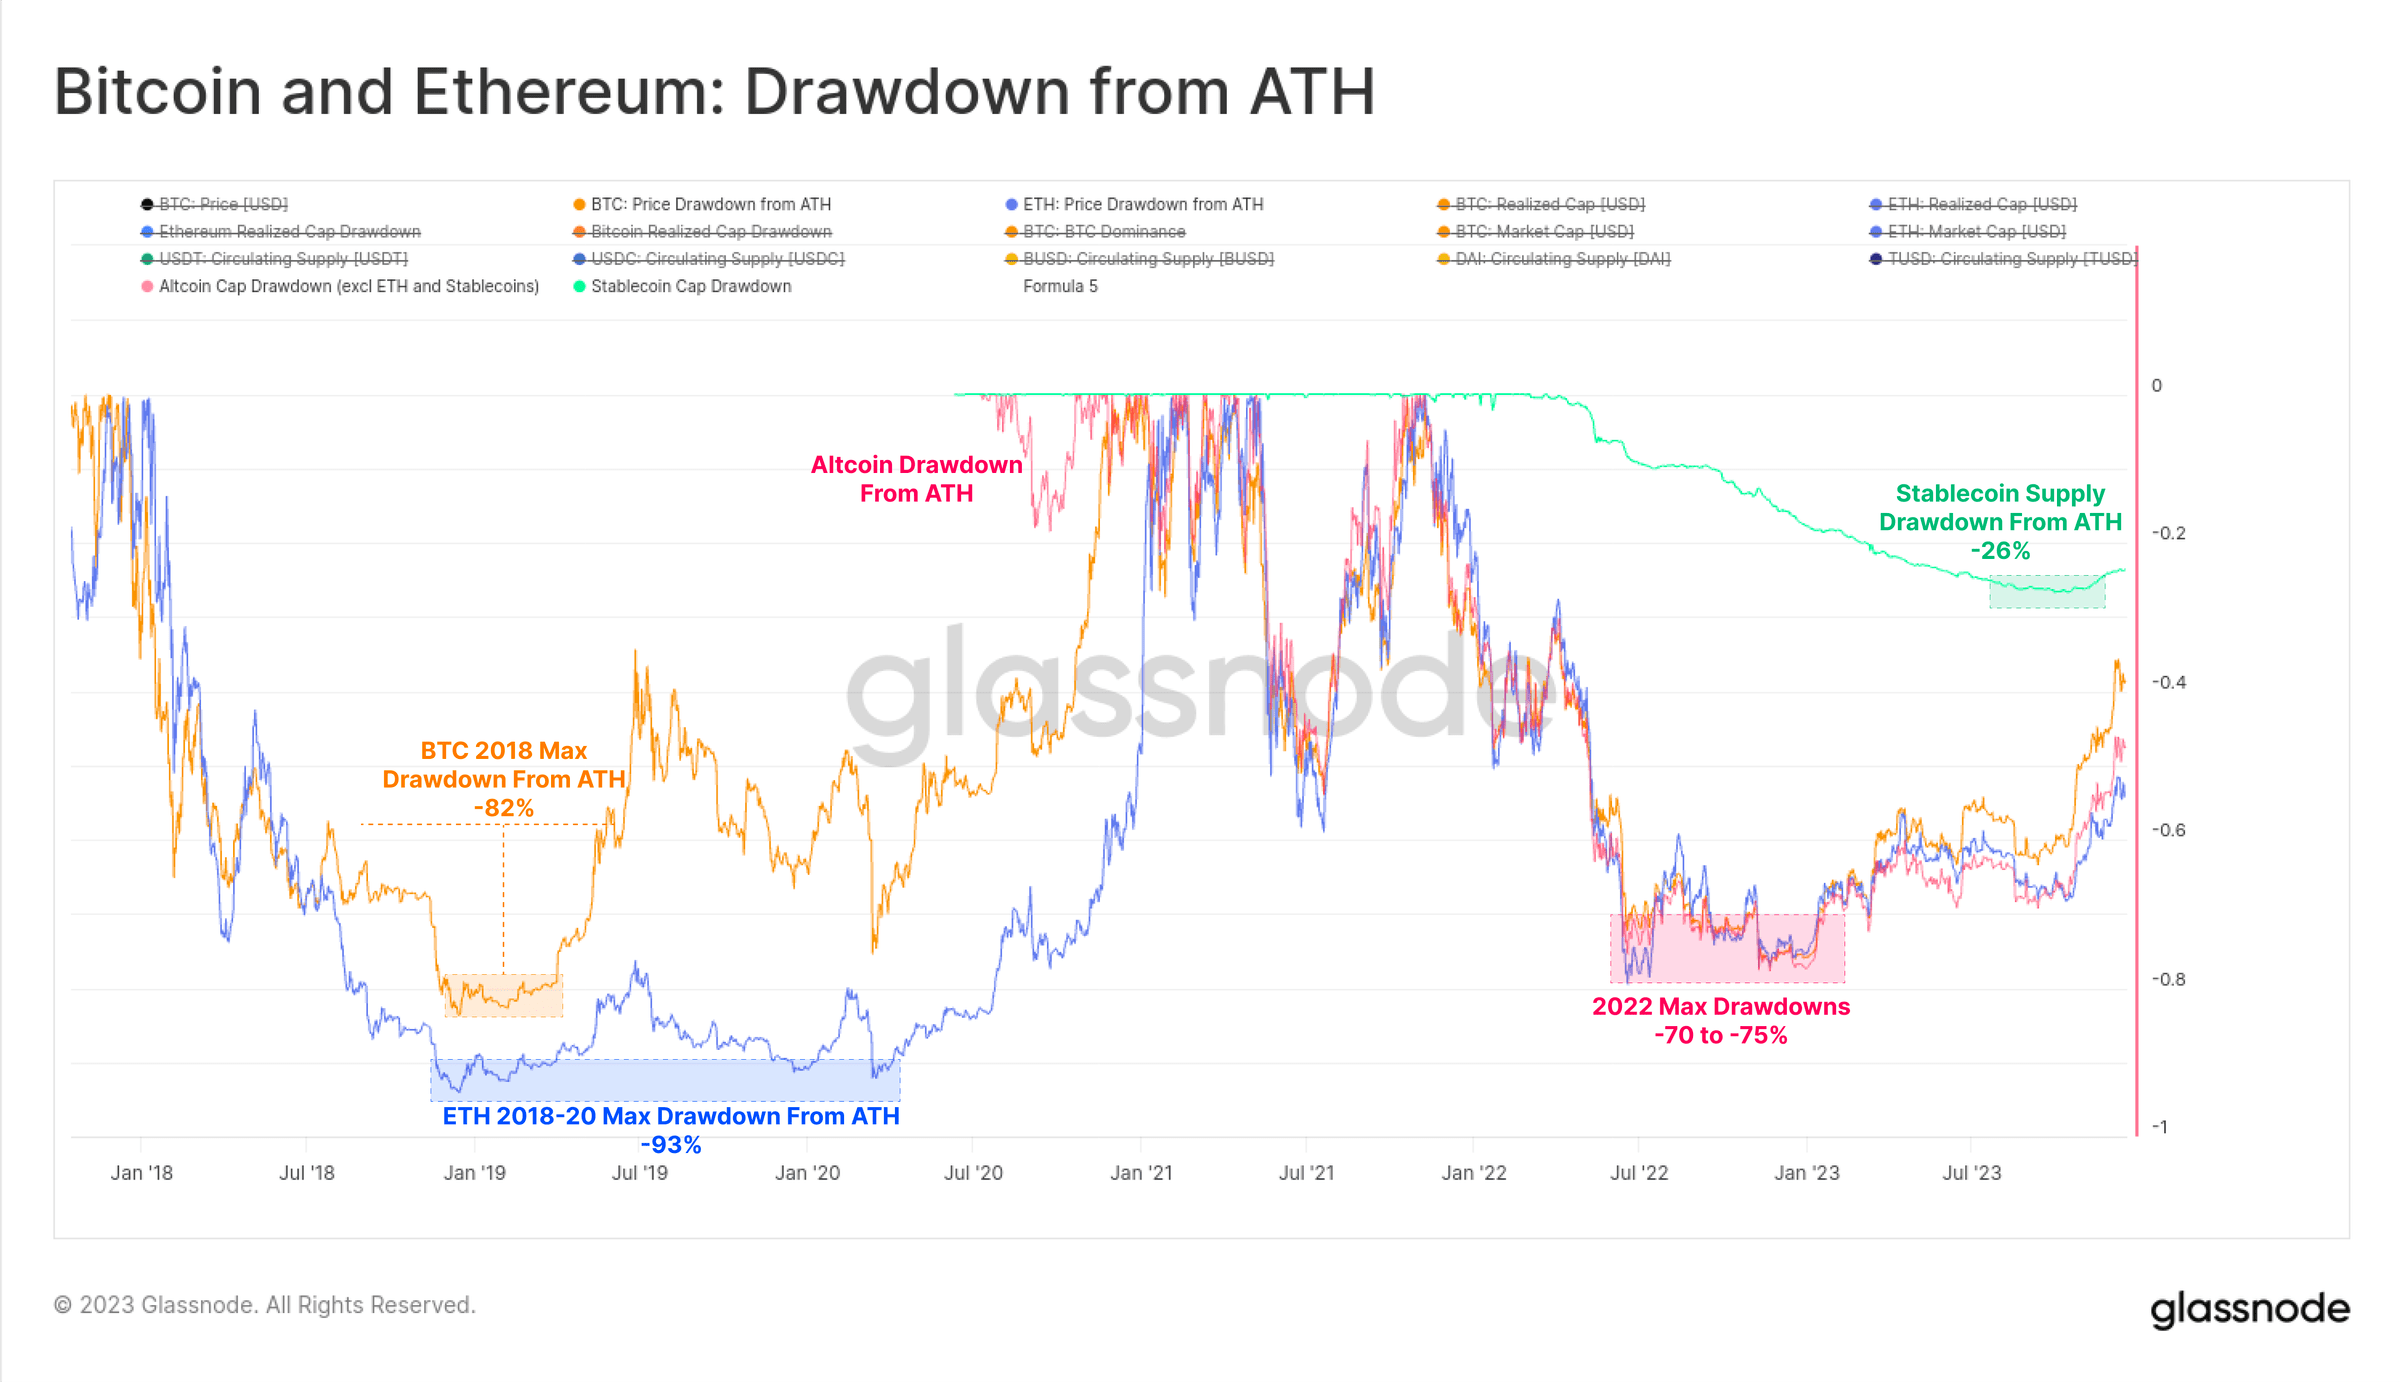 Figure 4: Bitcoin and Ethereum: ATH pullback
From an on-chain perspective, the realized market caps of BTC and ETH track their respective capital flows. The total realized market capitalization decline during the 2022 bear market reached similar levels to previous cycles, with BTC net capital outflows of 18% and ETH net capital outflows of 30%.
However, capital inflows have recovered much more slowly this year, with Bitcoin’s realized market cap reaching its ATH 715 days ago. In comparison, a full recovery in realized market cap takes about 550 days in historical cycles.
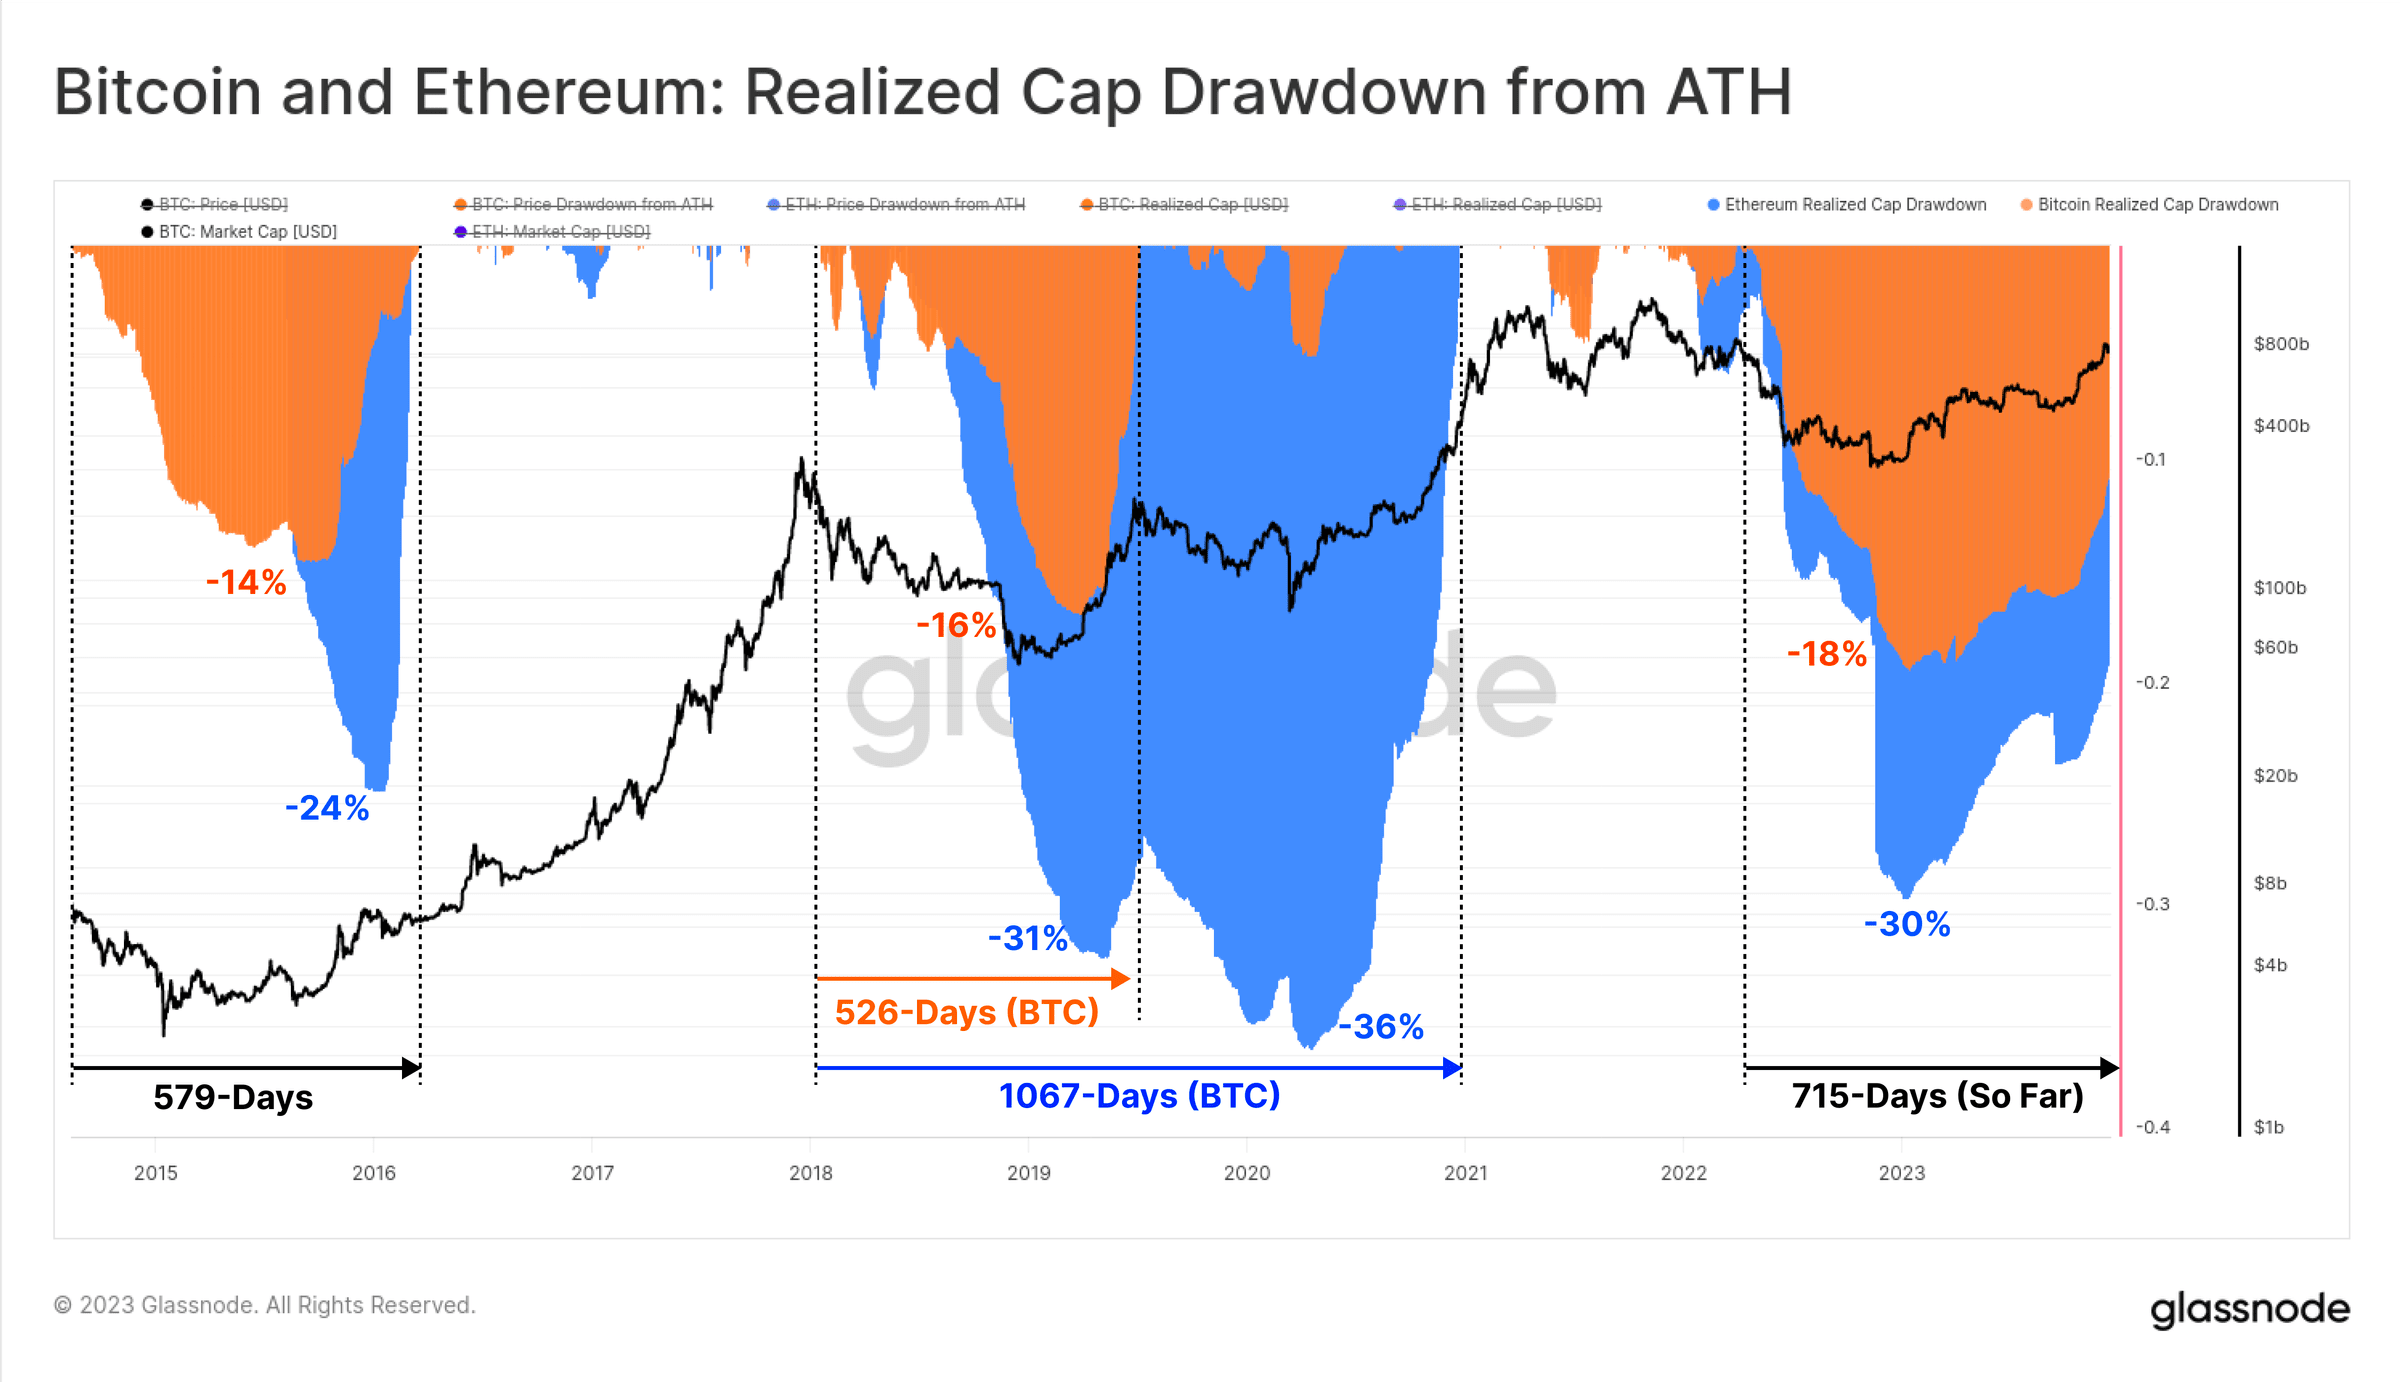 Figure 5: Bitcoin and Ethereum: Realized market cap pullback from ATH
October is a major turning point in 2023
In 2023, the Bitcoin market broke through numerous technologies and on-chain pricing models, all of which help us understand its strong momentum.
The 2023 short squeeze that began in January pushed Bitcoin above the realized price (orange), which had been preventing price increases since June 2022. This uptick also broke above the 200D-SMA (blue) until encountering resistance at the 200W-SMA (red) in March.
In August, Bitcoin price continued to consolidate between the 200D-SMA (blue) and the real market average price (green), entering one of the least volatile periods in Bitcoin history. Soon after, Bitcoin price fell from $29,000 to $26,000 in a single day and fell below the average of the two long-term technical price indicators mentioned above.
The October rally really changed the state of the market, with prices starting to recover and break above the key psychological level of $30,000. Bitcoin has since reached a yearly high of $44,500.
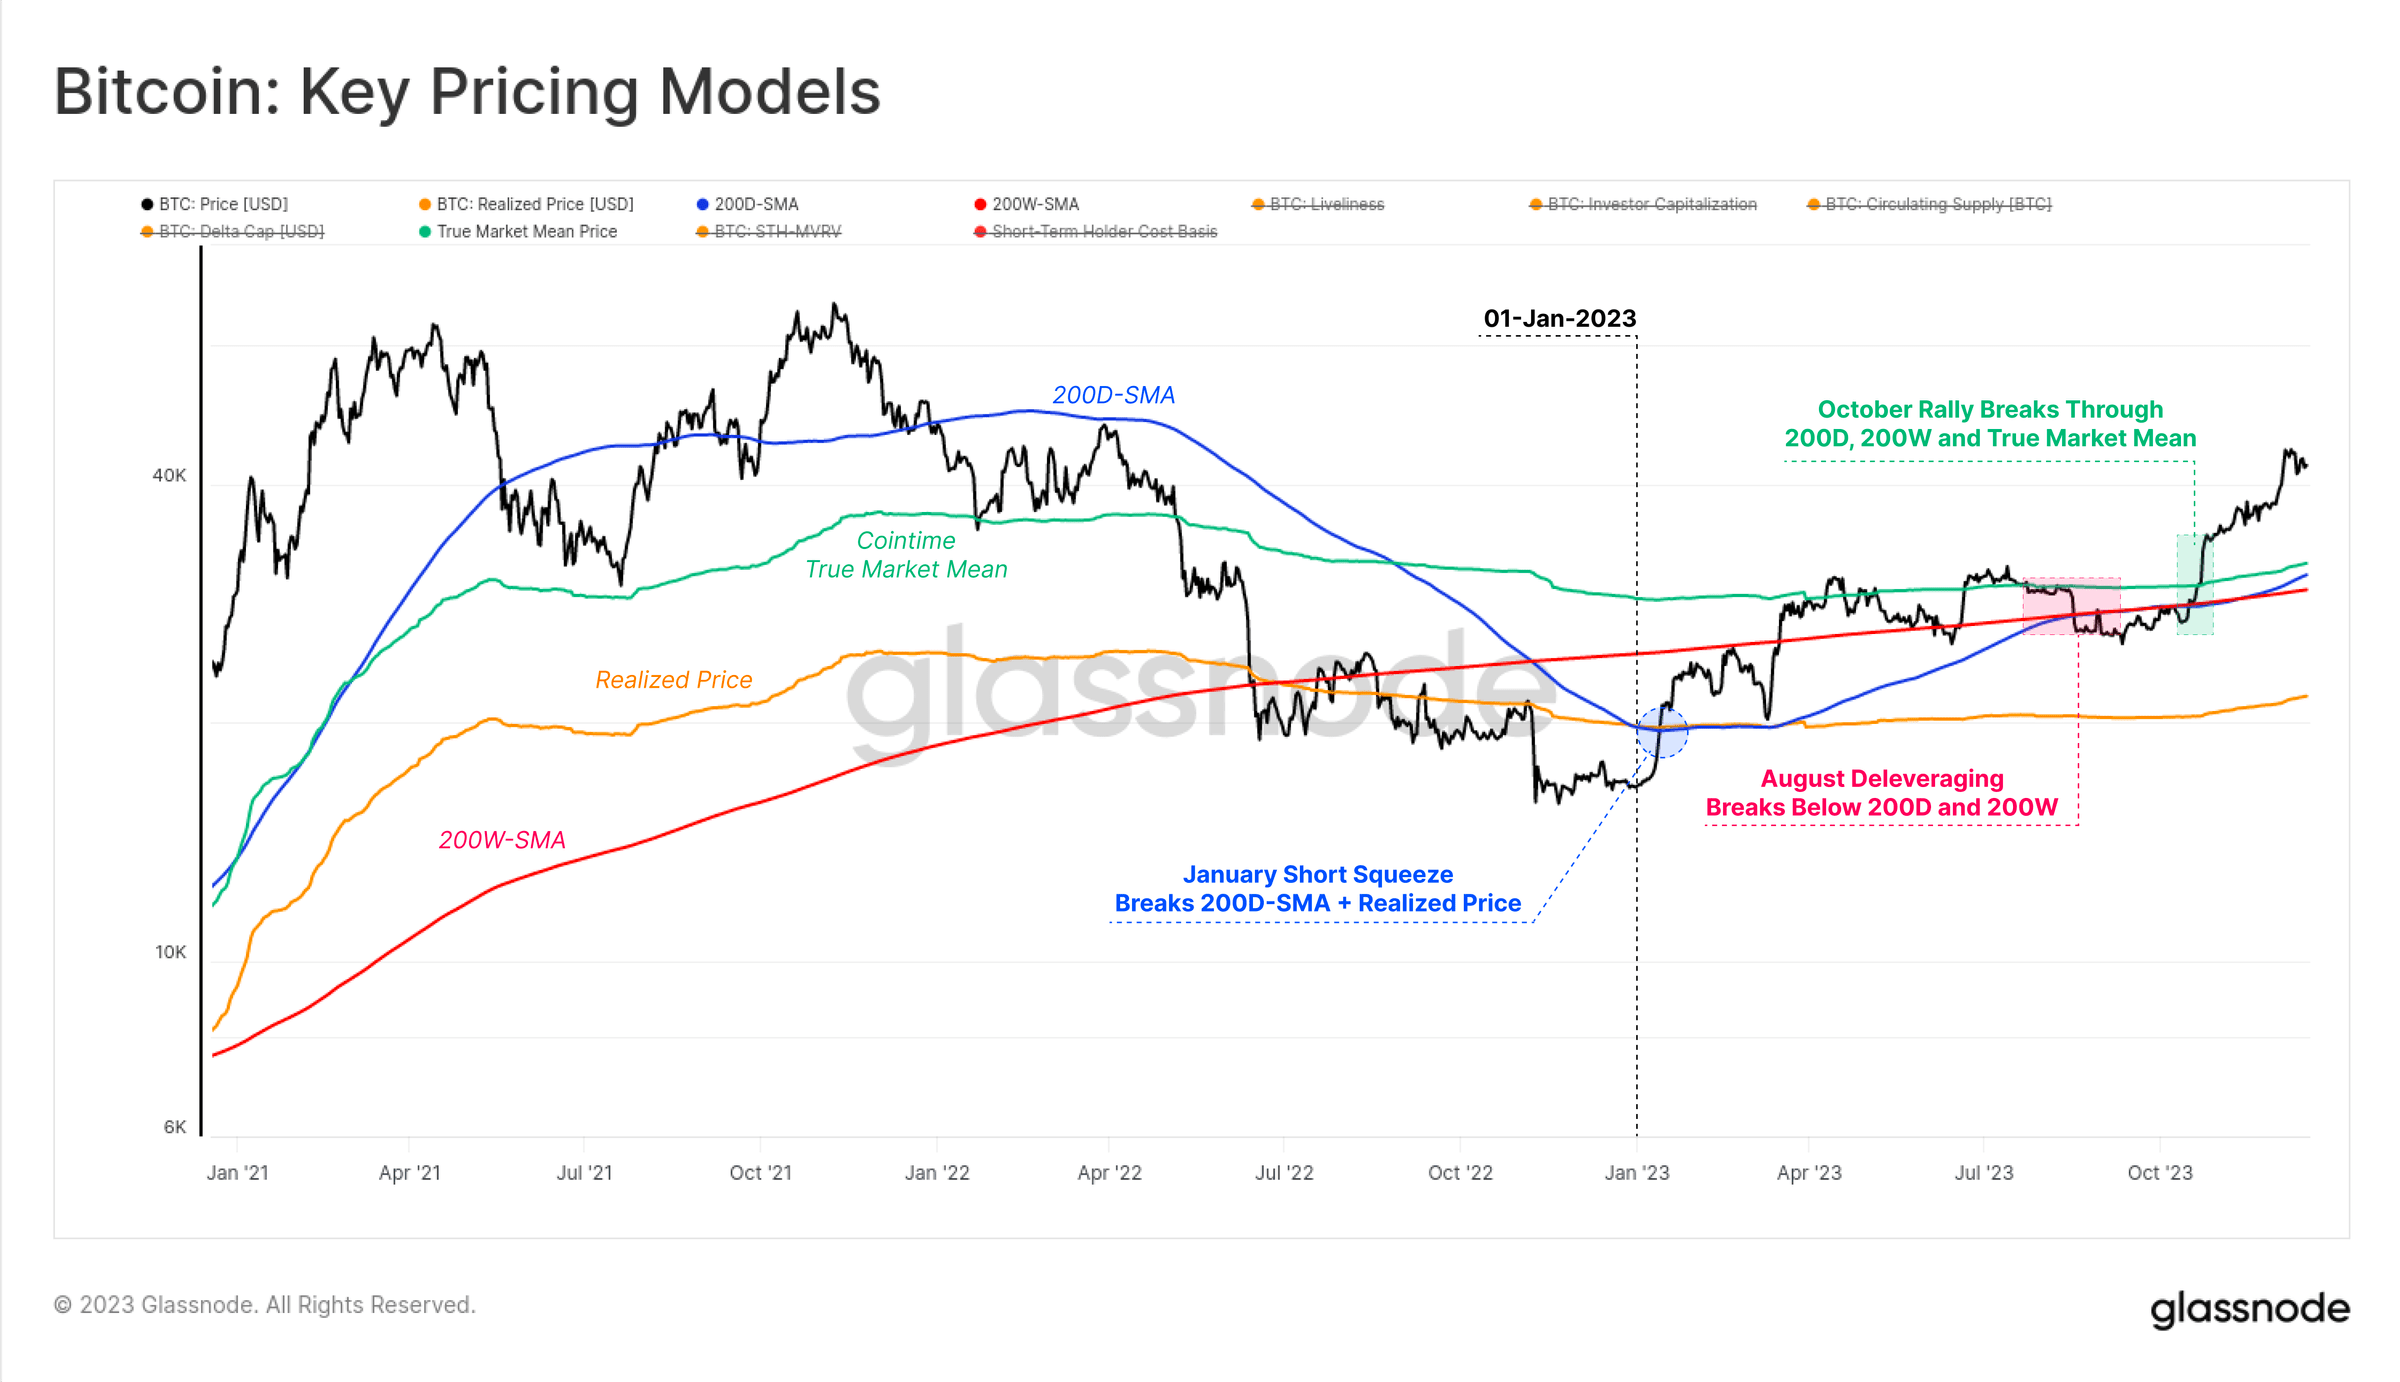 Figure 6: Bitcoin: Key Price Indicators
We have repeatedly mentioned a key node in this article: capital flows, market activity and price performance have all accelerated since the end of October. With Bitcoin price breaking through the key psychological level of $30,000, we can consider the current market to be transitioning from an “uncertain recovery” phase to an “enthusiastic uptrend.”
Notably, October’s rally broke above two important technical indicator levels that had charted this shift in previous cycles:
The technical market mid-point: A macro price level that serves as support in the early stages of a bear market and resistance in the later stages of a bear market. $30,000 was the last major support area in this bear market, and a breakdown below that was followed by a series of capitulation sell-offs that ultimately led to FTX’s collapse.
The Cointime True Market Mean Price: reflects the basic cost of active investors.
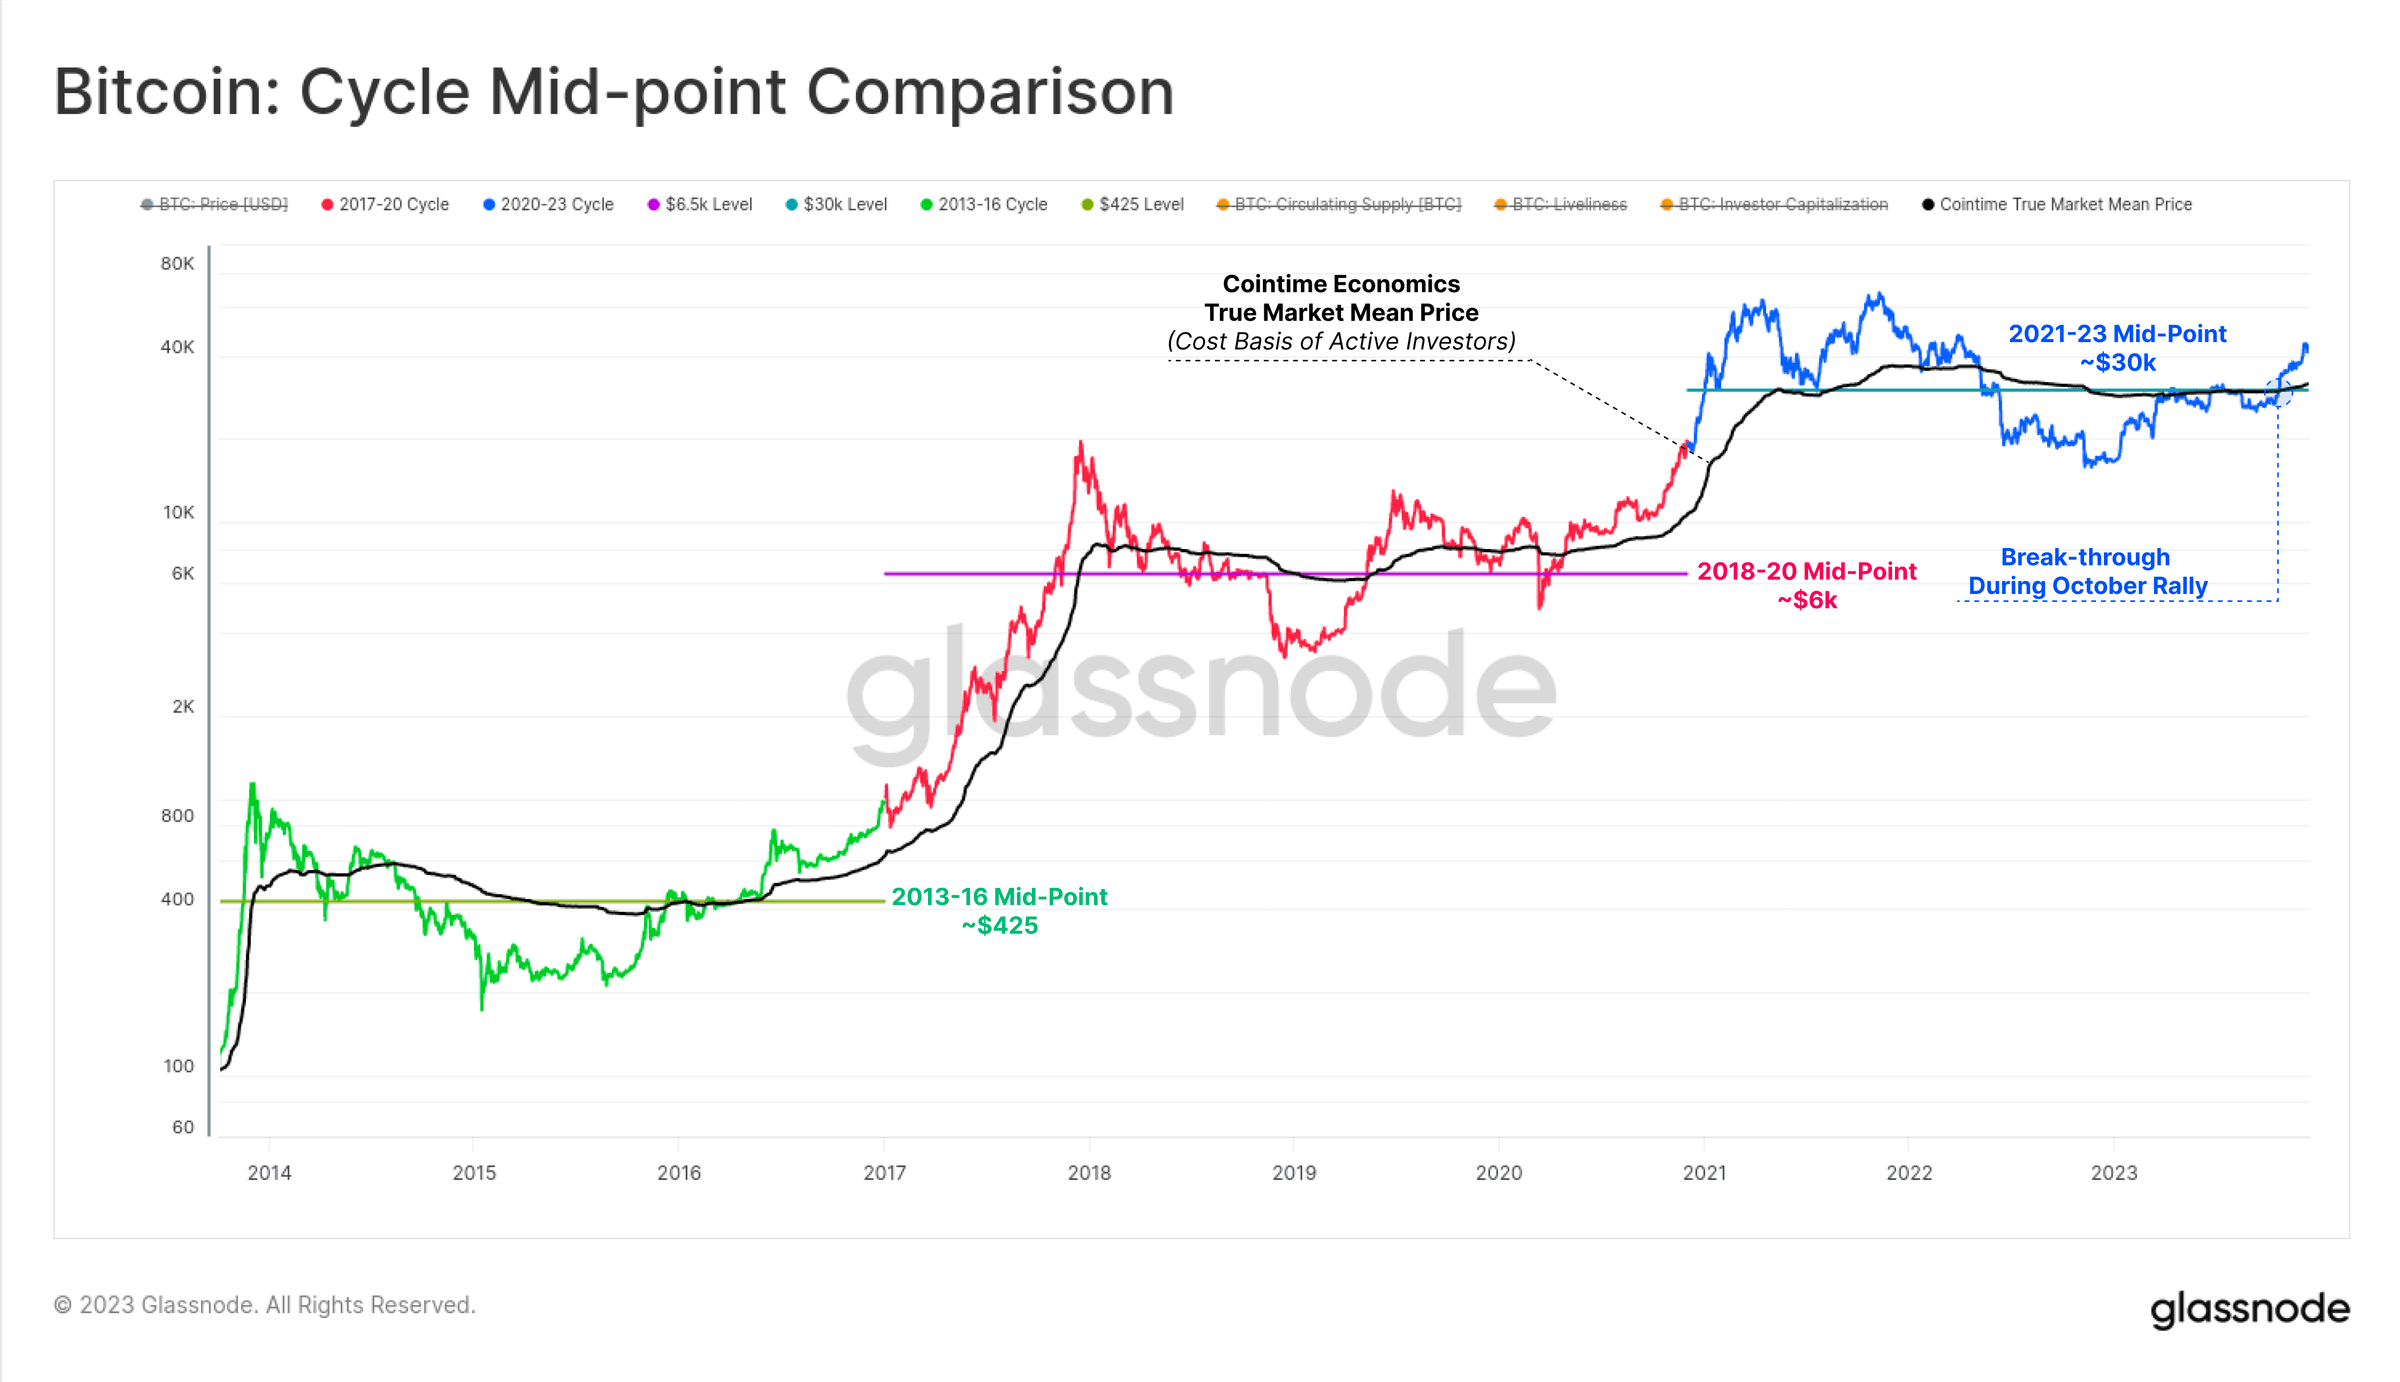 Figure 7: Cycle midpoint comparison
We can also clearly see a “Bitcoin bear market recovery” as all eight indicators (shown below) have entered positive territory since October. Data across indicators has been mixed throughout much of 2023, showing very similar characteristics to the 2019-20 period.
Eight indicators have now entered positive territory, indicating that the Bitcoin market has entered positive territory associated with a resilient uptrend.
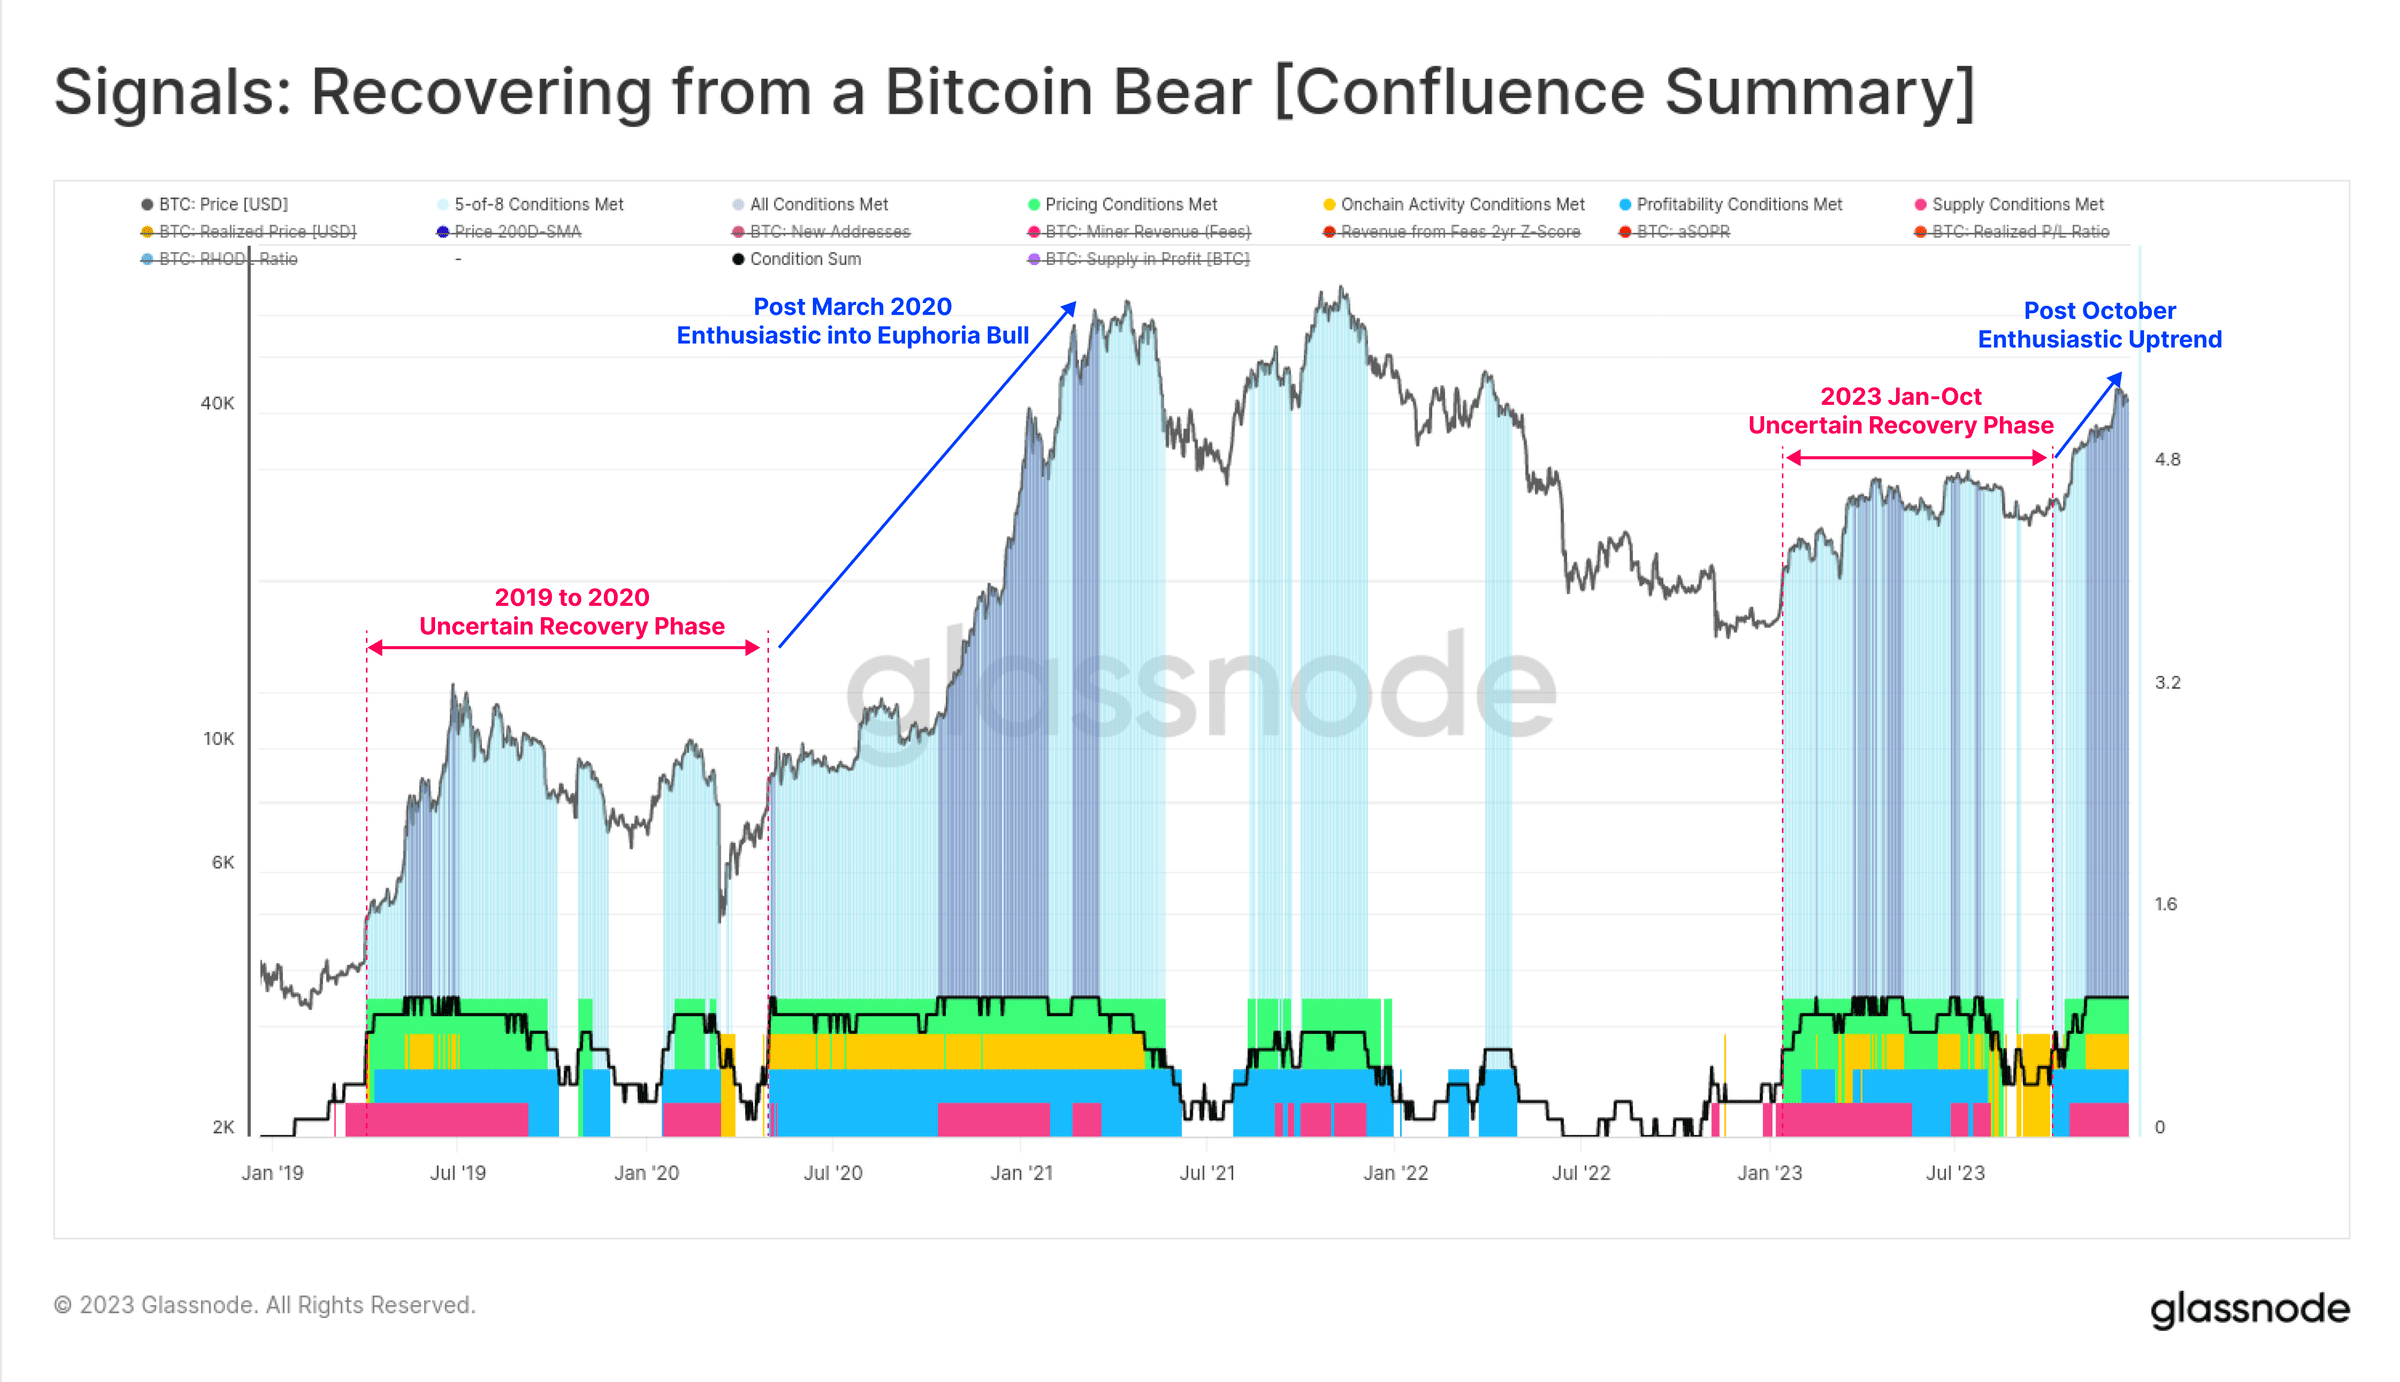 Figure 8: Signals: Recovery from Bitcoin Bear Market (Summary)
Transaction volume, fee growth and inscription appear
We can see that Bitcoin's trading volume was relatively stagnant before October, and the rise in October prompted Bitcoin's trading volume to double from $2.4 billion per day to more than $5 billion per day, the highest level since June 2022. This once again proves to us that "October is to some extent a phased shift in the market."
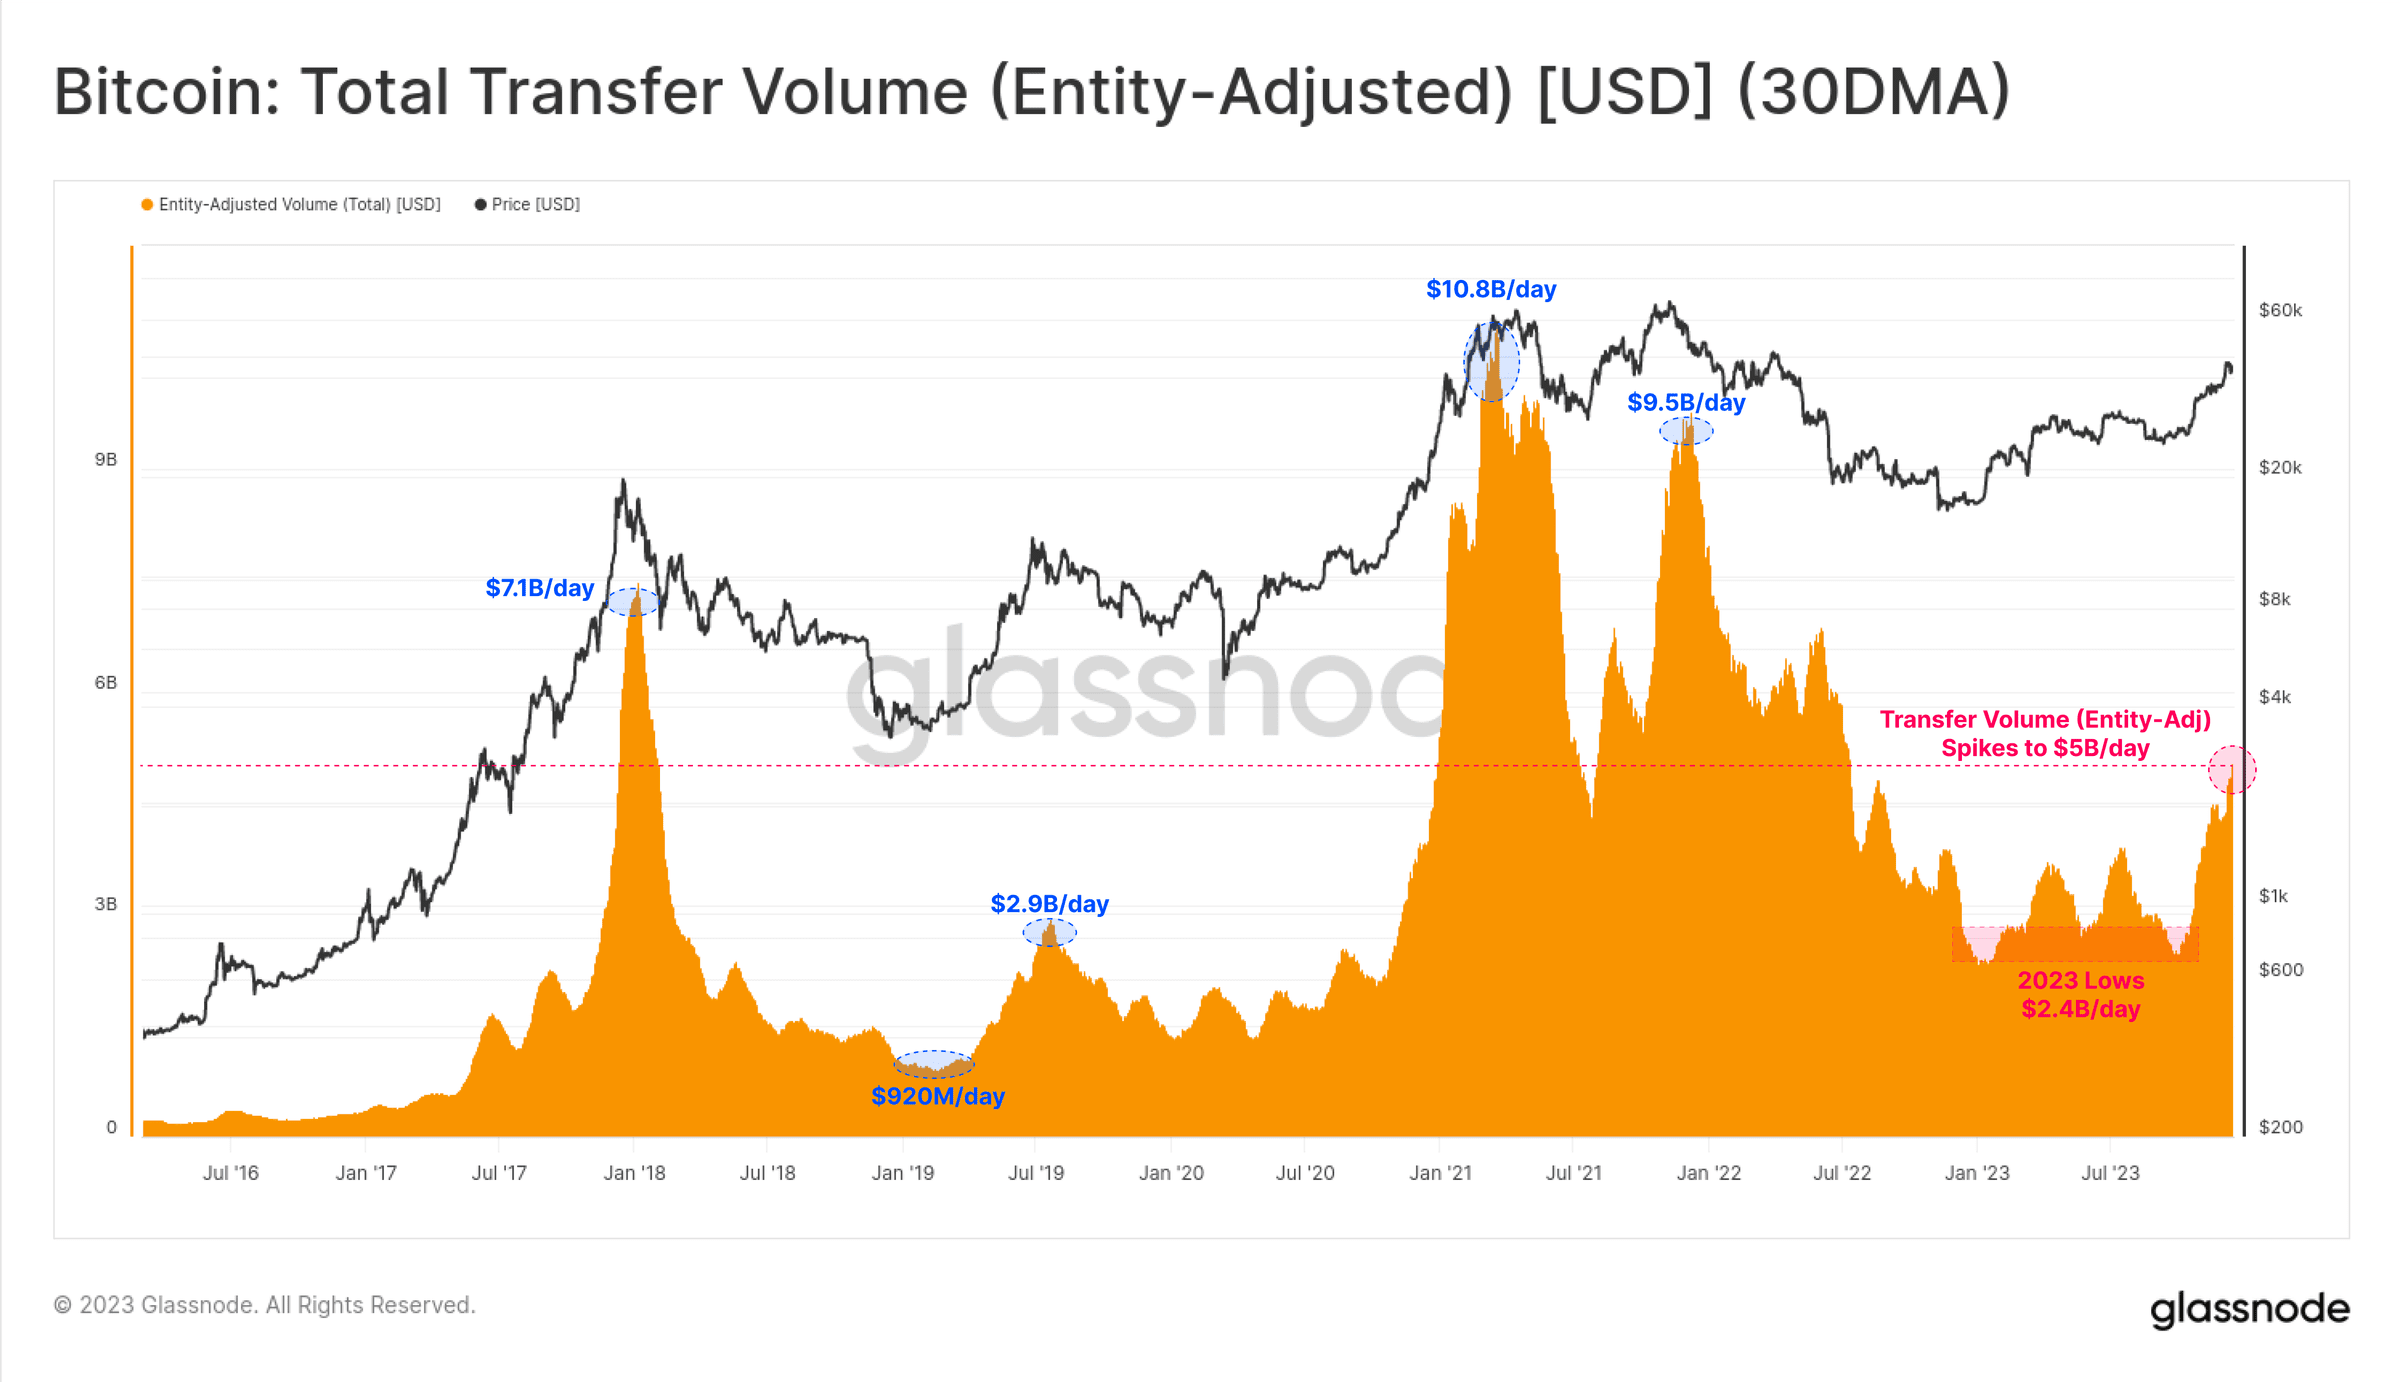 Figure 9: Bitcoin: Total Transaction Volume (Entity Adjusted) (30-Day EMA)
Trading platform inflows and outflows increased for Bitcoin and Ethereum in 2023, indicating increased interest in spot trading. Notably, Bitcoin transaction volume is growing significantly faster than Ethereum transaction volume, which is consistent with observations of Bitcoin’s rising dominance. What we often see after a prolonged bear market is Bitcoin leading investor confidence out of the doldrums, and the chart below helps visualize this phenomenon.
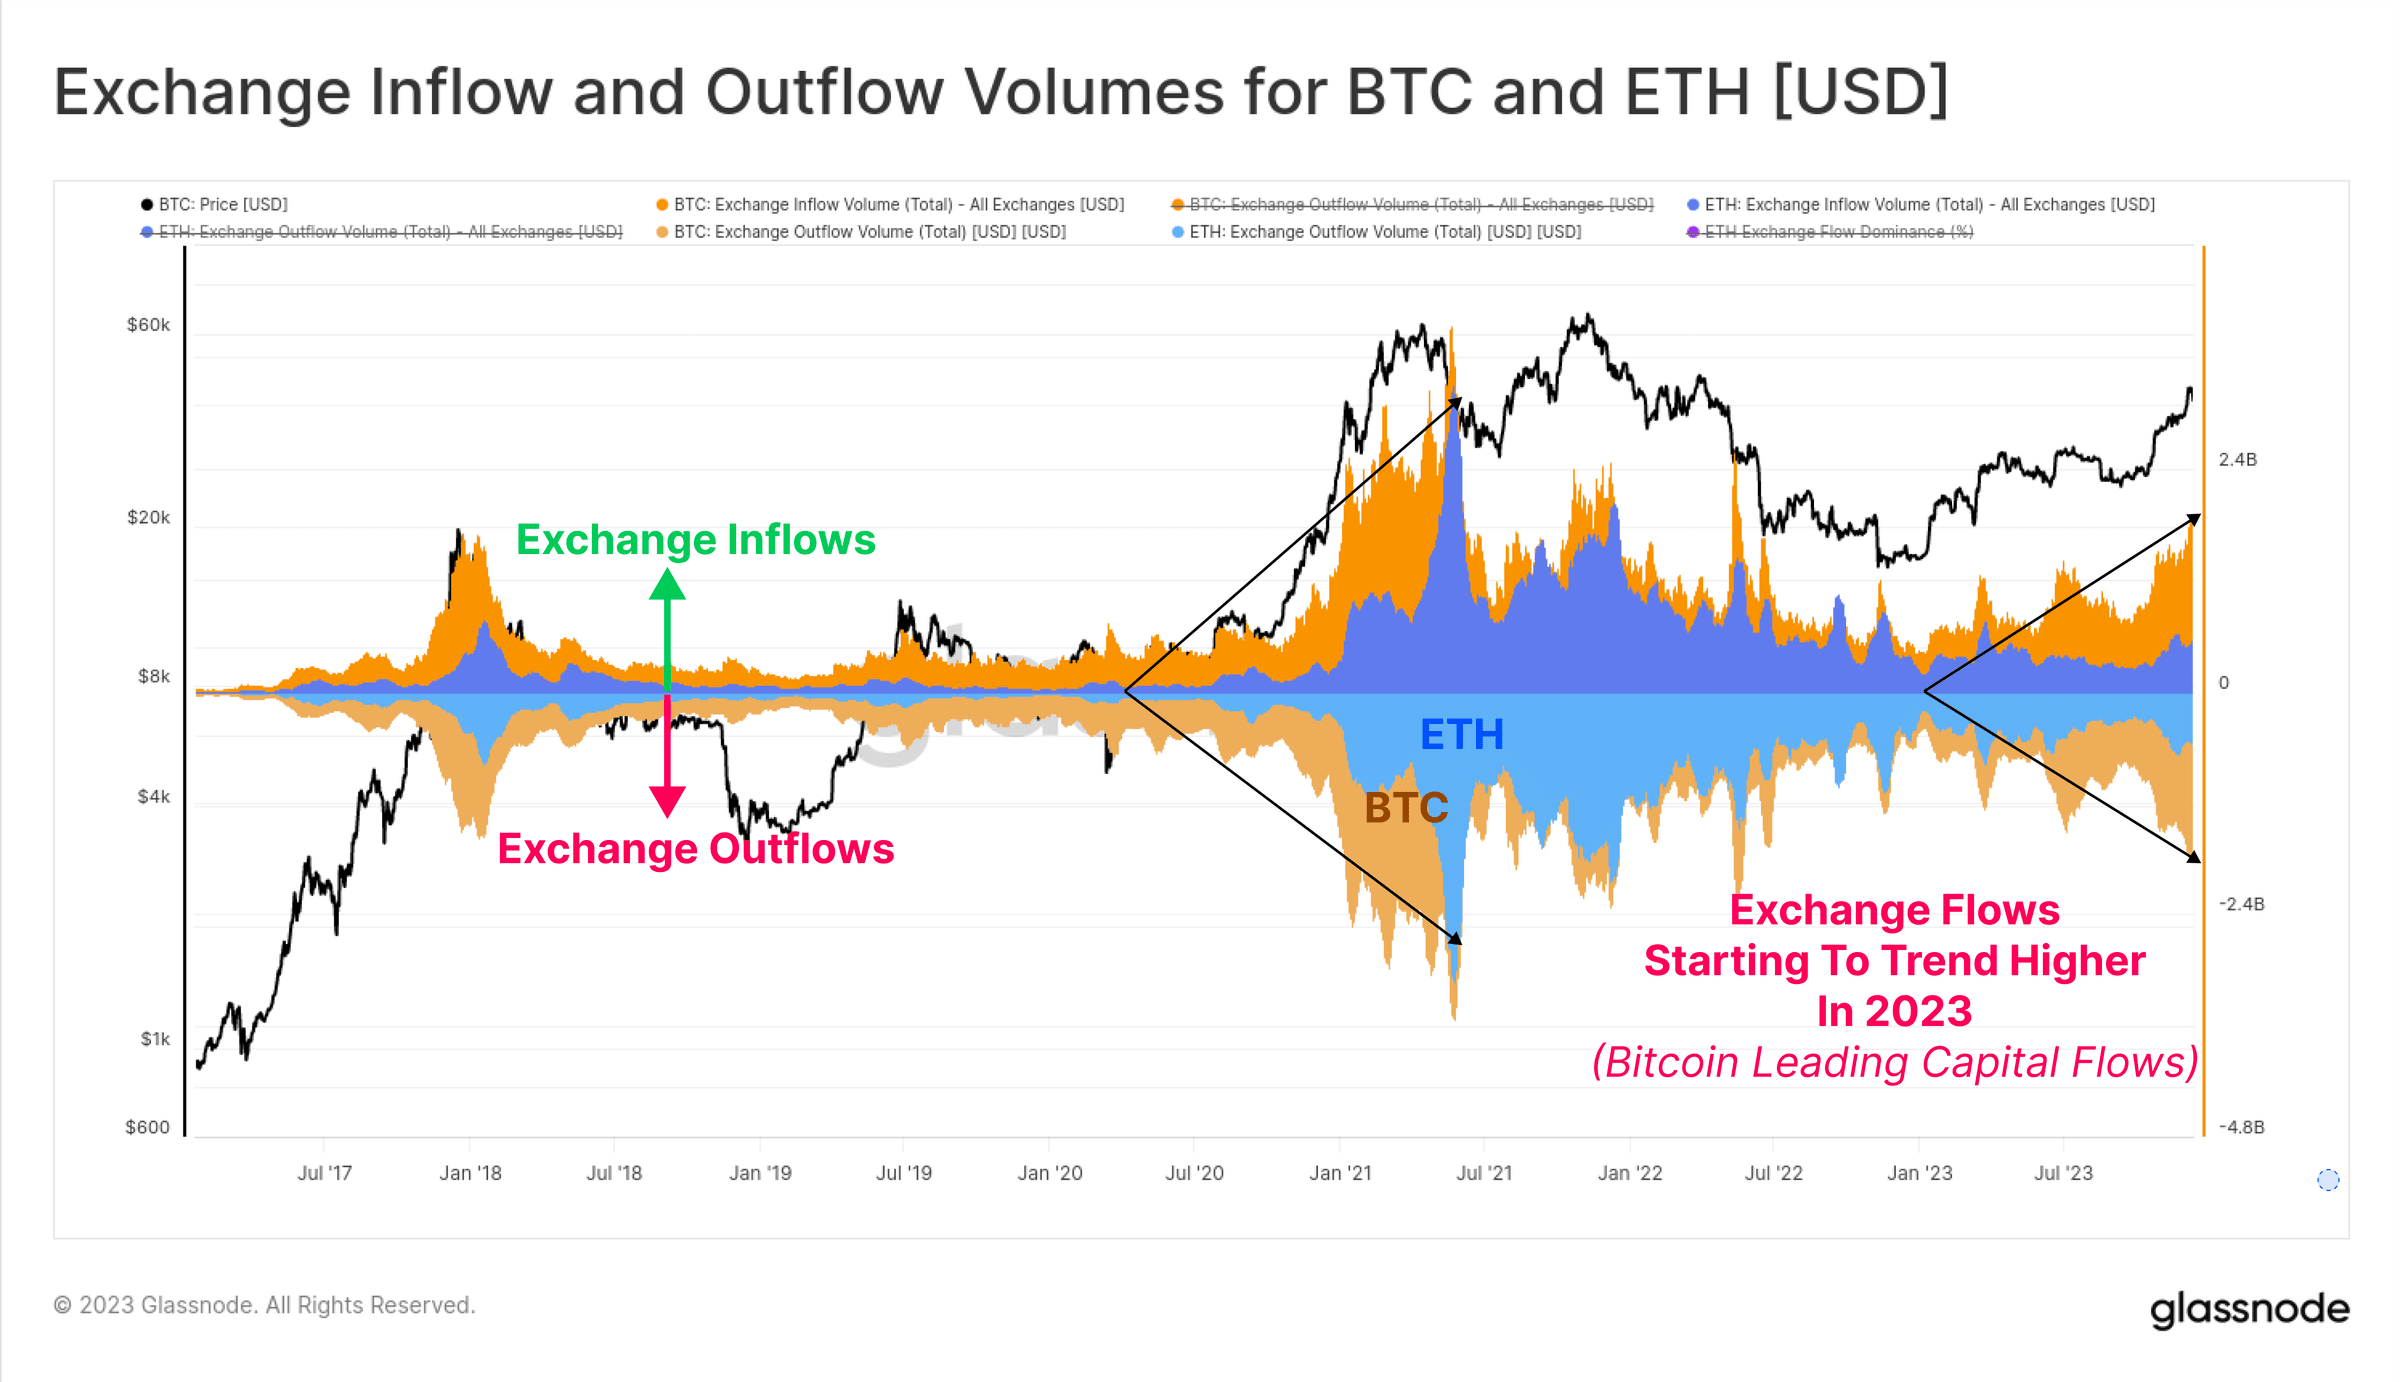 Figure 10: Bitcoin and Ethereum trading platform inflows and outflows
In 2023, the number of Bitcoin transactions reached an all-time high, mainly due to the emergence of Ordinals and Inscriptions. These transactions embed data such as text files and images into the signature portion of the transaction.
Therefore, we can now evaluate two types of Bitcoin transactions:
(Orange) Total transaction count (unfiltered).
(Blue) Bitcoin transaction volume has reached a multi-year high, almost reaching an all-time high of 372,500 transactions/day.
(Red) Inscription transactions add an additional 175,000 to 356,000 transactions per day on top of Bitcoin transactions.
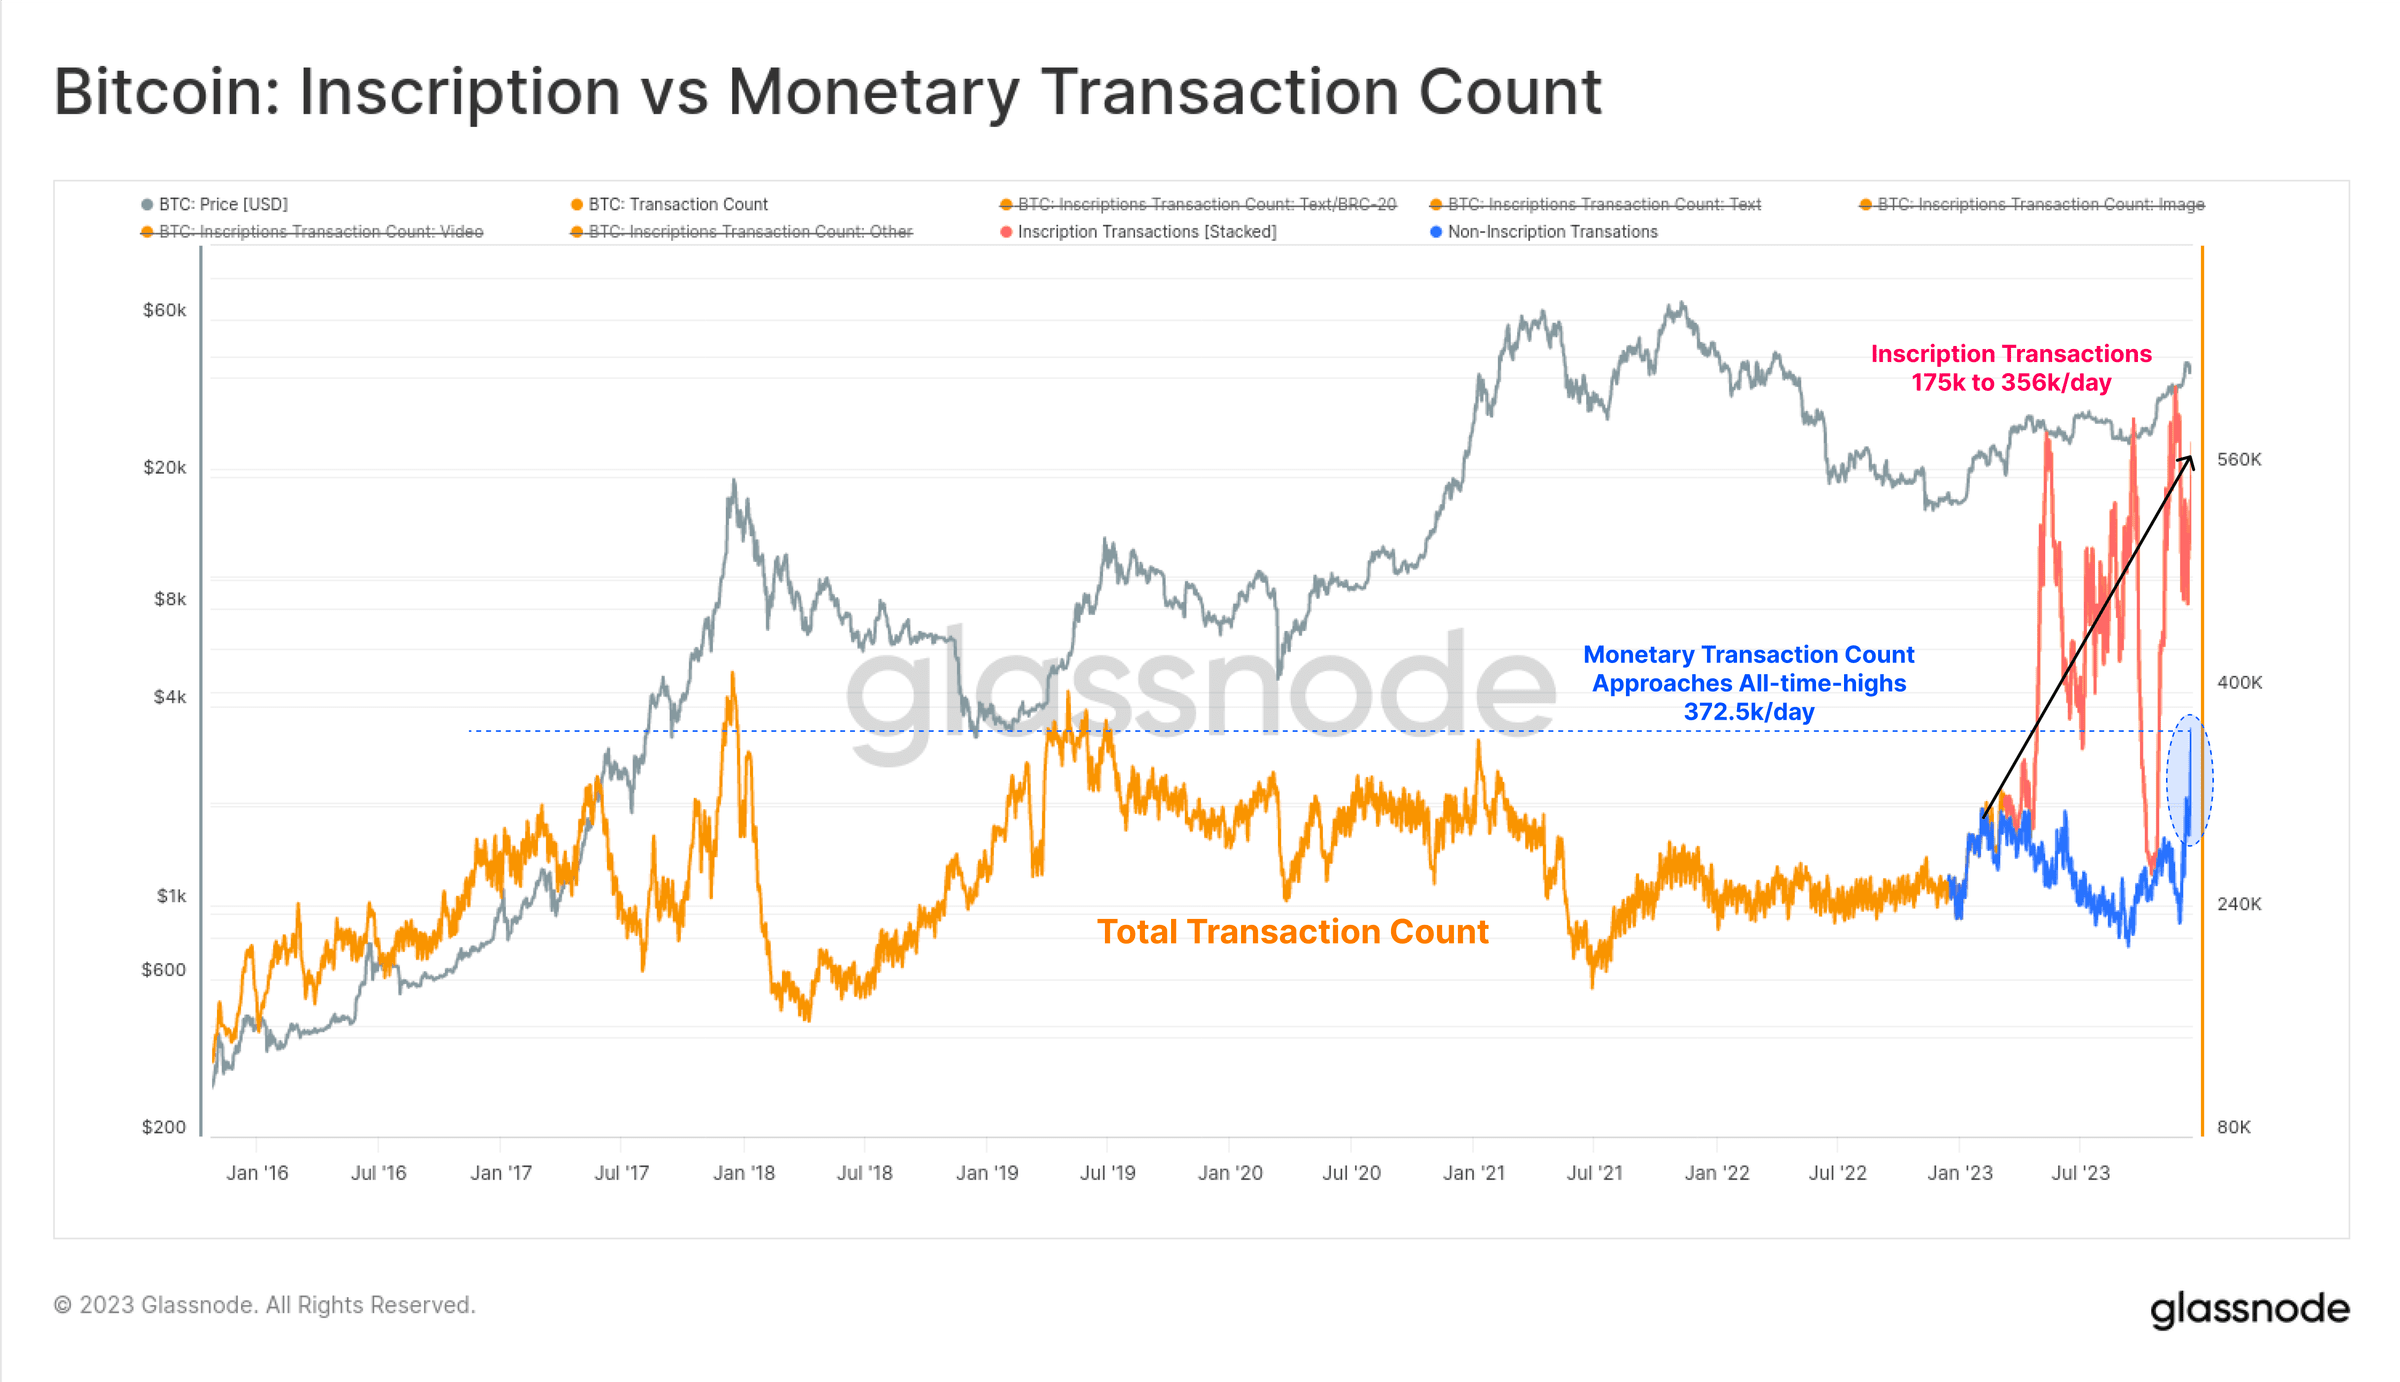 Figure 11: Bitcoin: Inscription vs Bitcoin Transaction Volume
The vast majority of inscriptions tend to be text-based, related to a new asset (blue) standard called BRC-20. At its peak, the number of daily inscription transactions on the Bitcoin chain exceeded 300,000, far exceeding the April peak of 172,000 per day for image-based inscriptions (orange) (the images are larger, so as fees increase, the cost higher).
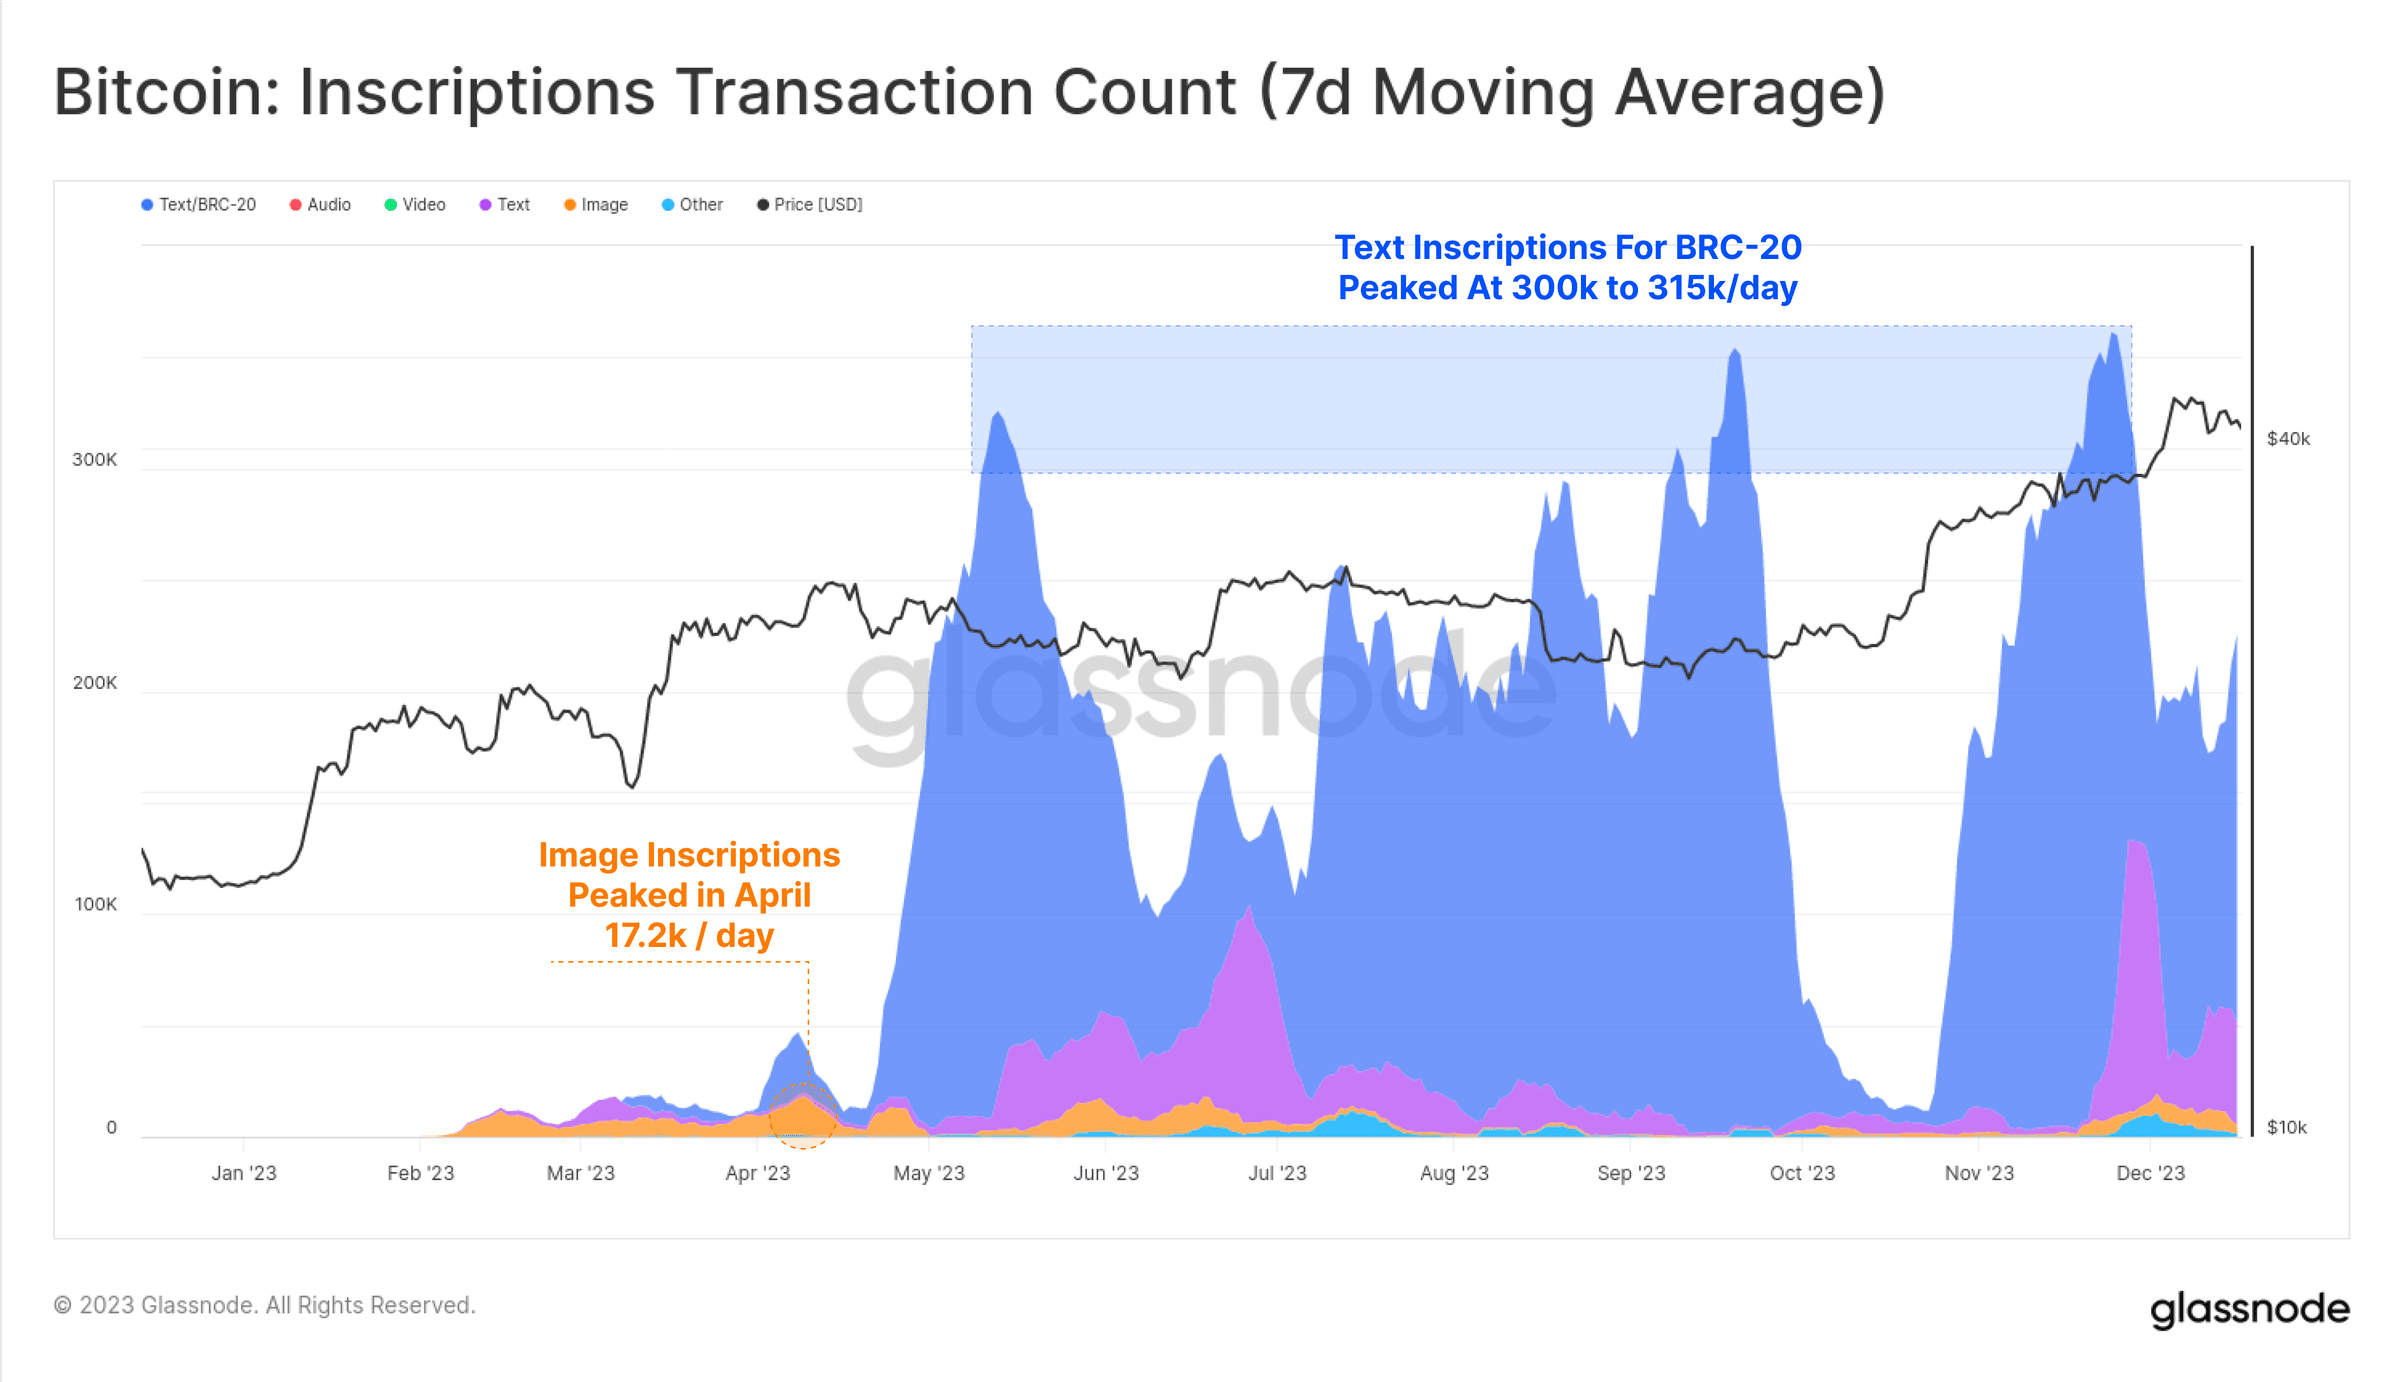 Figure 12: Bitcoin: Number of Inscription transactions (7-day moving average)
Inscription, the new buyer of Bitcoin block space, has given miners a significant increase in fee income, with several blocks in 2023 paying more than the 6.25 BTC block reward. There have been two major fee hikes this year, and fees now account for about a quarter of miners' income. This is comparable to the euphoric phases of the 2017 and 2021 bull markets.
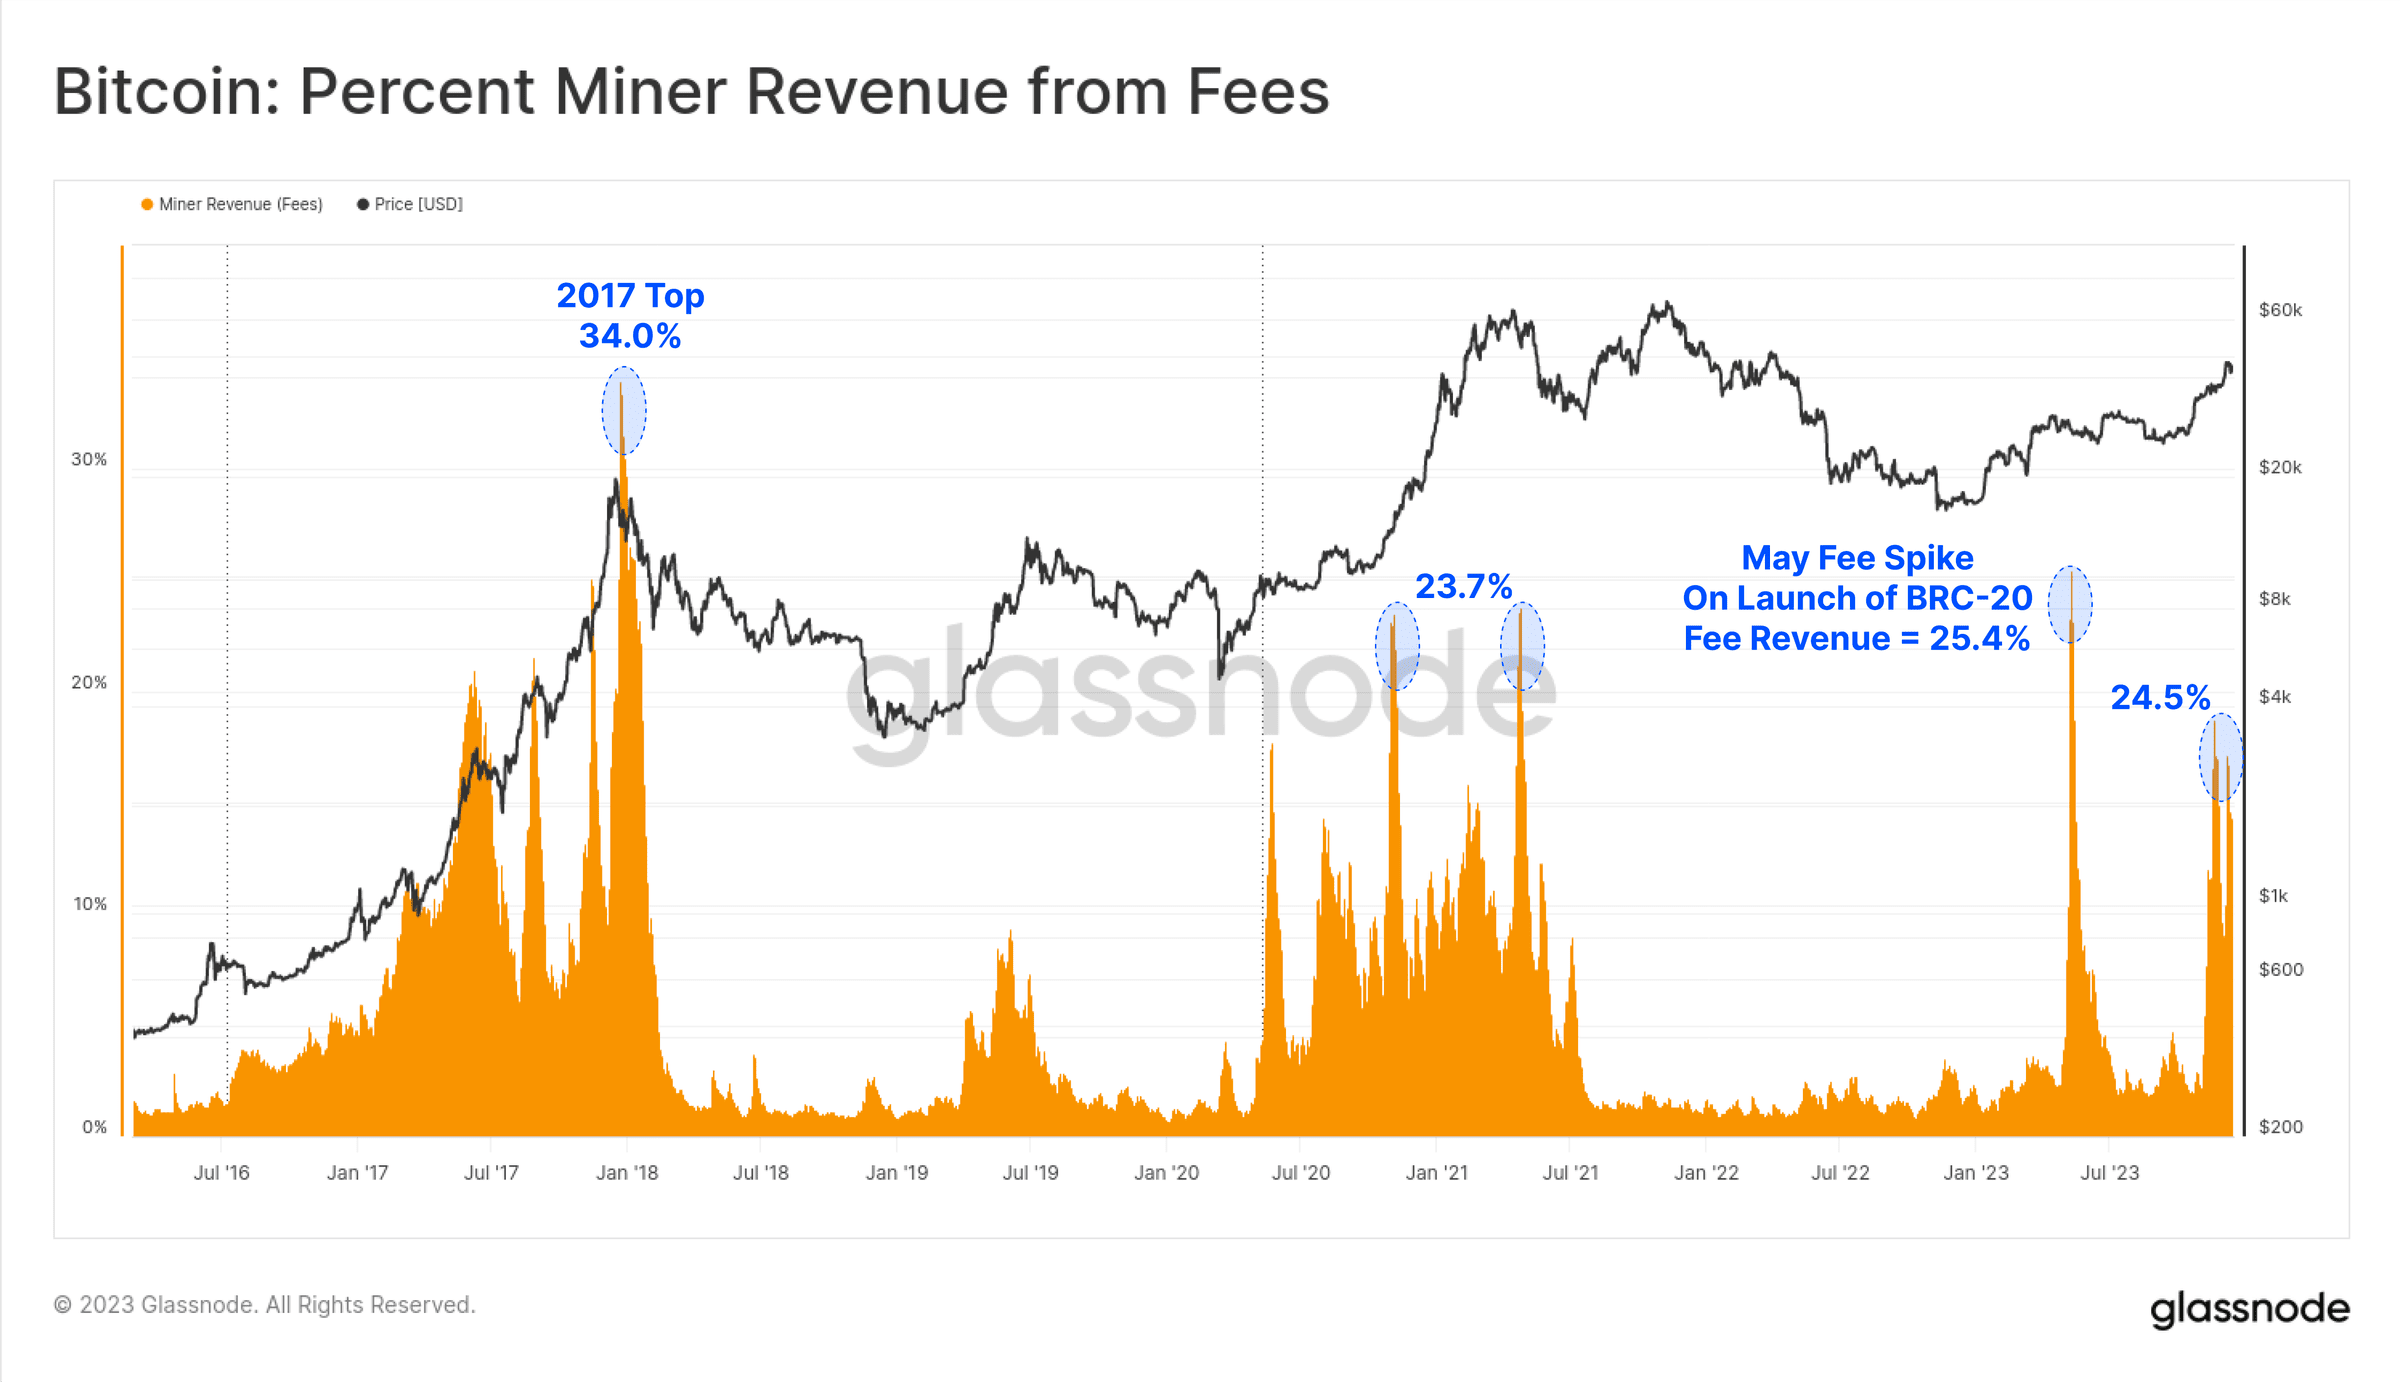 Figure 13: Proportion of miners’ fee income
Interestingly, while Inscription transaction volume accounts for approximately 50% of confirmed transactions, they surprisingly only occupy around 10% to 15% of the block space. This is due to smaller text files and the data discount with SegWit.
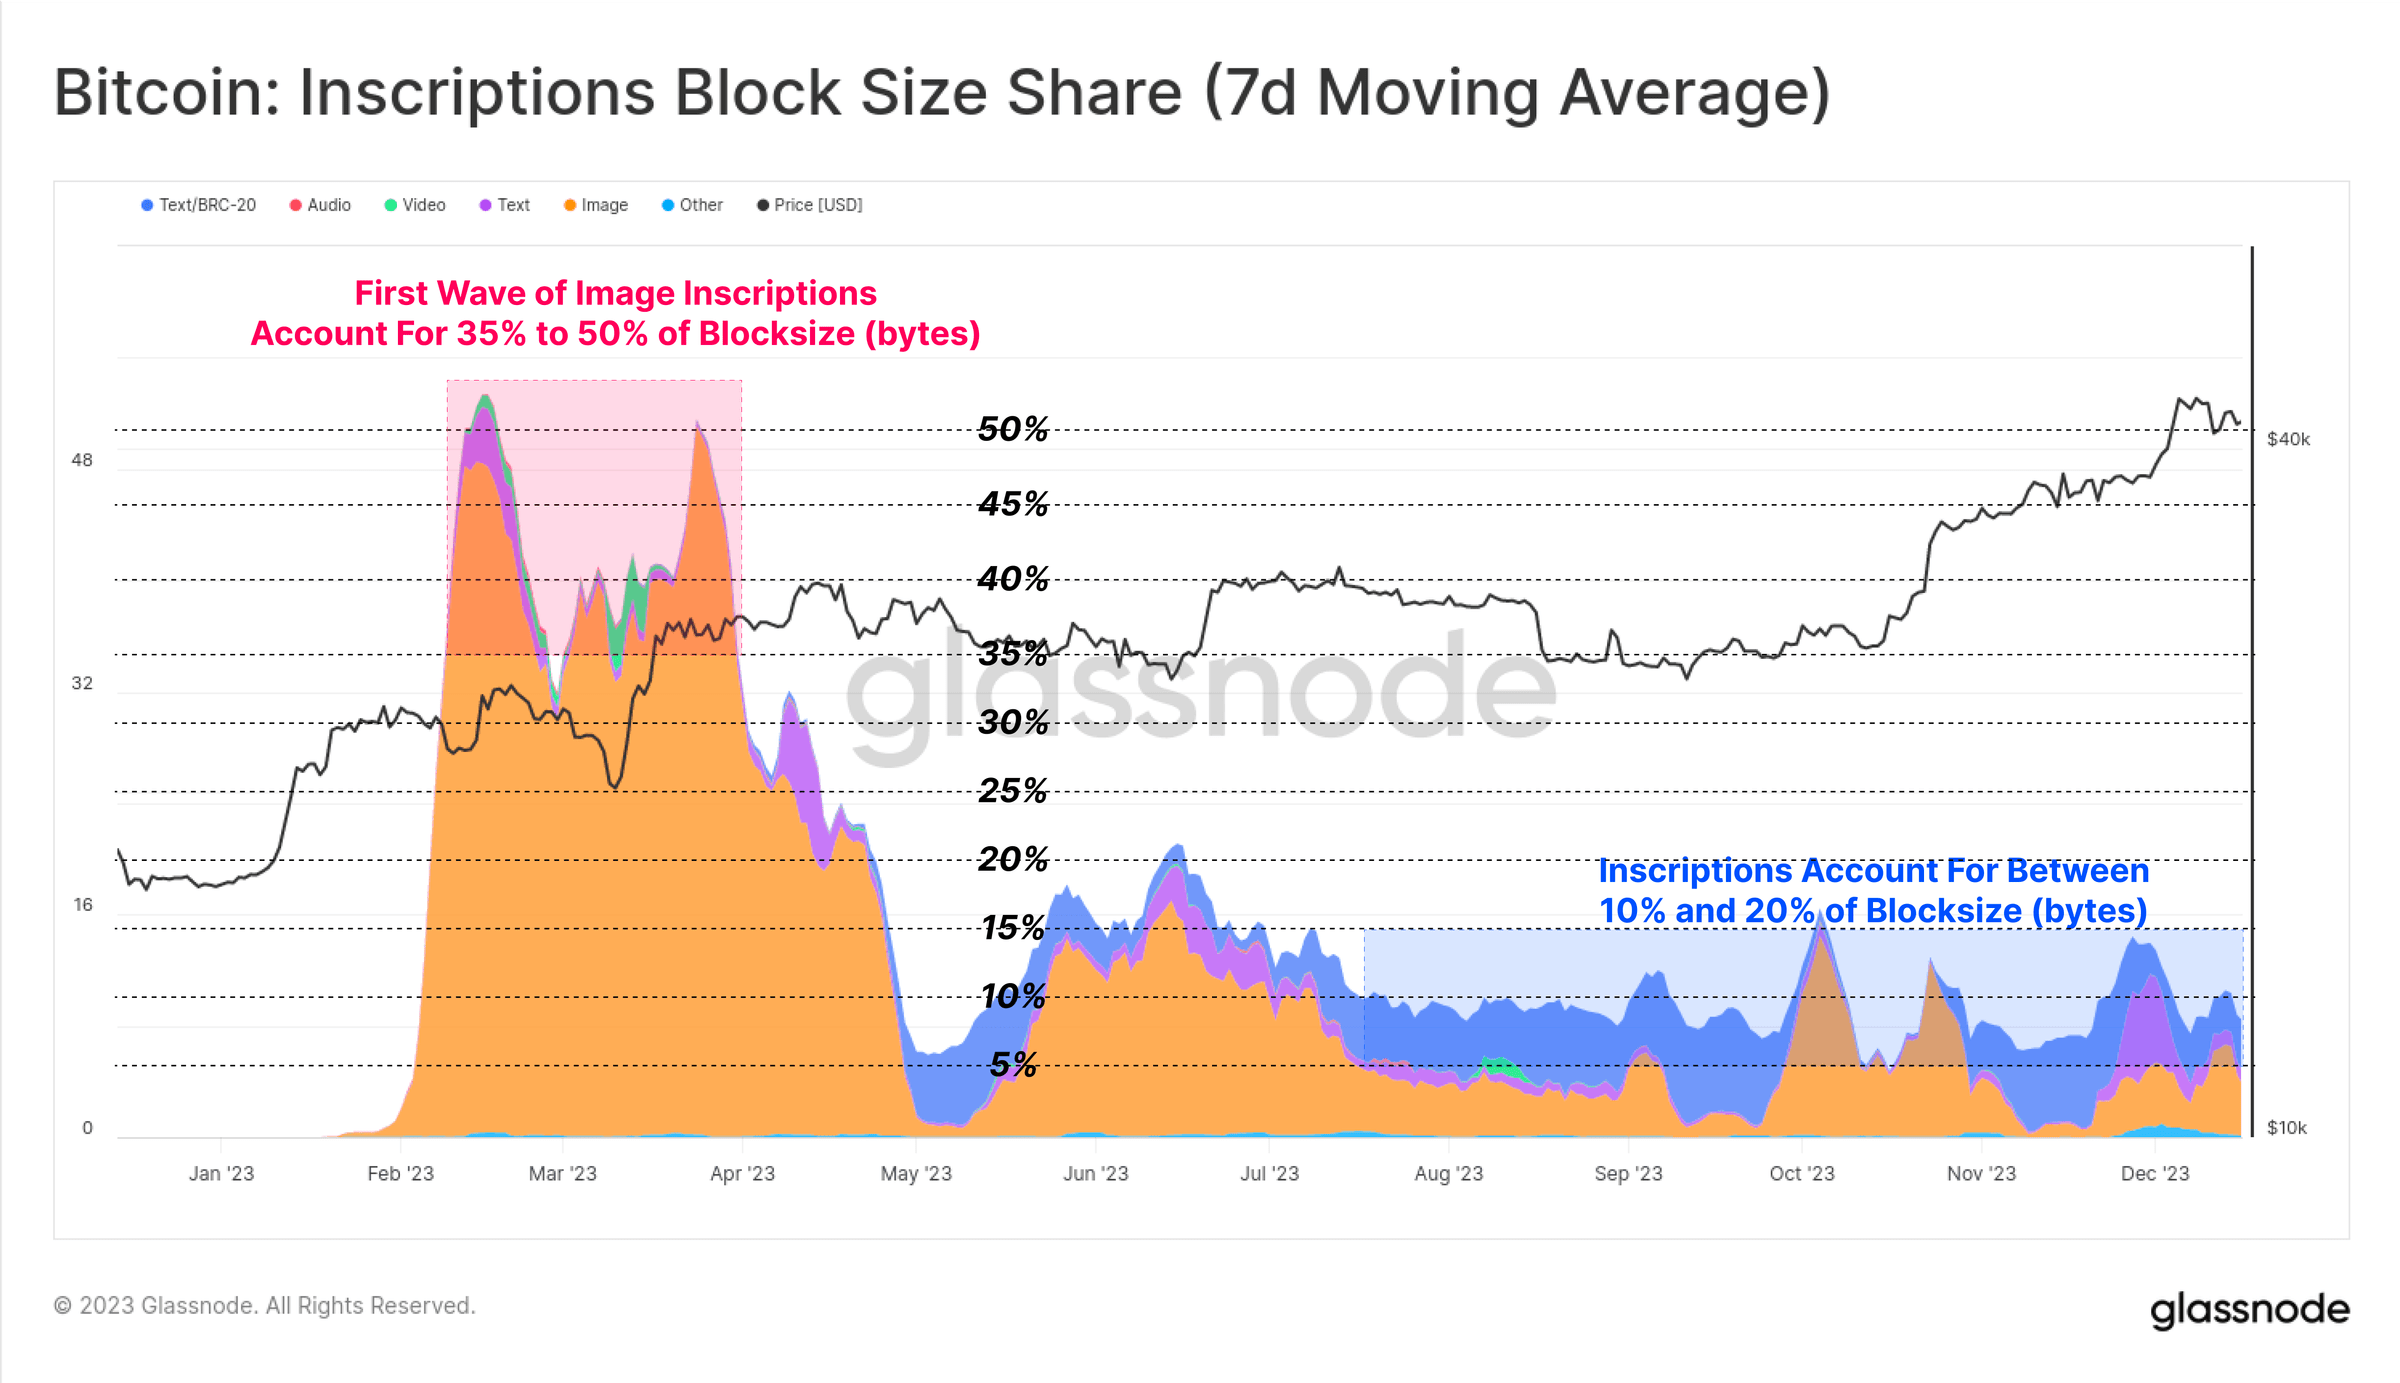 Figure 14: Bitcoin: Inscription block size share (7-day moving average)
This year, Inscription contributed 15% to 30% of total mining transaction fee revenue. This intuitively represents the characteristics of SegWit data discounting, where inscription transactions consume a small portion of the block space (in bytes), paying a significant proportion of fees, but also account for about half of all confirmed transactions.
In effect, Inscription and SegWit data discounts allow miners to put more transactions into the same max block and thus pay more. If market demand for inscriptions persists, it may improve miners’ returns, especially with the fourth halving approaching.
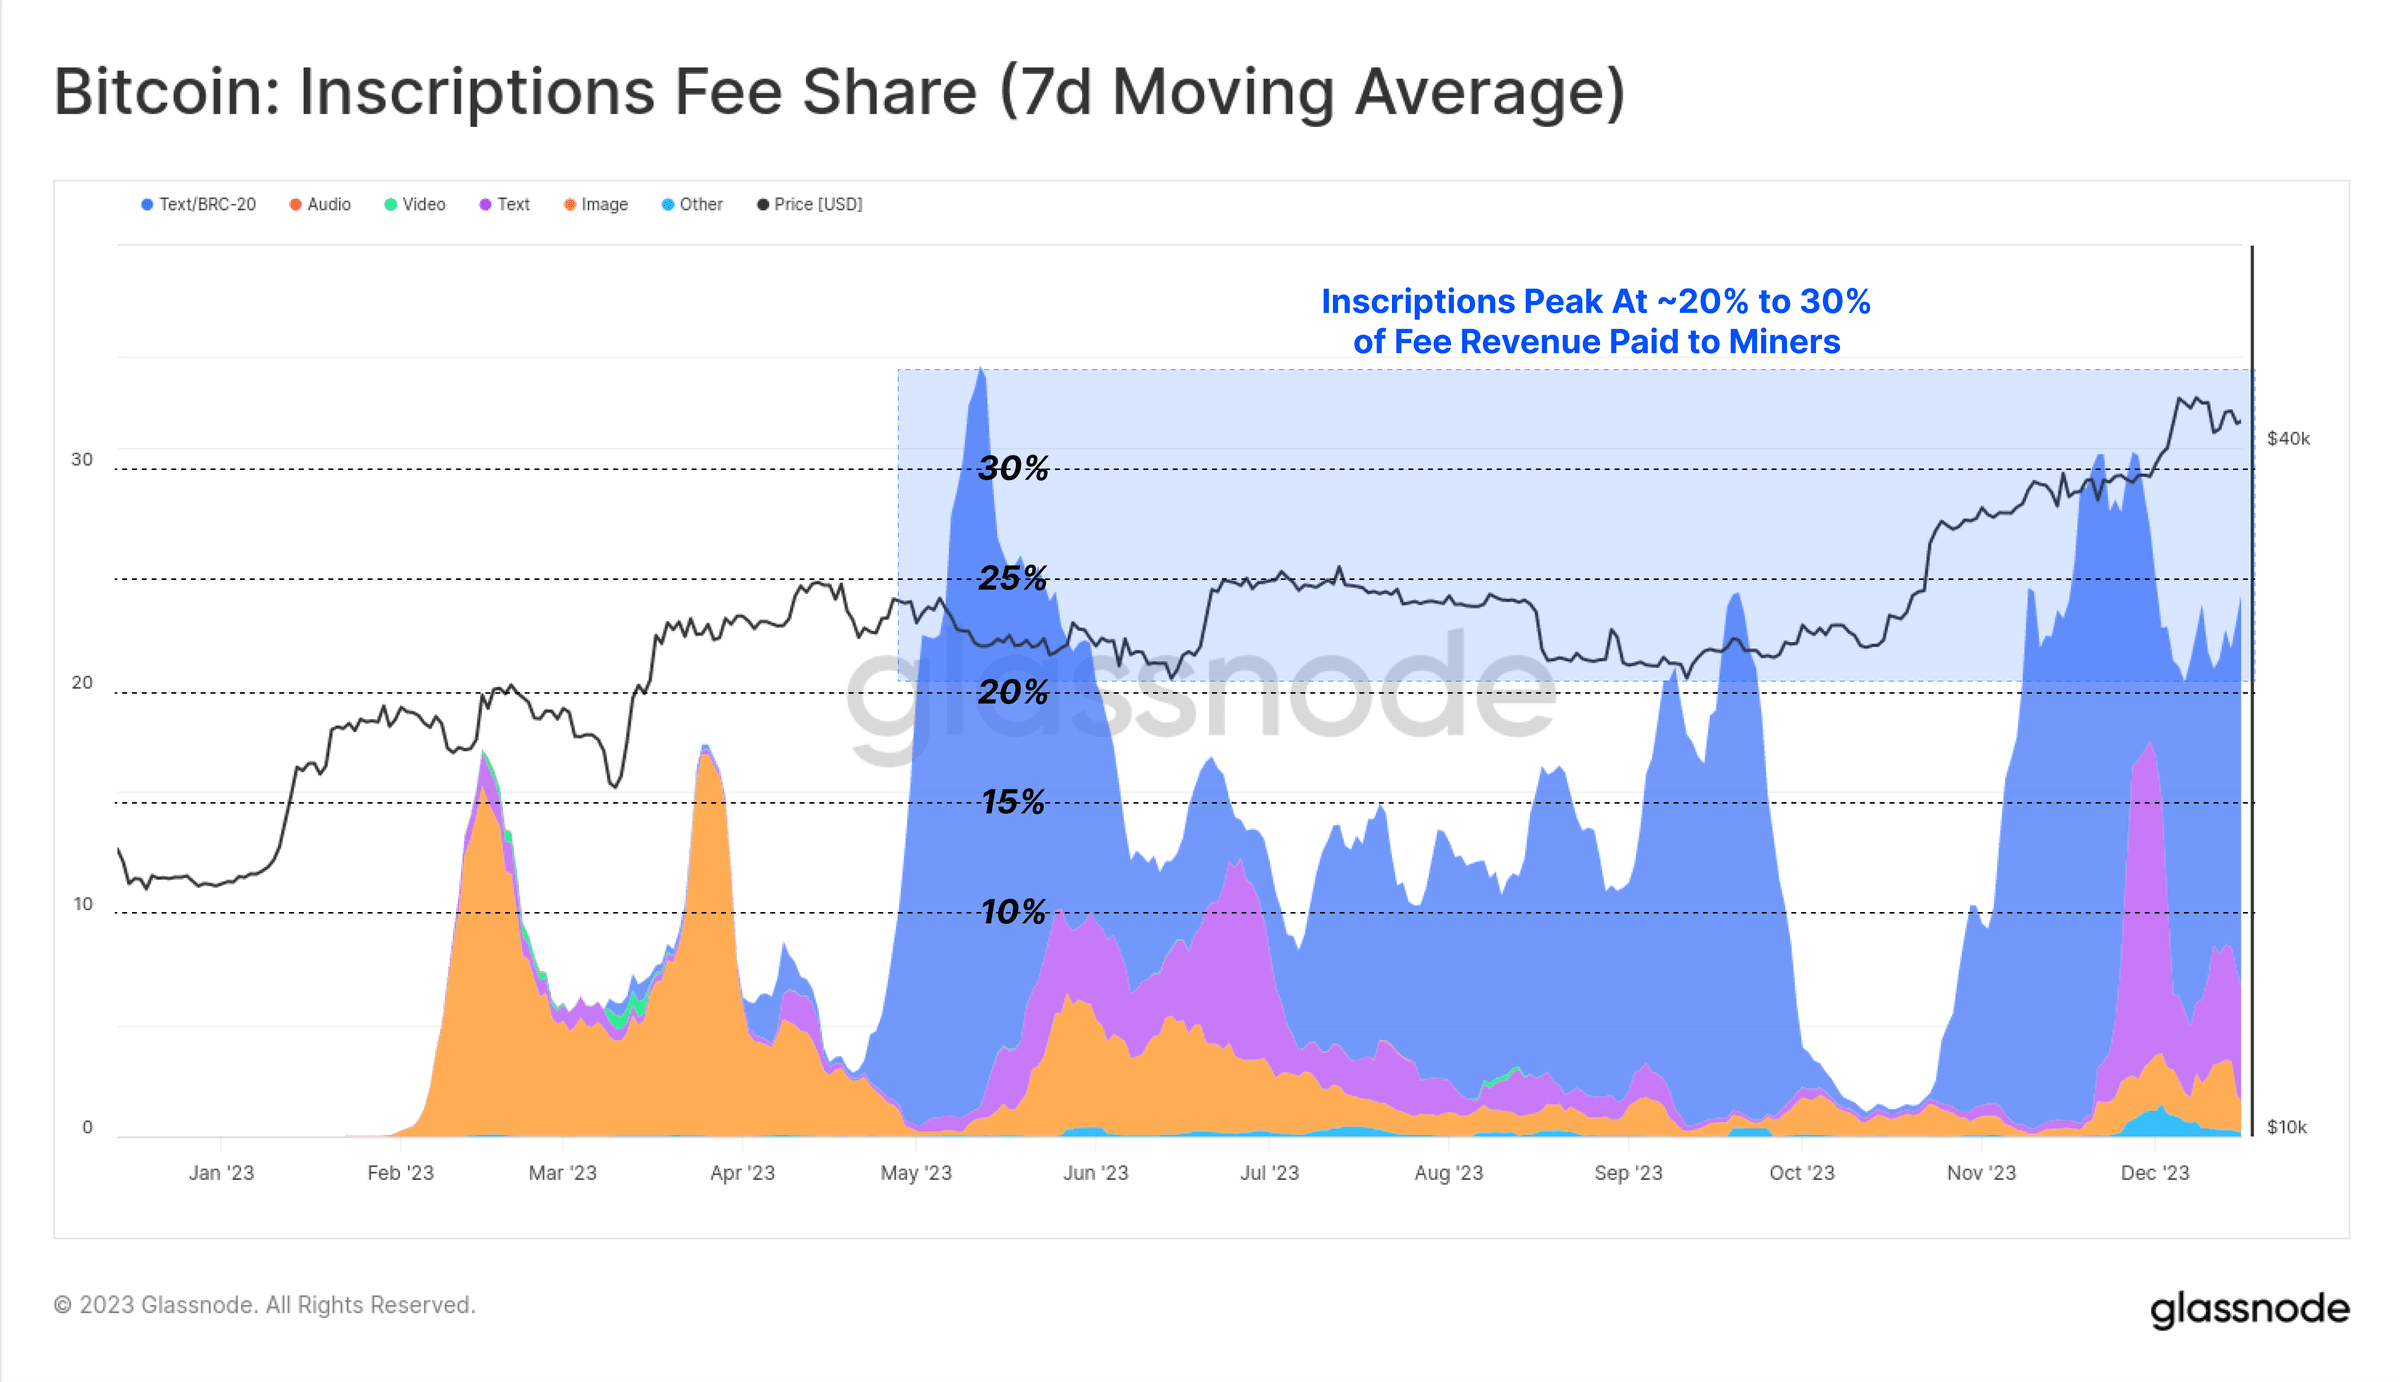 Figure 15: Bitcoin: Inscription fee share (7-day moving average)
Ethereum locked on cross-chain bridges and staked
For Ethereum, on-chain activity has been a bit subdued this year, with October once again serving as a significant inflection point.
The number of active addresses on the chain is relatively stable, about 390,000 per day
Transaction volume recently increased from 970,000 transactions per day to 1.11 million transactions per day
ETH trading volume has increased from $1.8 billion/day to $2.9 billion/day
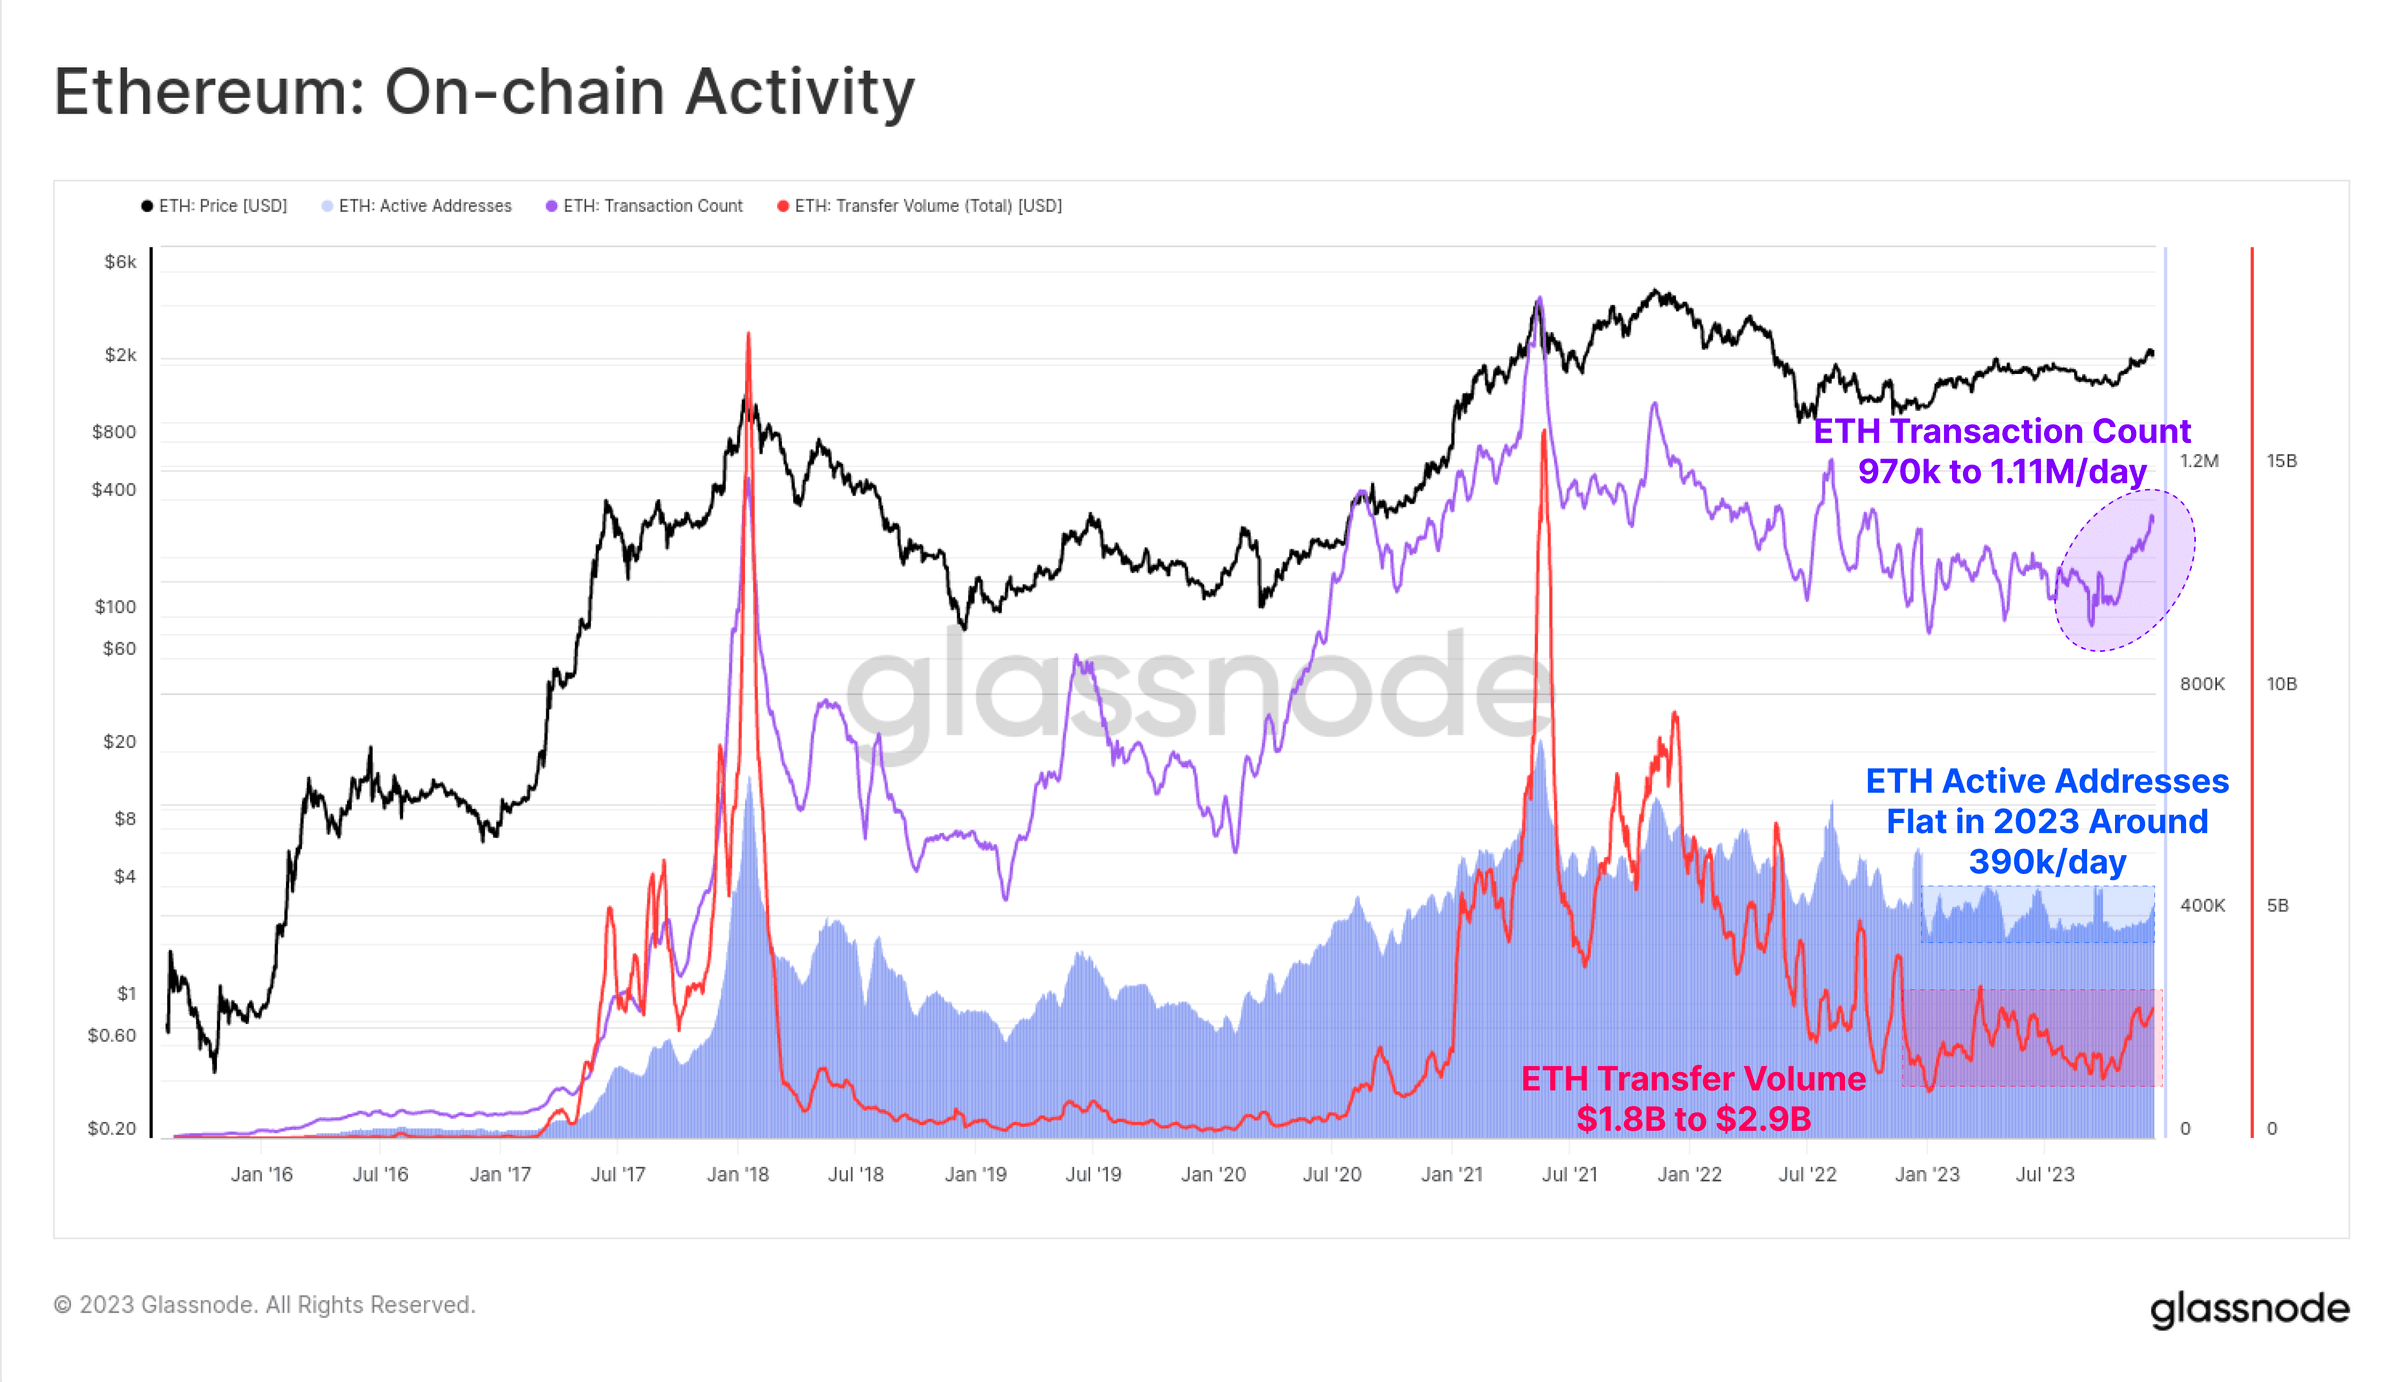 Figure 16: Ethereum: On-chain activity
While ETH price performance lags behind that of most digital assets, its ecosystem continues to expand, mature, and develop. In particular, the total value locked in the expanding Layer-2 blockchain increased by 60%, with over $12 billion locked in cross-chain bridges.
These L2 chains are looking to expand the Ethereum block space while anchoring their data and calculation results into the main Ethereum chain to maintain their security.
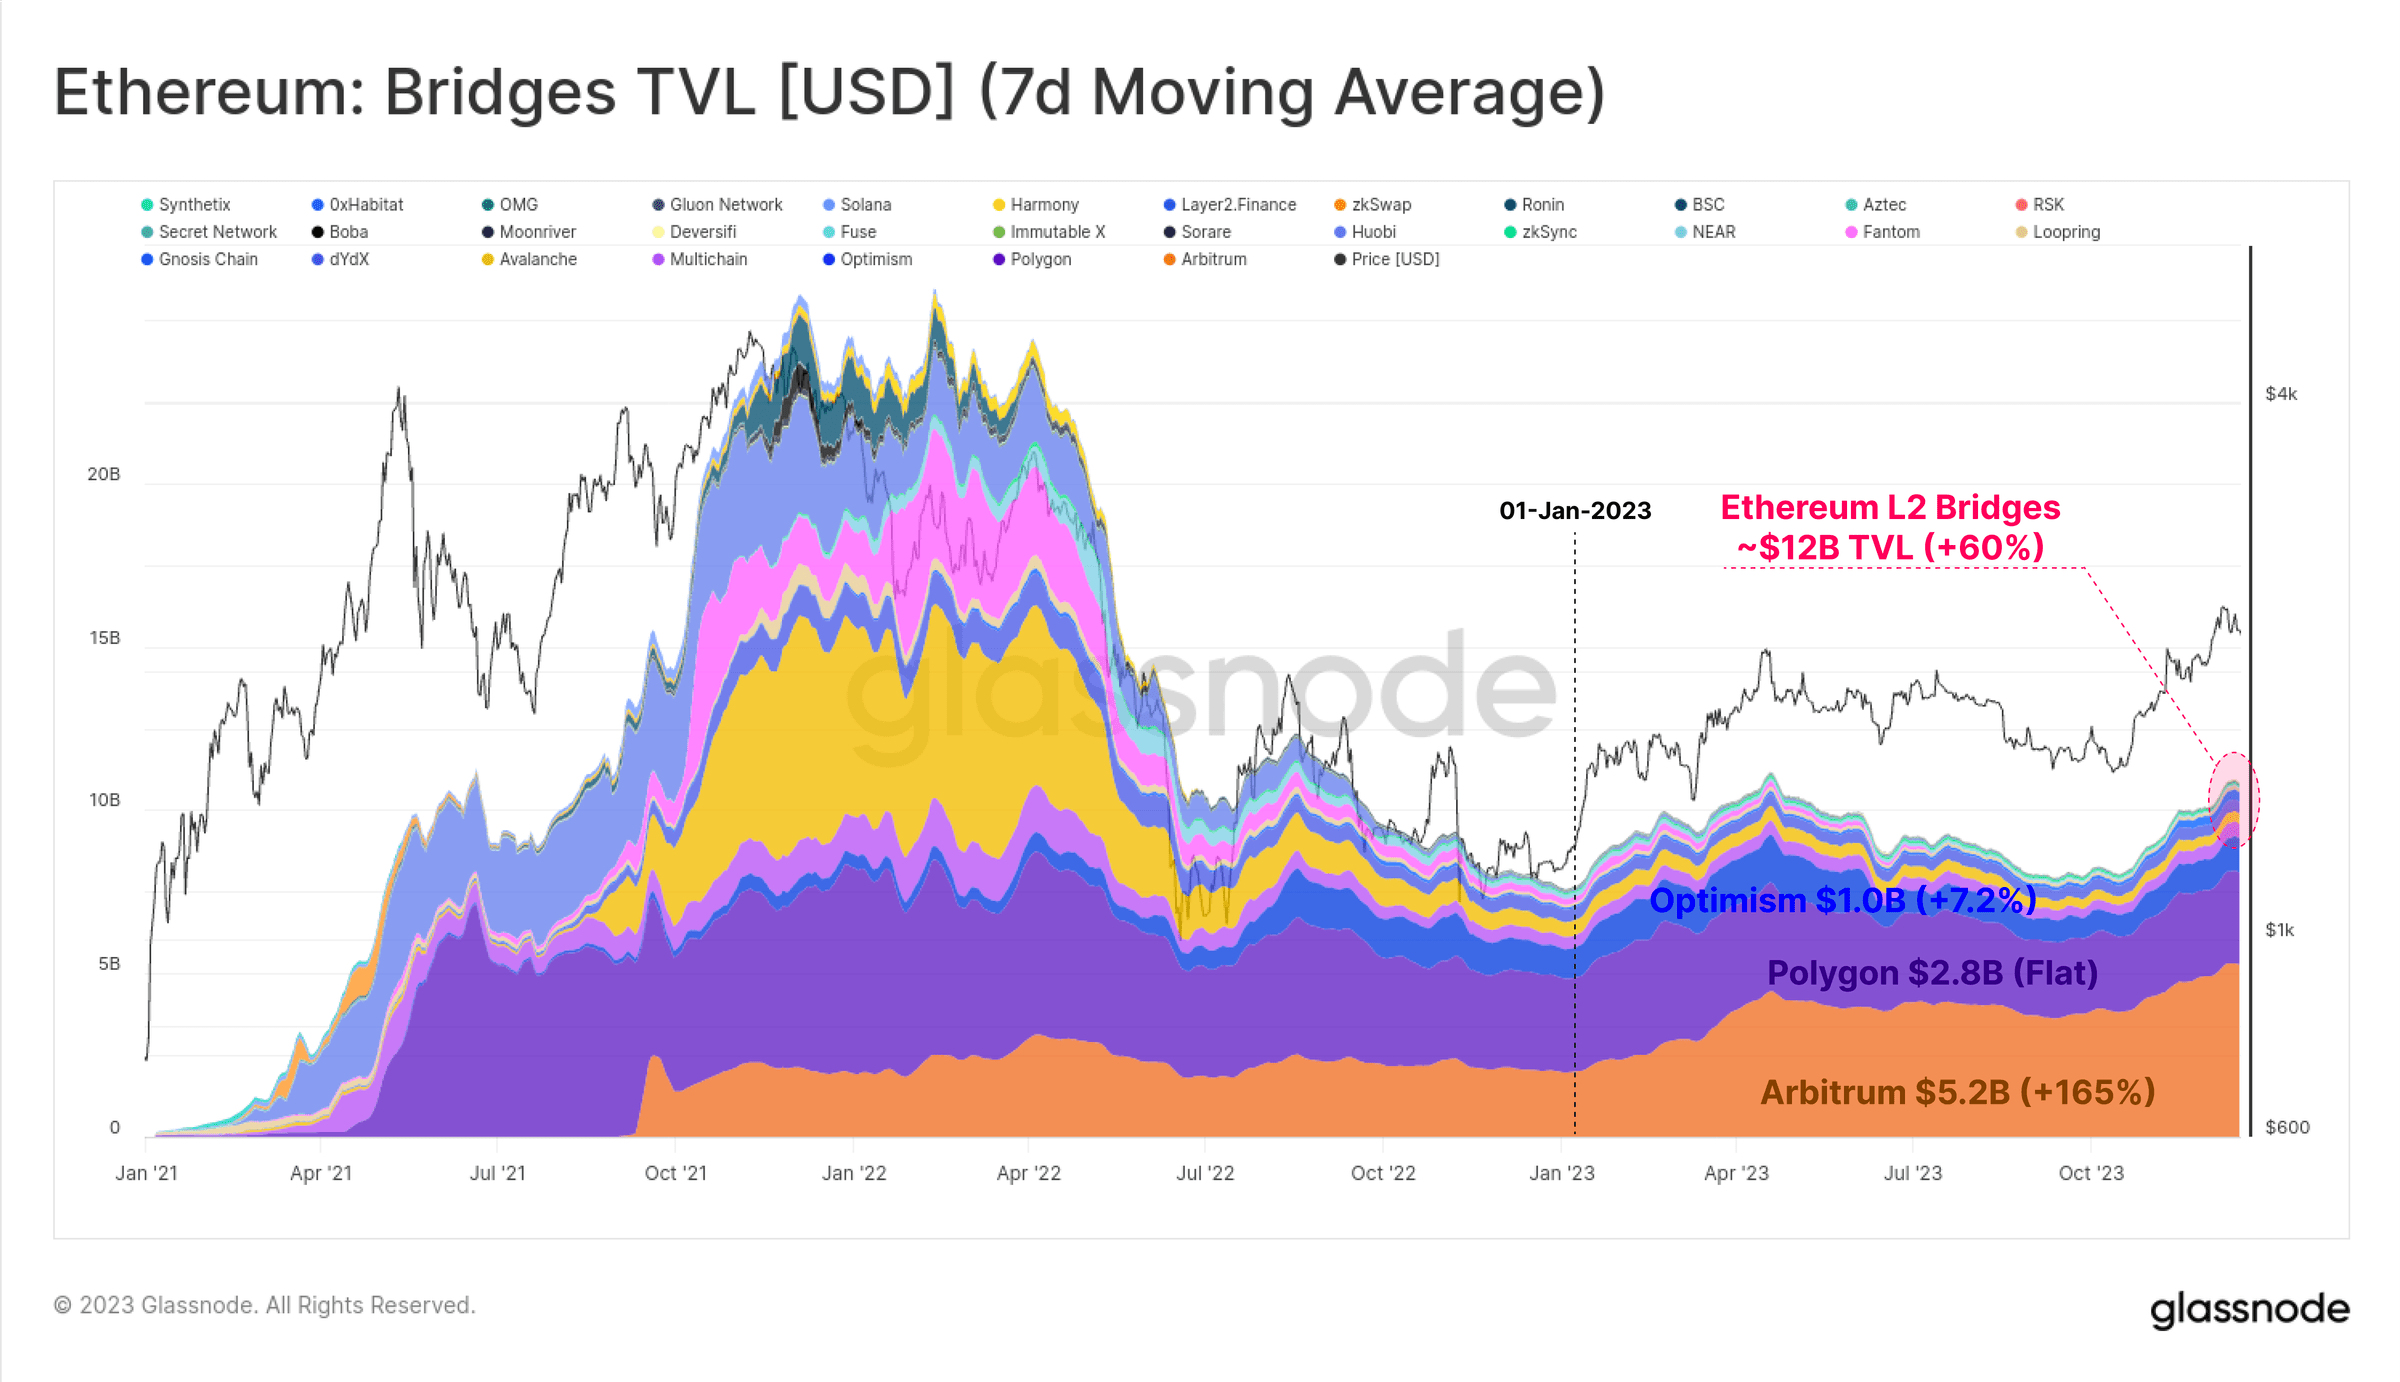 Figure 17: Ethereum: Assets locked in cross-chain bridge (7-day moving average)
Another key growth area for Ethereum is the total amount of ETH staked through PoS. Since 2023, the amount of ETH staked has increased by 119%, and the amount of ETH currently locked in the staking protocol has exceeded 34.638 million. The Shanghai upgrade was also successfully launched in April, allowing stakers to withdraw for the first time since the launch of the beacon chain in December 2020, and reshuffled liquidity staking providers.
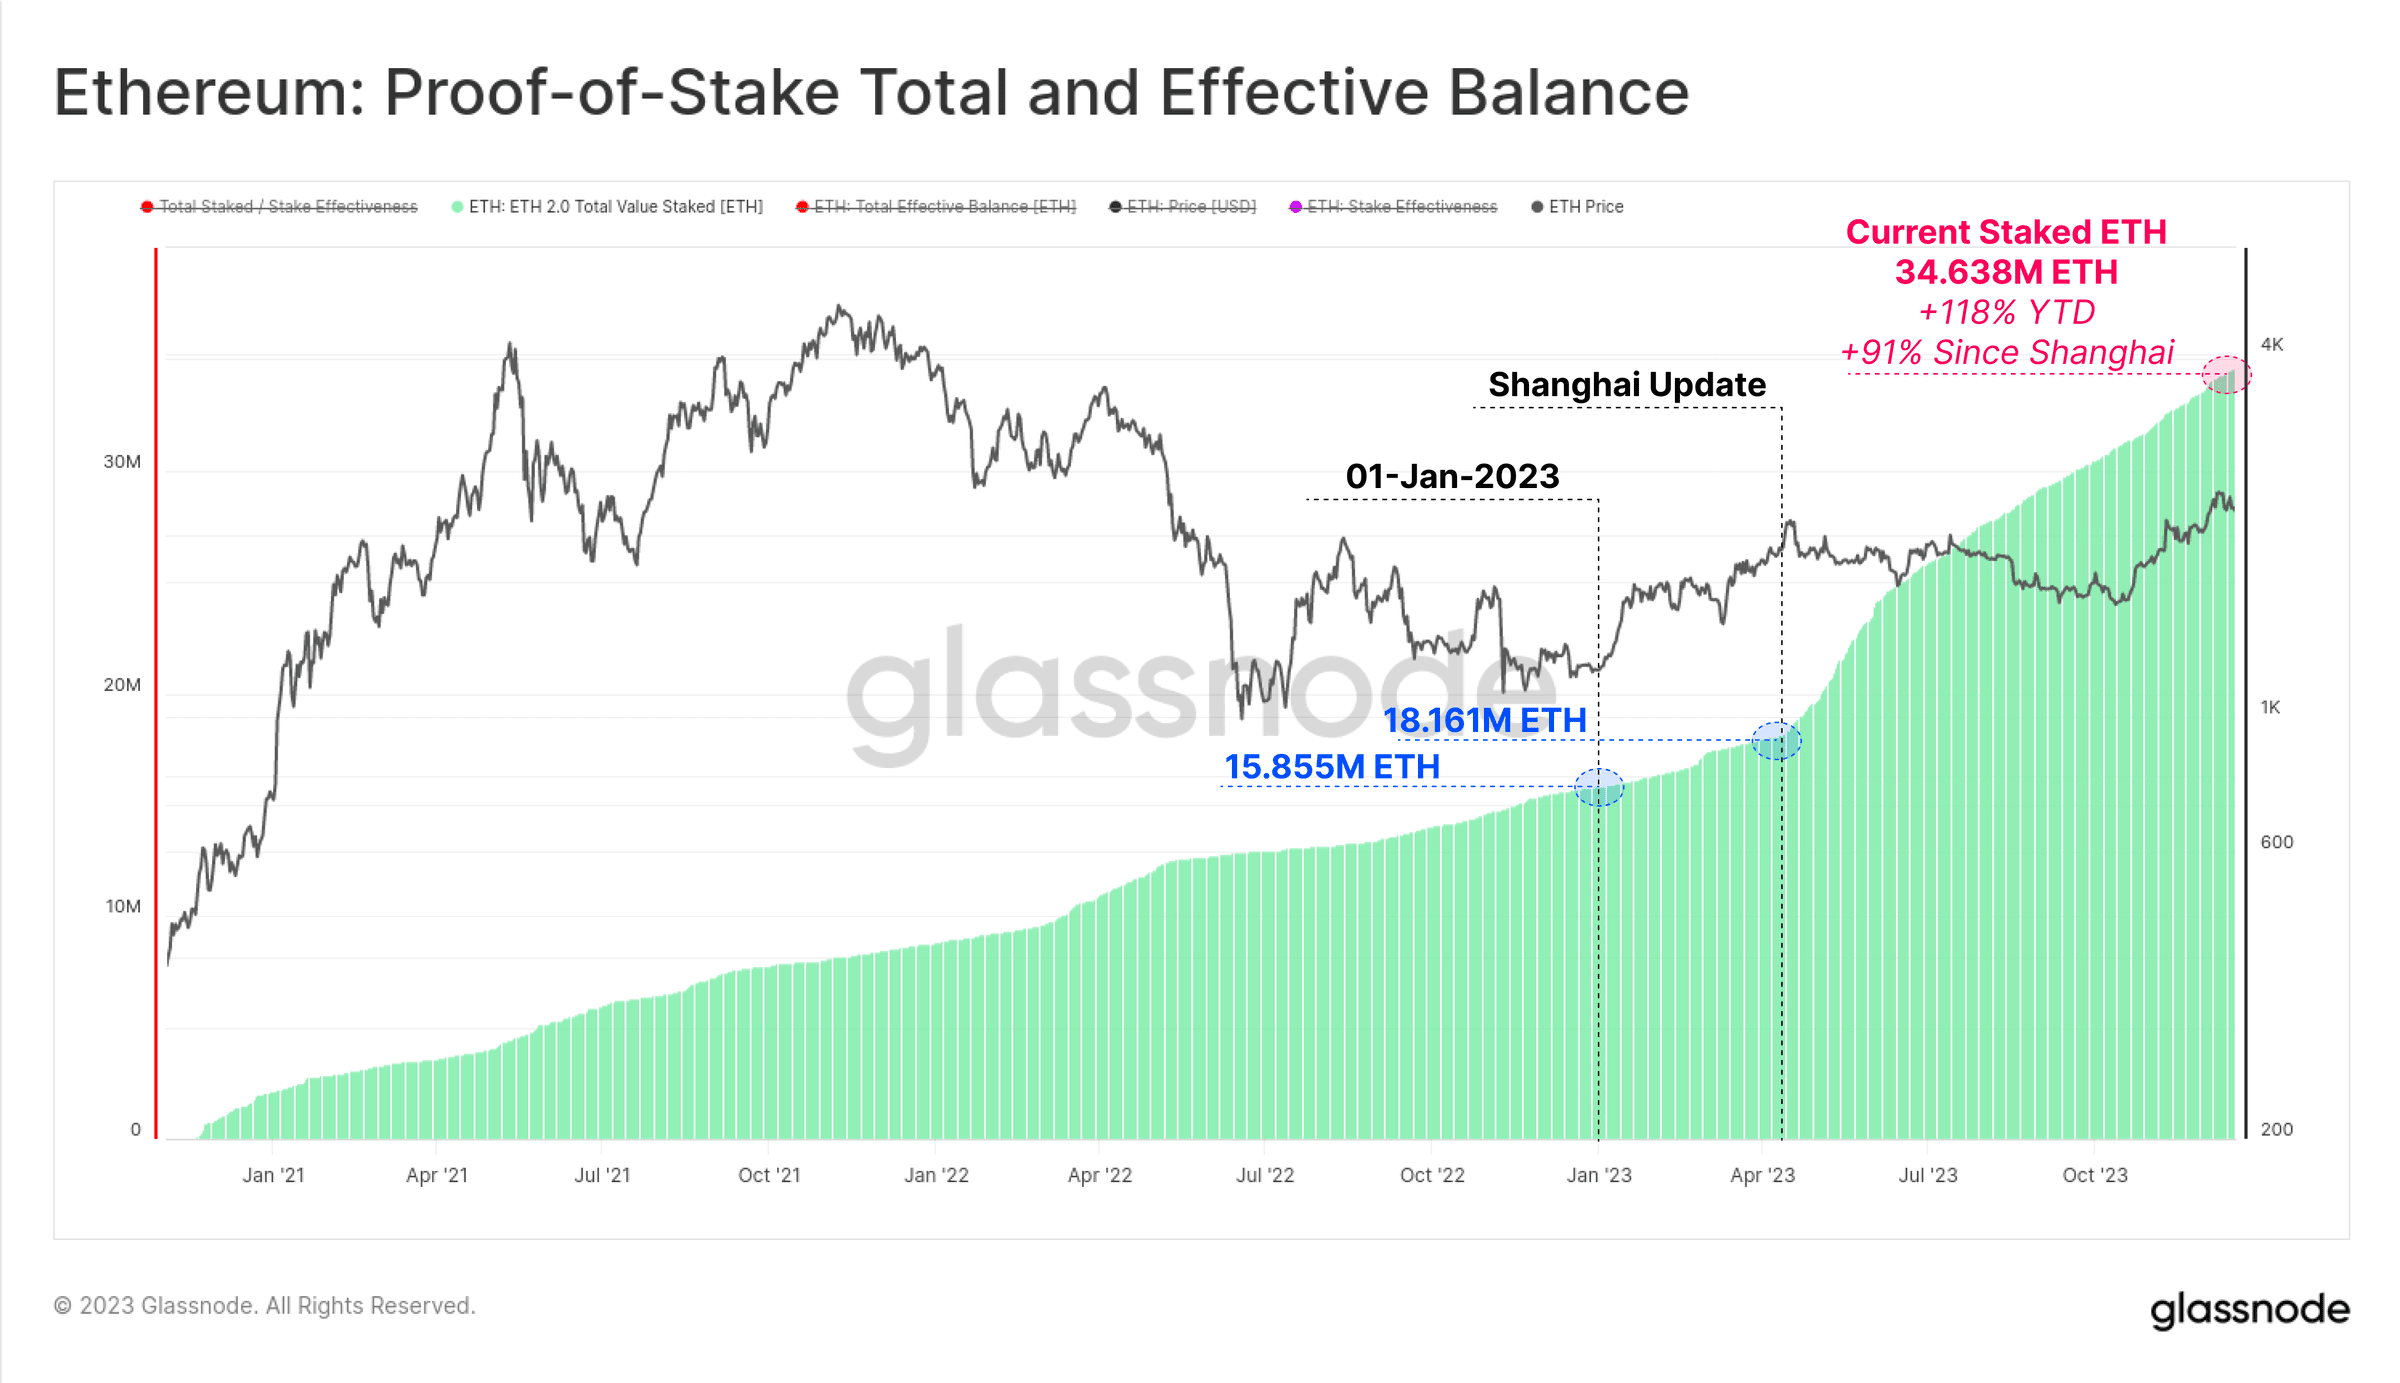 Figure 18: Ethereum: PoS total effective pledge balance
Bitcoin is mostly profitable
Although Bitcoin's price performance has many people excited, a large portion of Bitcoin remains dormant and has reached a long-term holding state in investor wallets. Of the total circulating supply of 19.574 million BTC, more than 14.9 million (76.1%) are stored outside of trading platforms and have not been traded for more than 155 days, an increase of 825,000 BTC so far this year. This also brings the short-term holder supply to an all-time low of 2.317 million BTC.
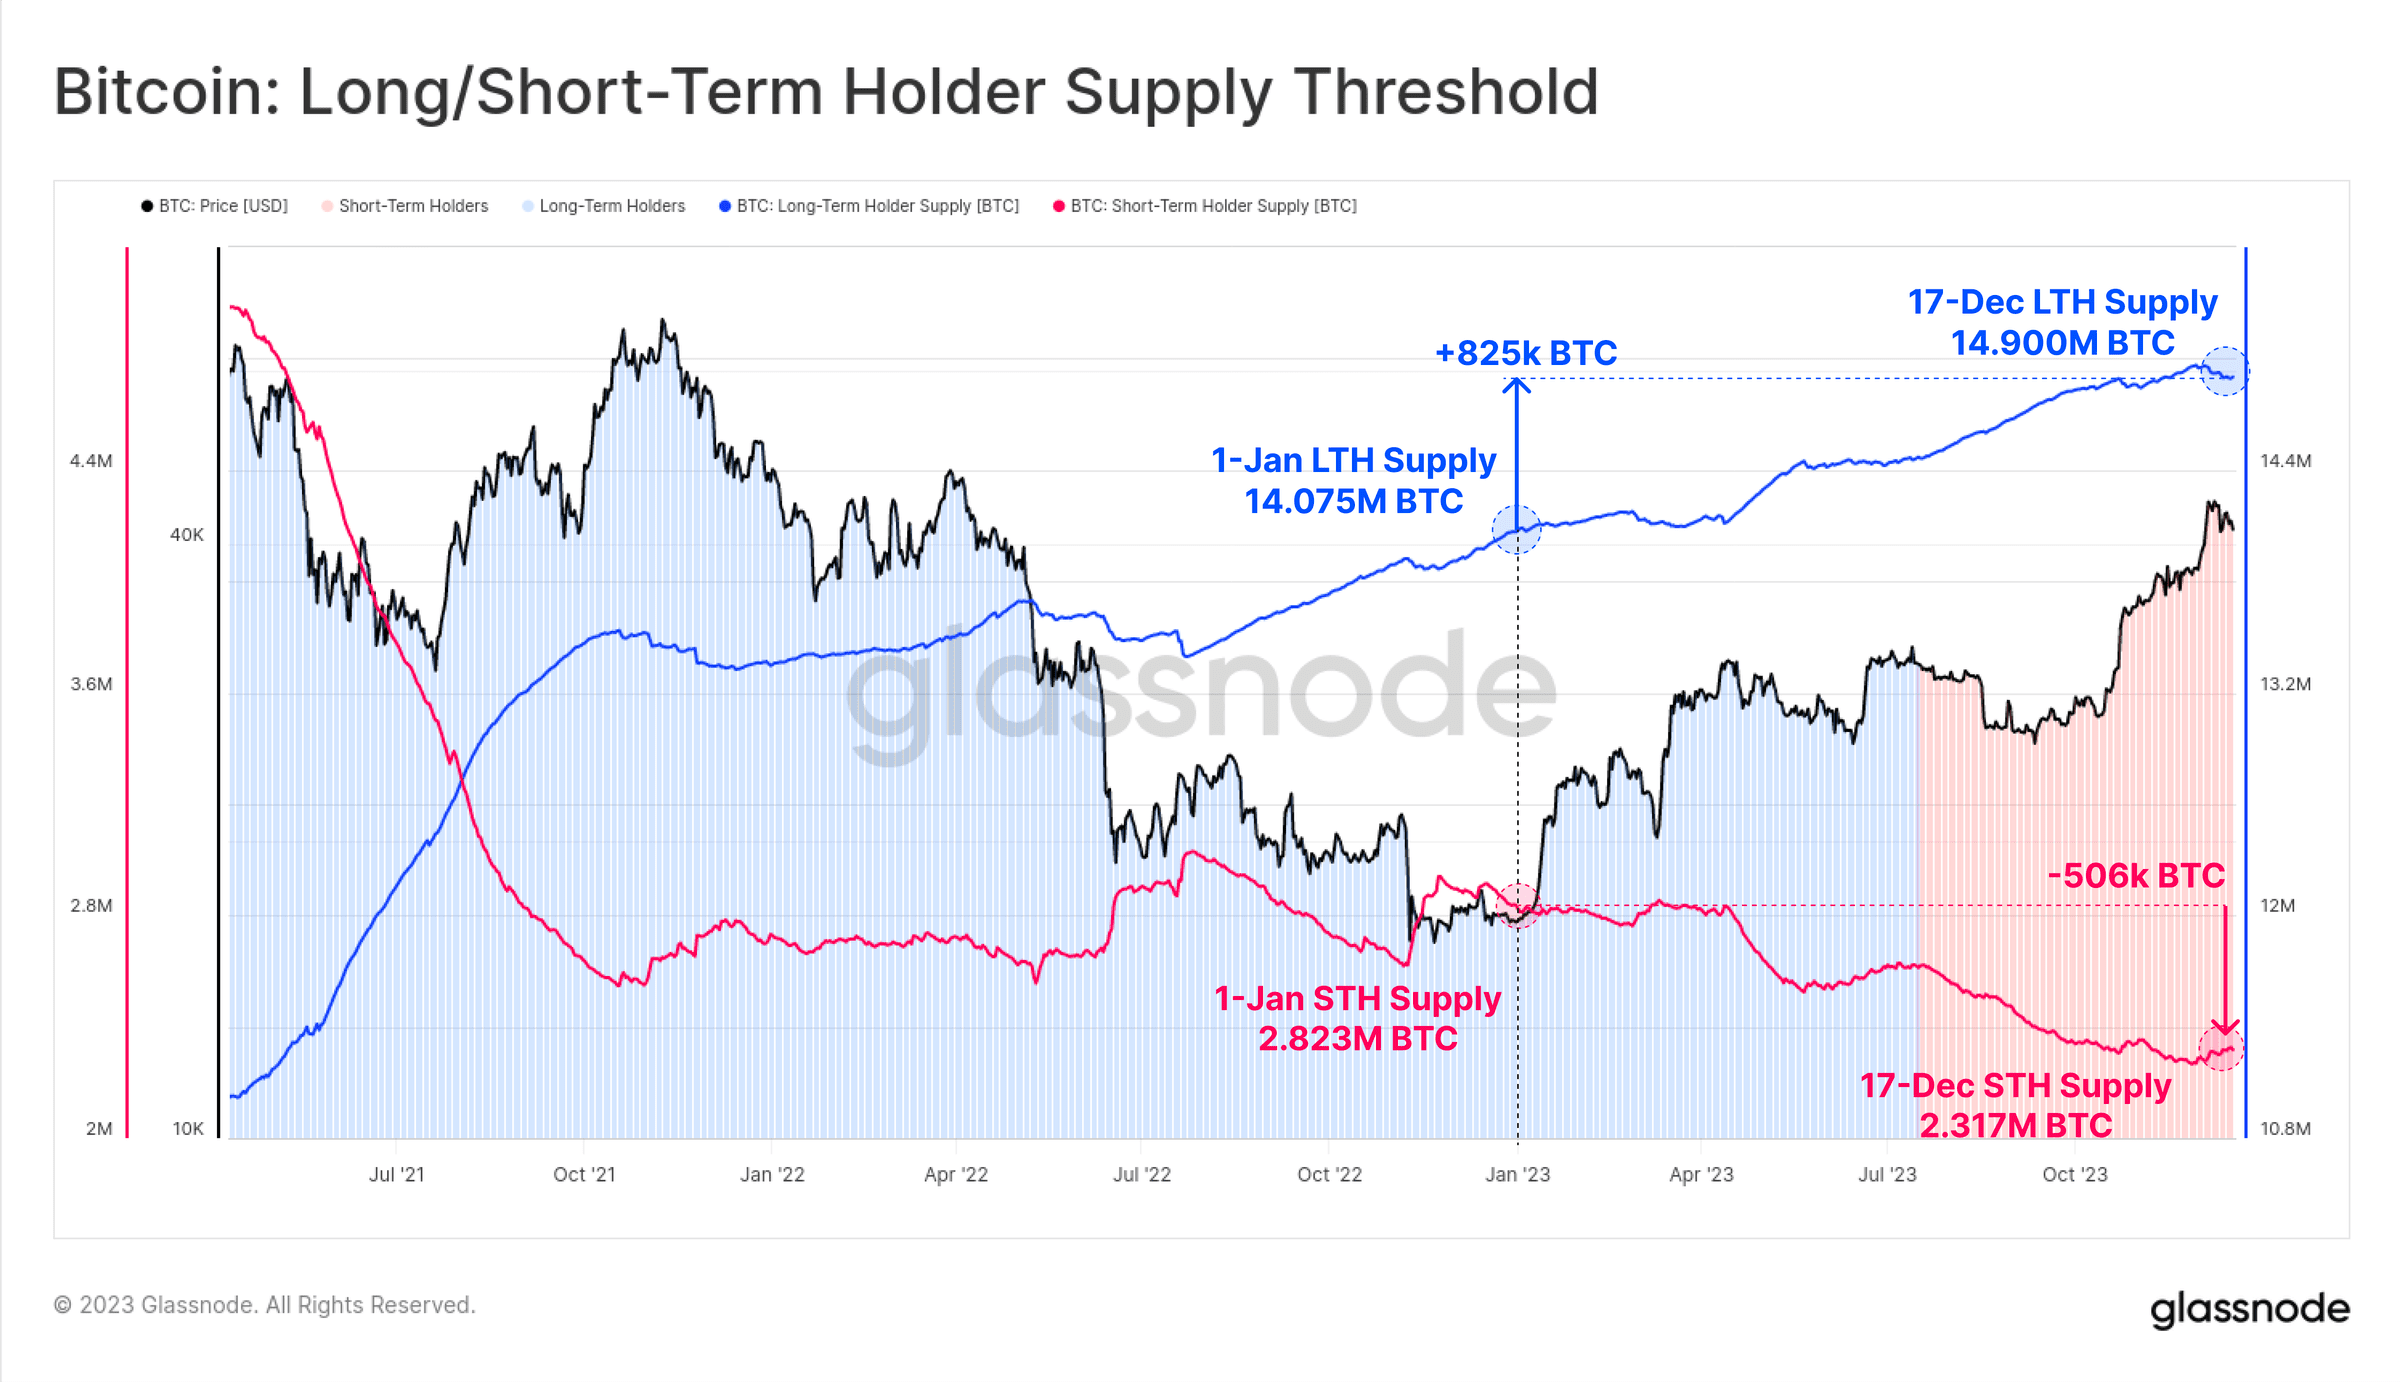 Figure 19: Bitcoin: Long/Short holder supply
As the market rebounded, the vast majority of investors' assets have returned to "profit", either due to trading or price appreciation above their cost basis. The chart below shows how the total amount of "losing" assets has fallen to around 1.9 million BTC, most of which is held by long-term holders who bought near the 2021 highs.
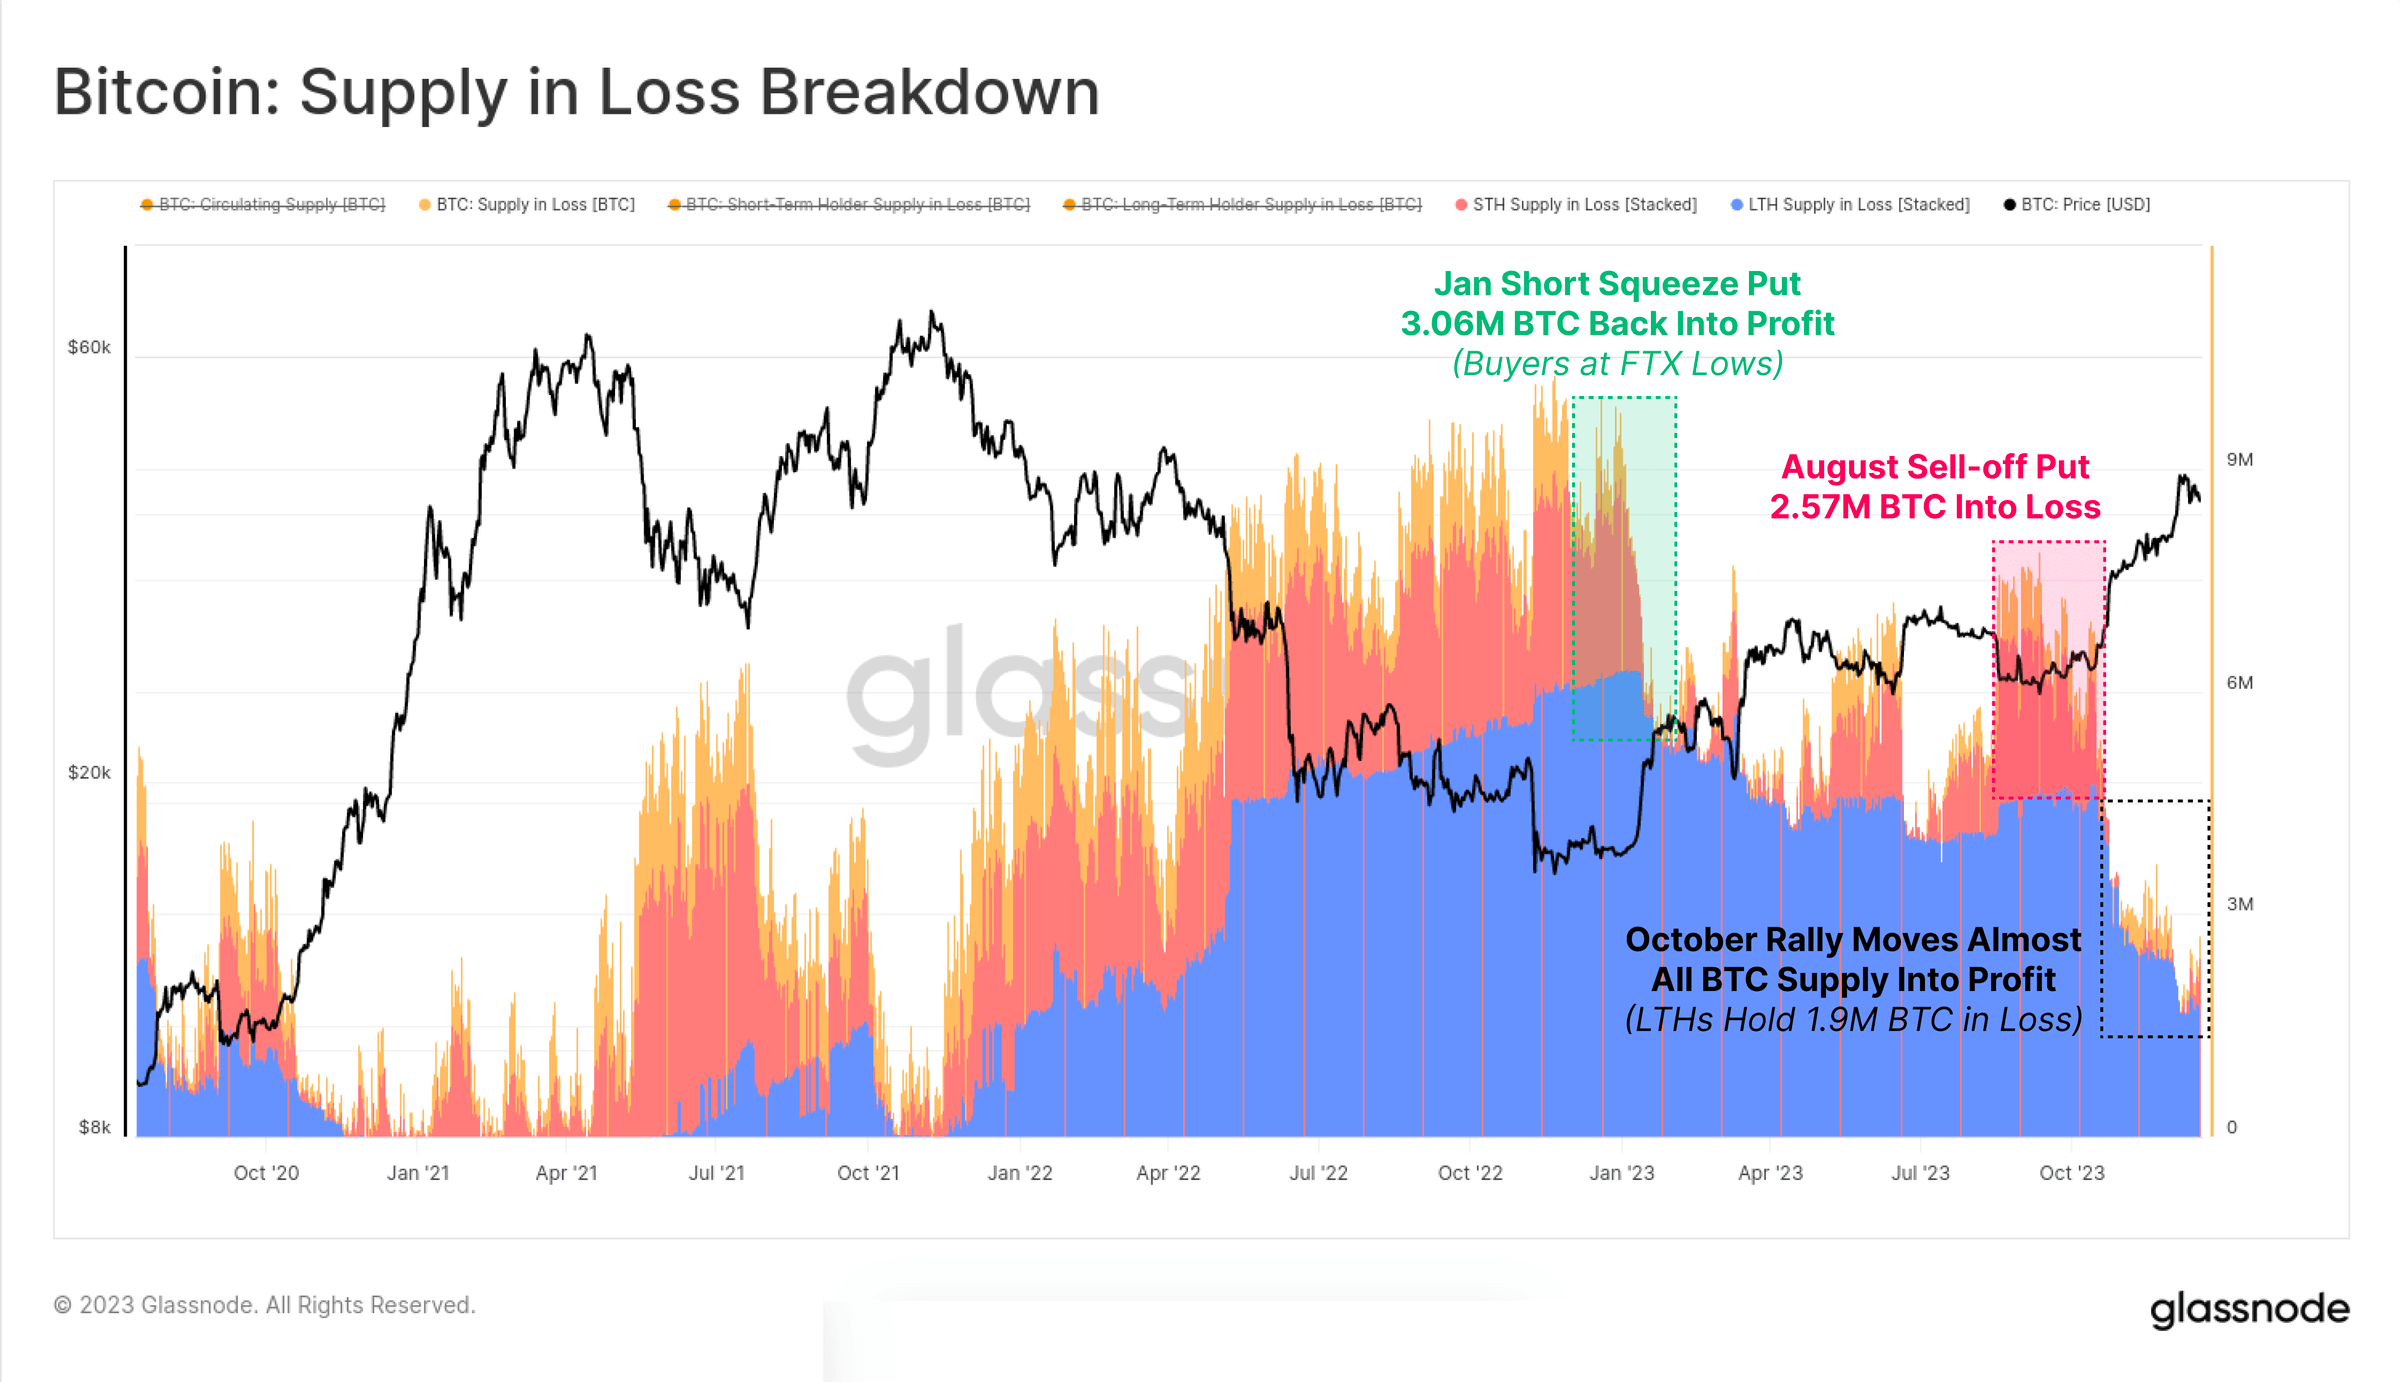 Figure 20: Bitcoin: An asset in a state of loss
On the flip side, October’s rally has pushed the share of “profitable” supply above the historical average, to over 90% of circulating supply. Given that over 50% of supply was “loss-making” at the start of 2023, this is one of the fastest recoveries in history (second only to the 2019 rally).
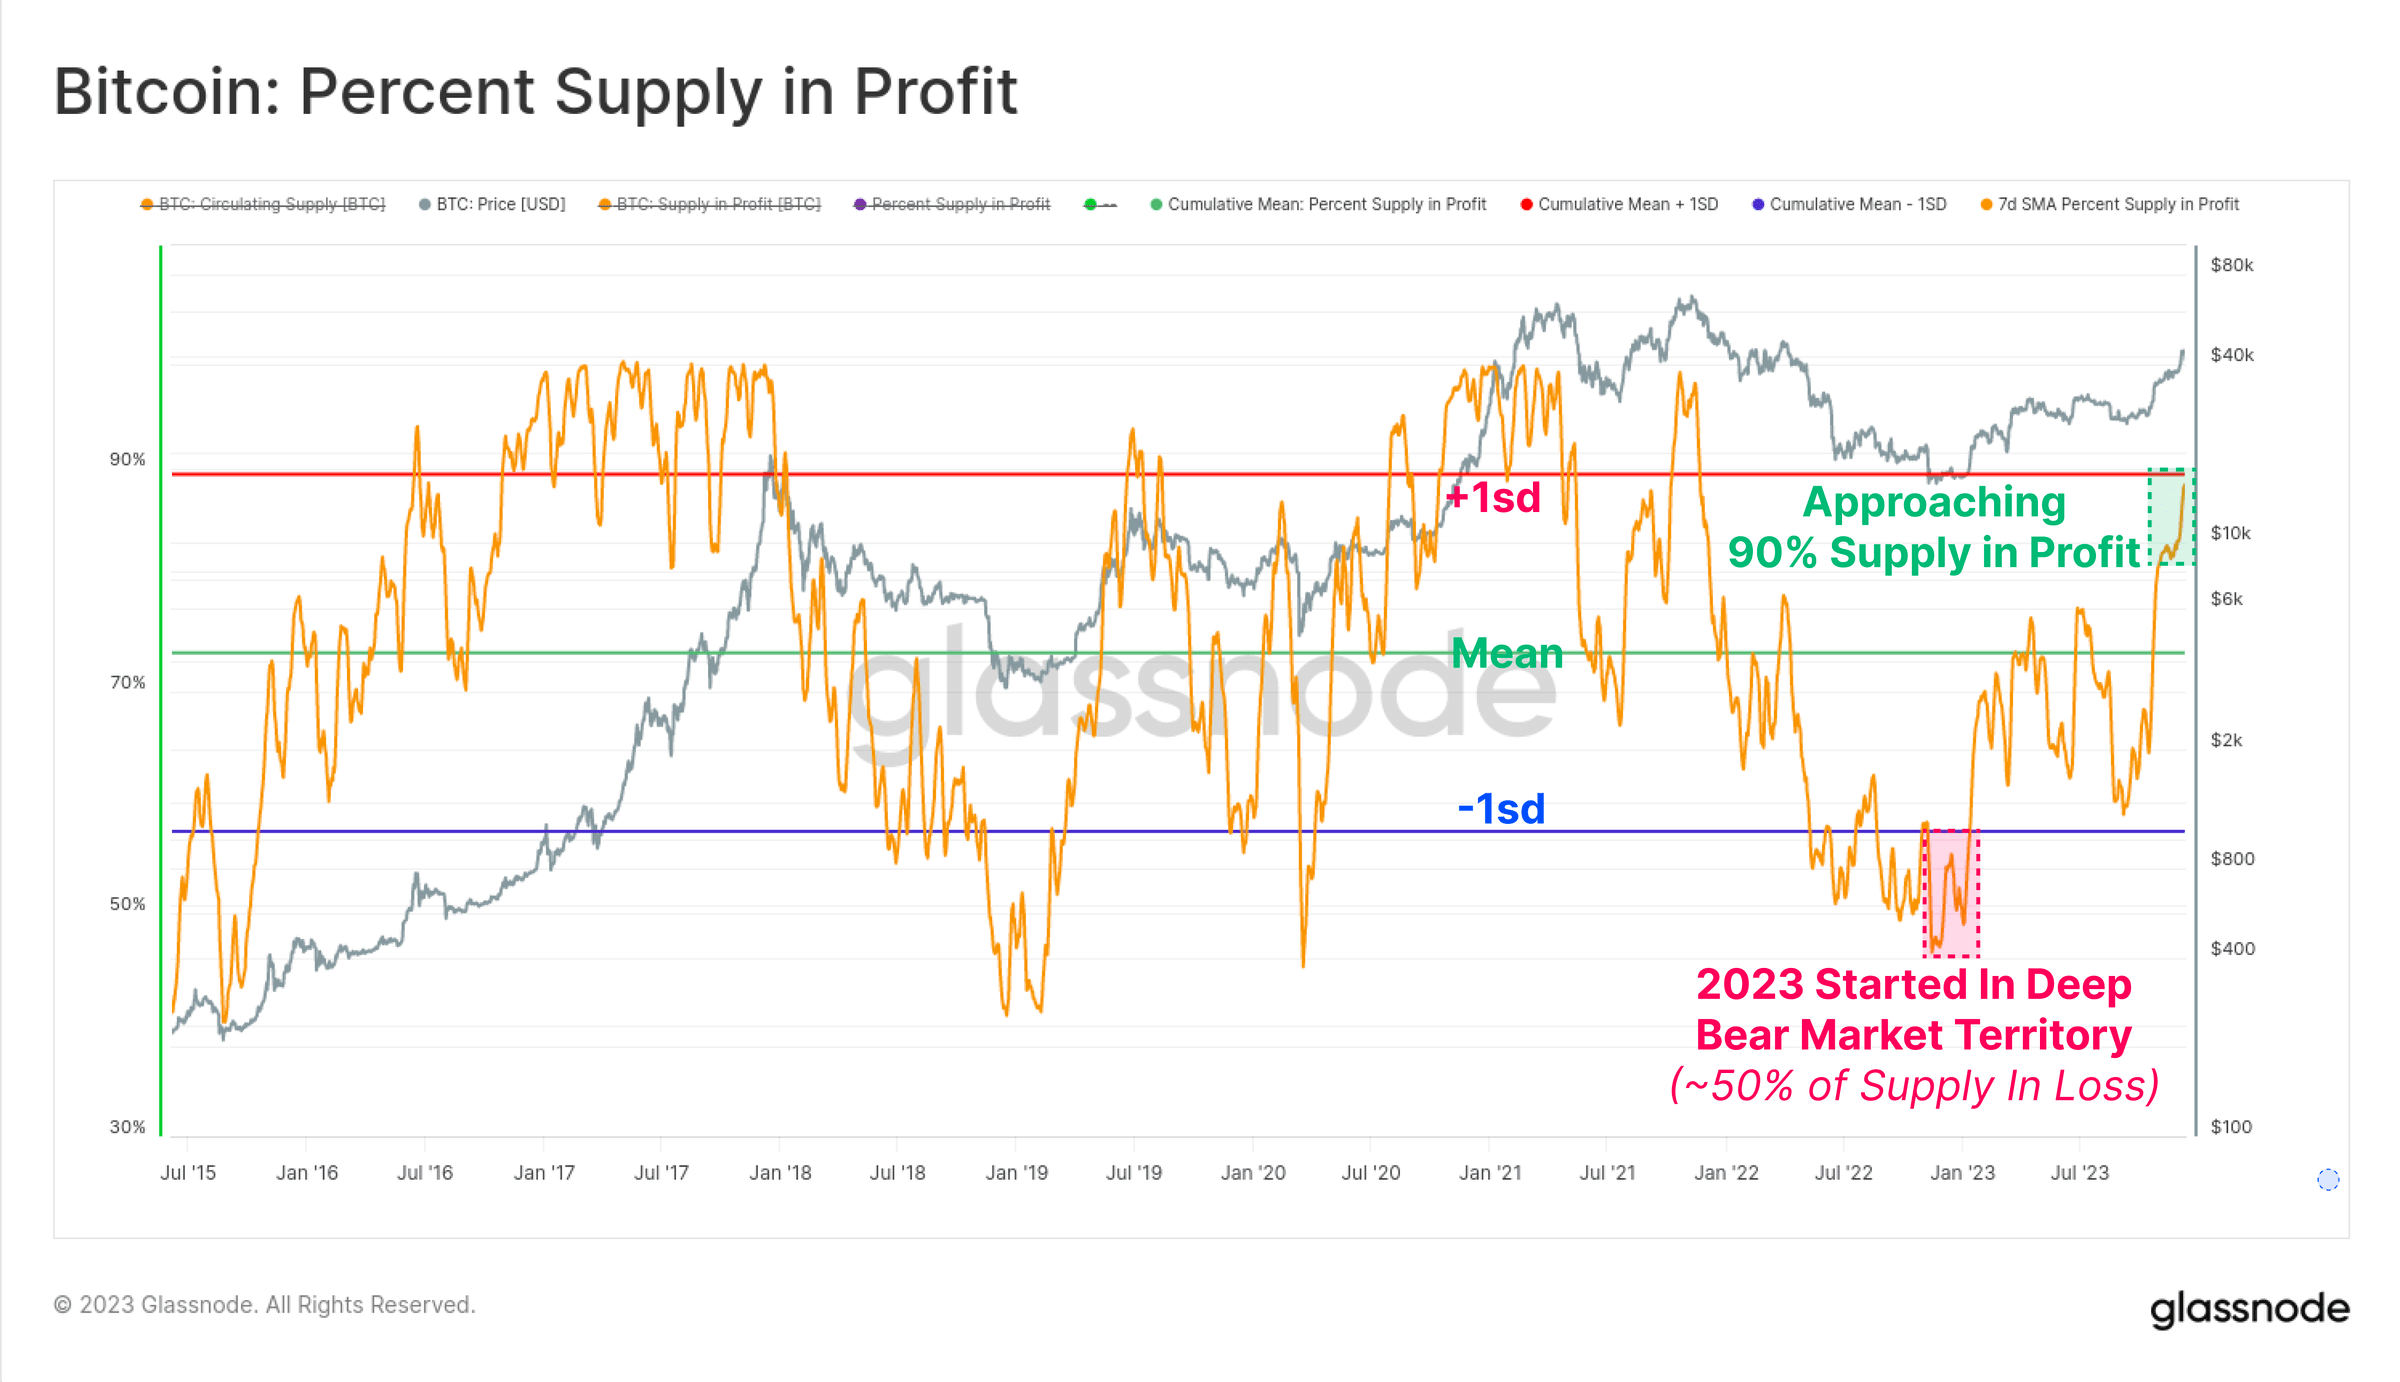 Figure 21: Bitcoin: “profitable” supply share
The chart below provides a visual representation of the earnings supply percentage change each year since 2015. Although the breakdown by year is not entirely appropriate, the four-year Bitcoin cycle allows us to discover some interesting patterns:
(Orange) Bear market/recovery phase, as Bitcoin capitulates and sells off near lows, a large number of Bitcoins return to profitability, with the largest increase in profit supply.
(Blue) Early bull market, the uptrend causes most assets to start making profits and rebound to new highs.
(Green) Euphoric late bull run, the market is at ATH levels, all tokens are already profitable, and the market is close to exhaustion.
(Red) A major bear market after a market top, with large amounts of assets falling into the red.
Although simple in structure, the framework shows similarities between progress made to date in 2015-16, 2019-20 and 2023.
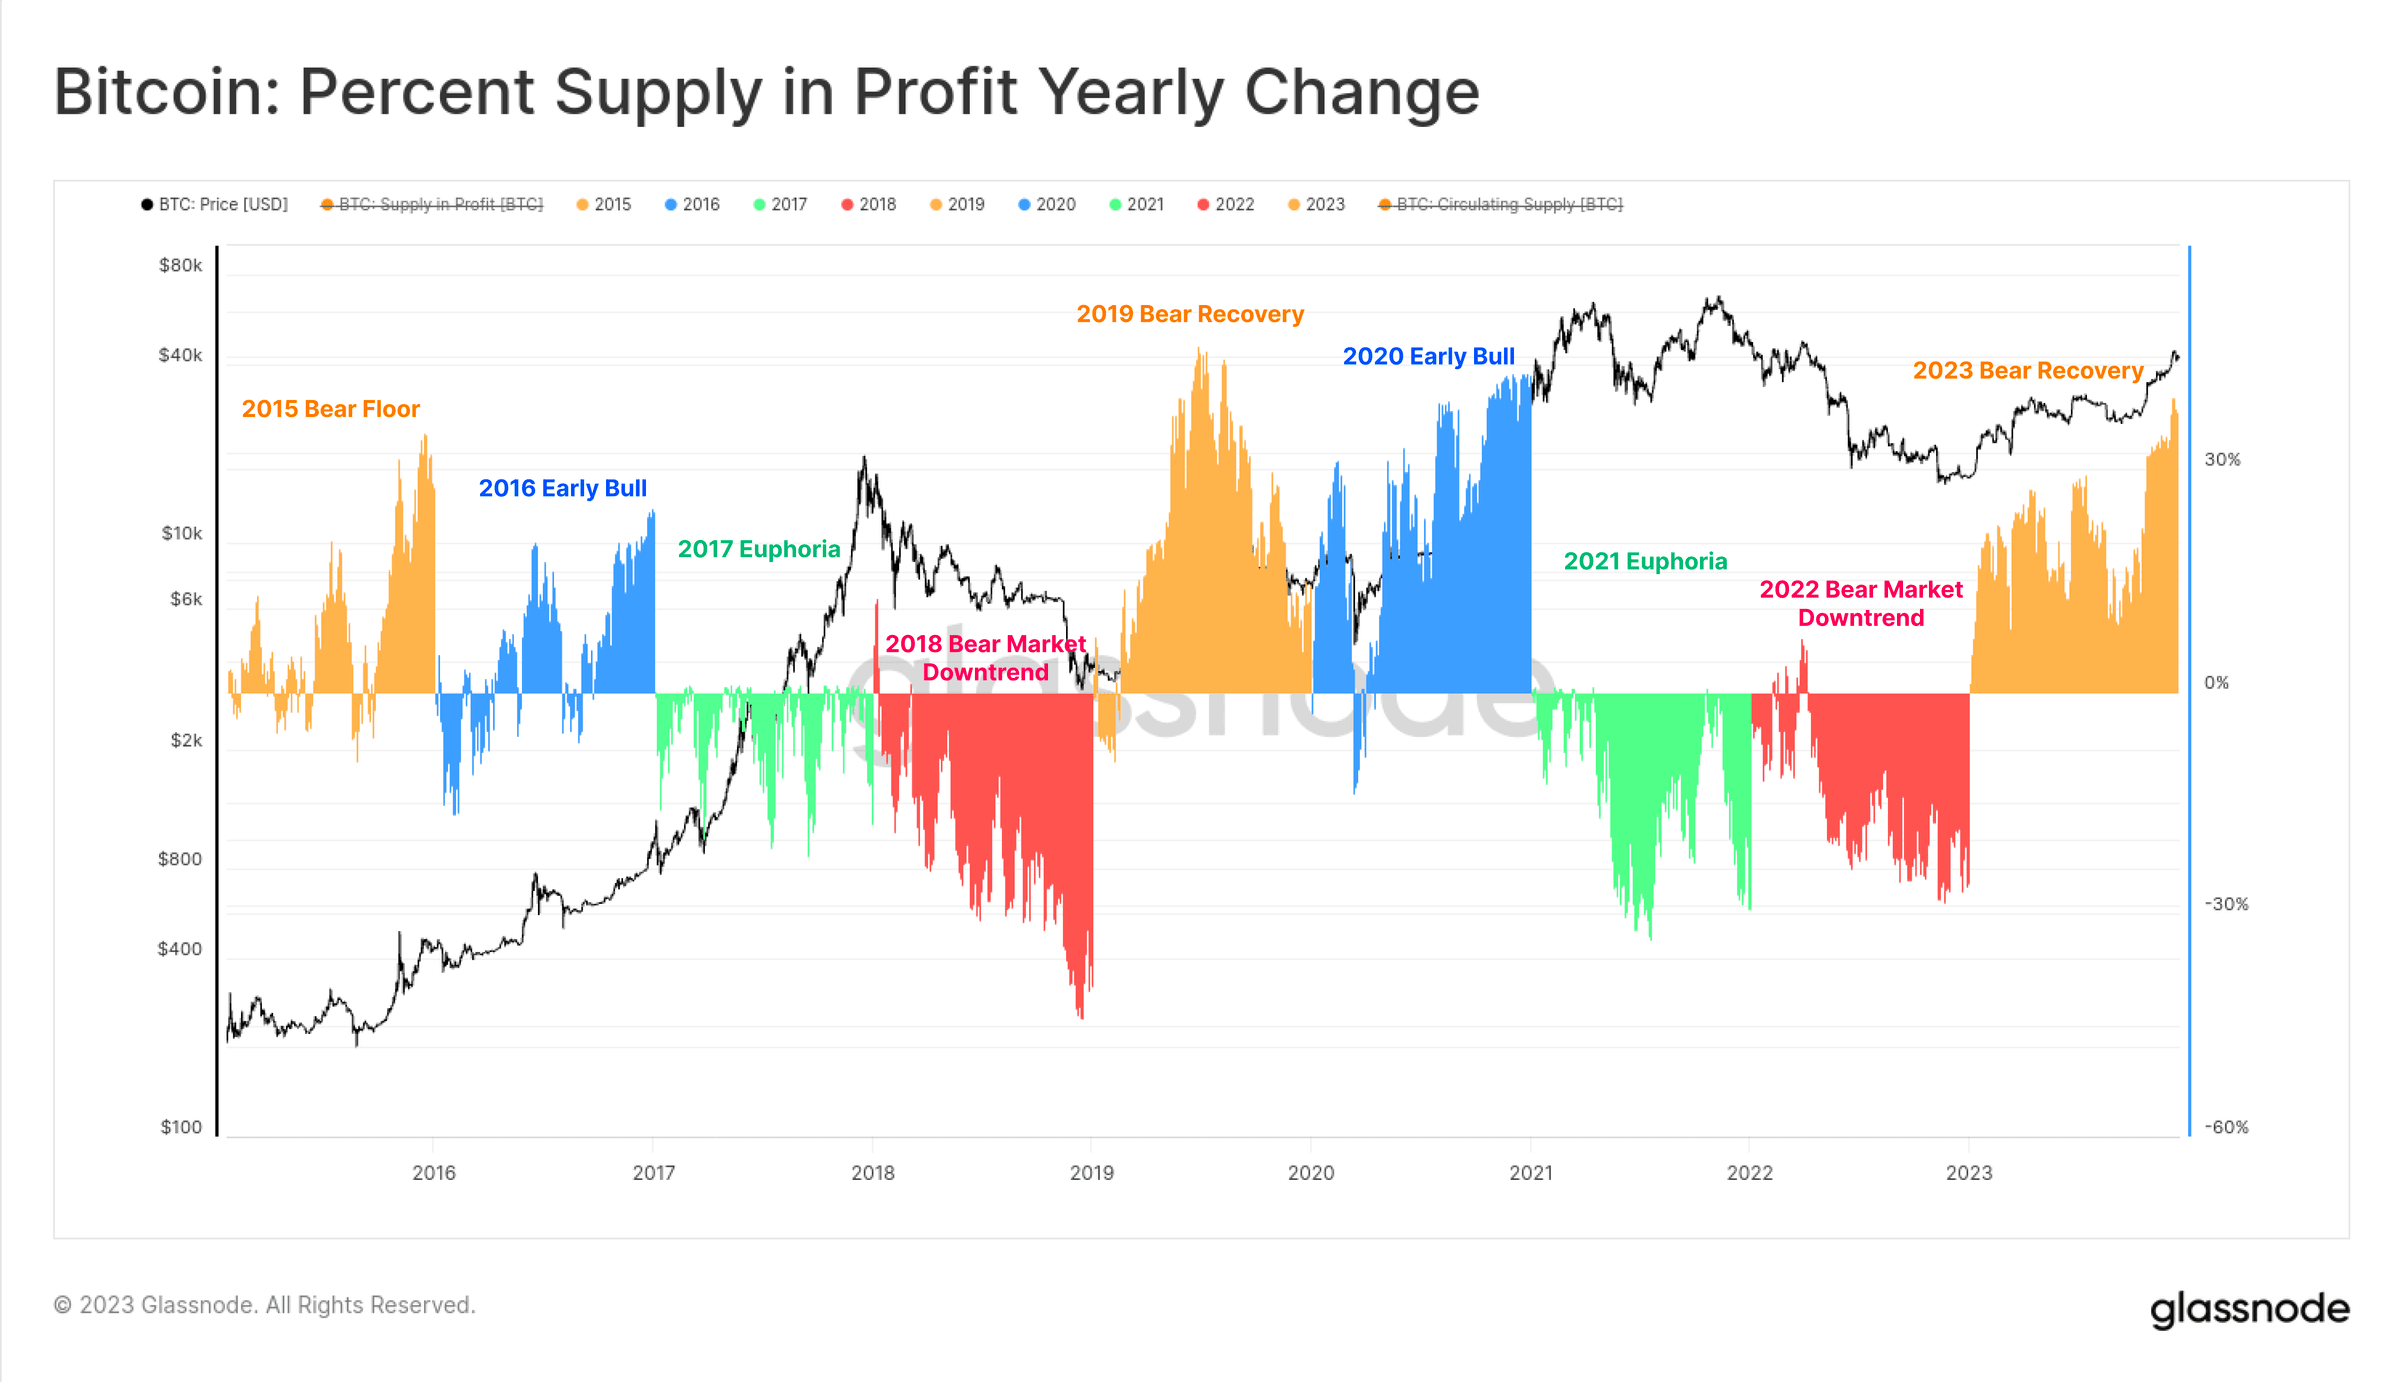 Figure 22: Profitable supply share each year
Finally we can discuss investor profitability, with 2023 moving long-term, short-term and ordinary holders from unprofitable to moderately profitable conditions. The NUPL metrics for each group, while not yet reaching exciting highs, are significantly higher than their respective group's base cost levels.
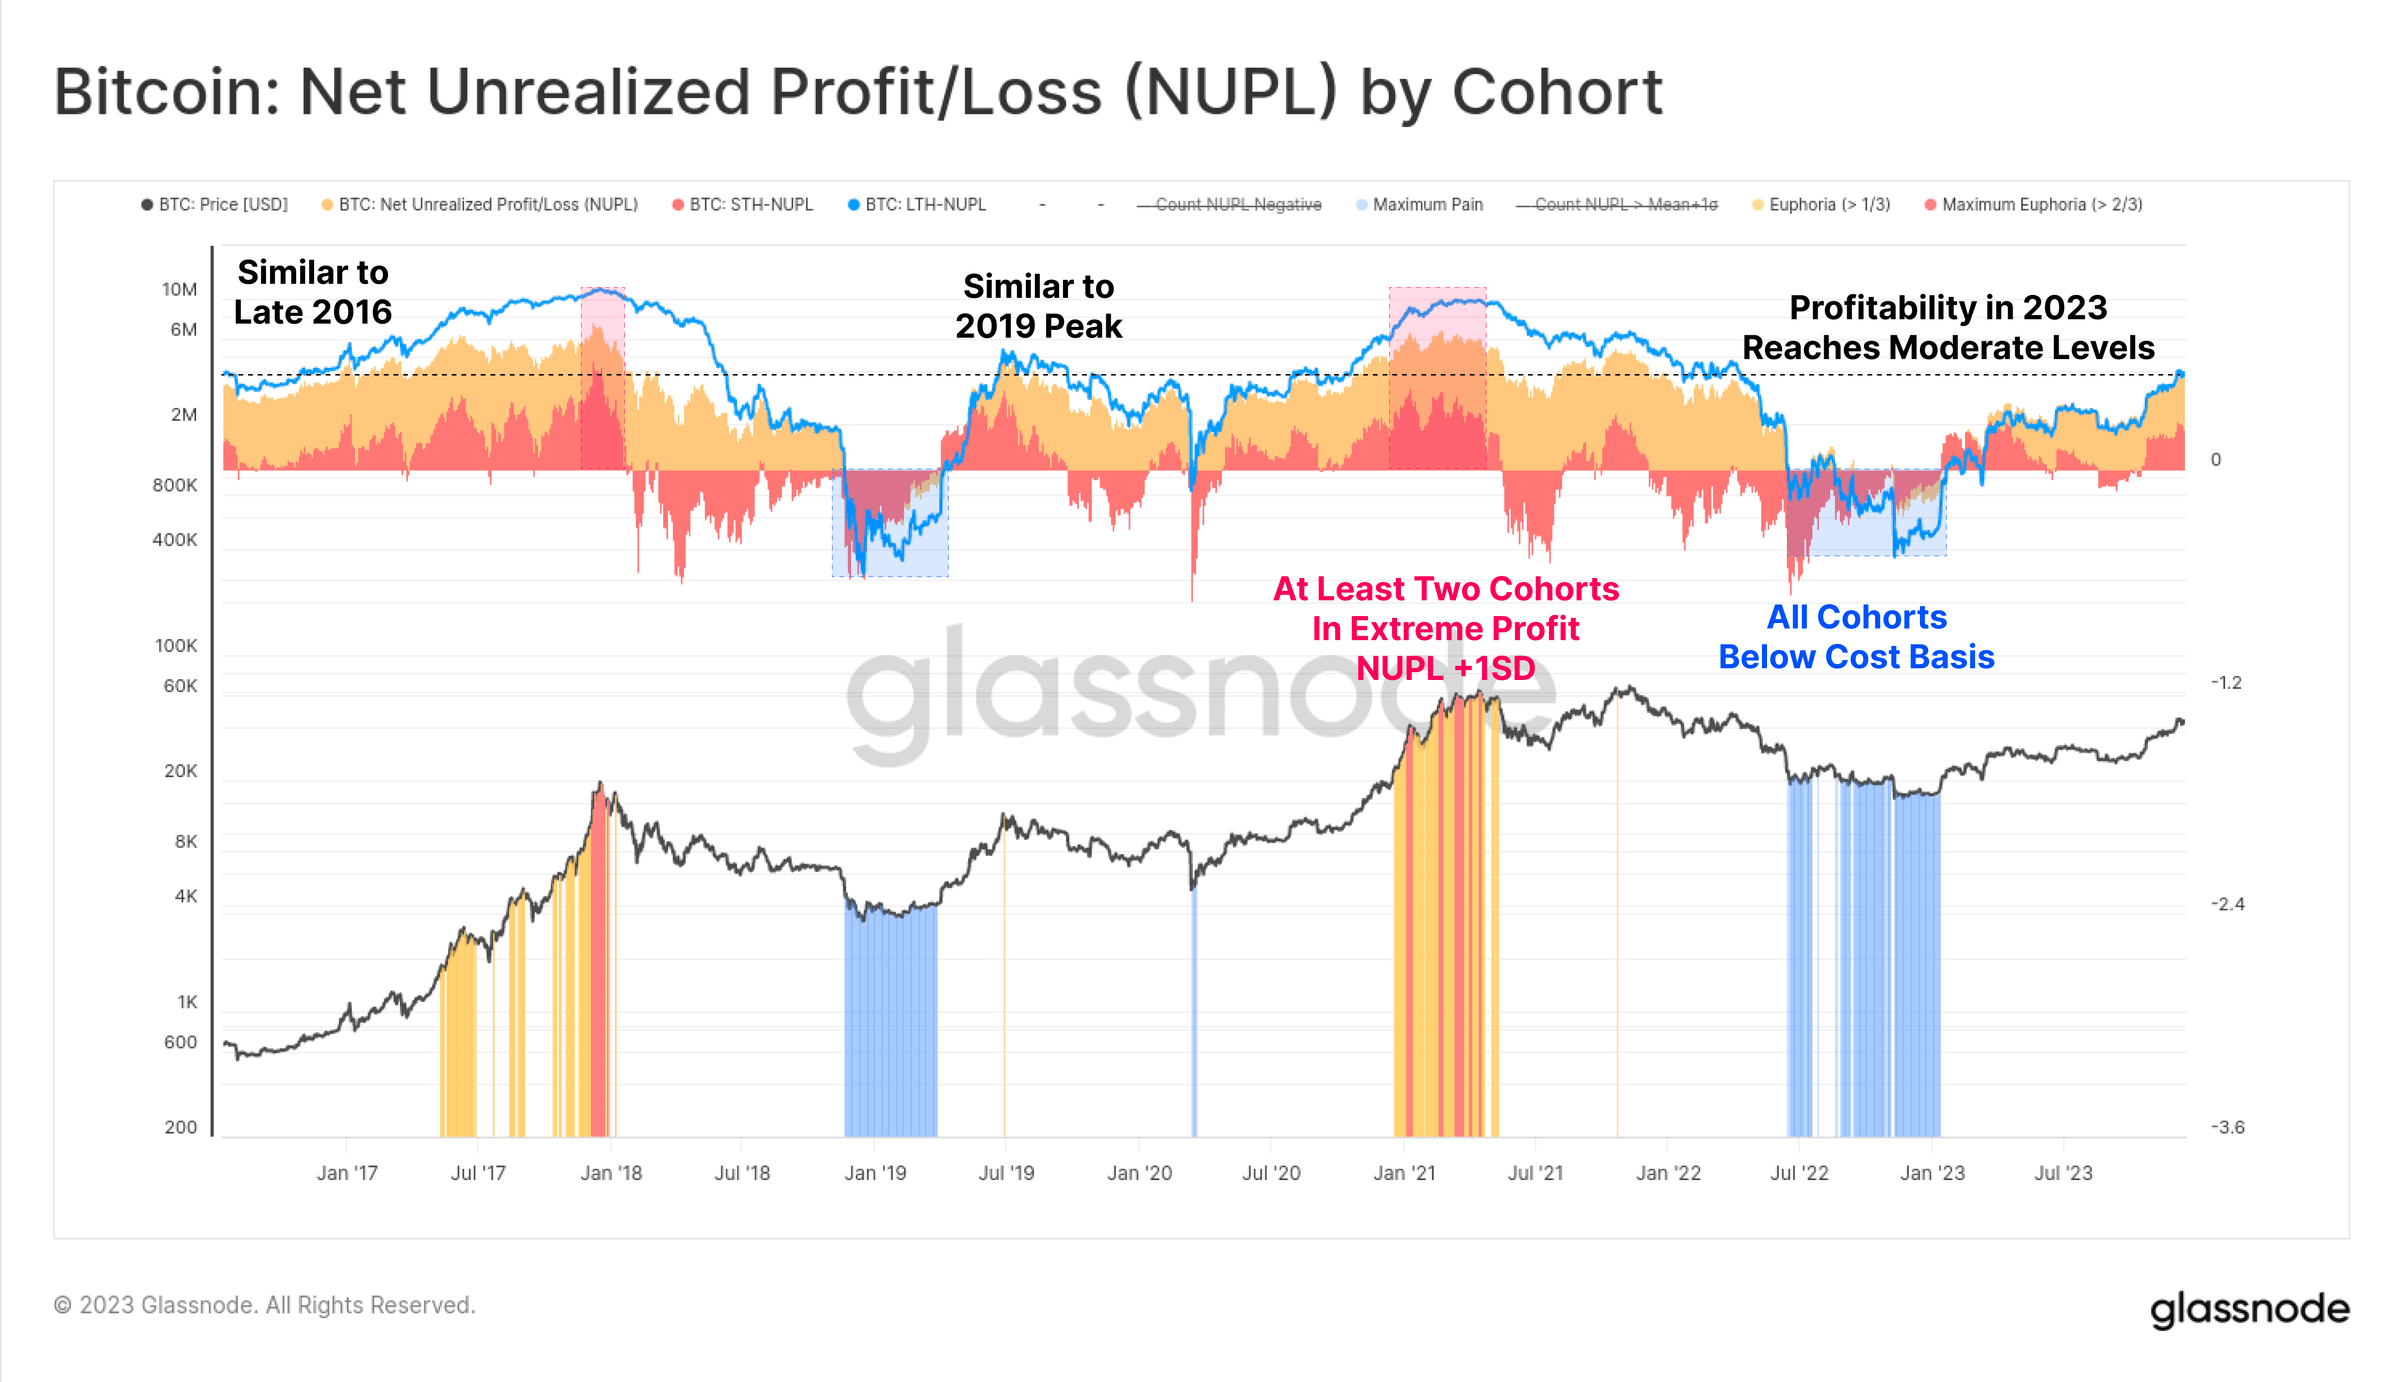 Figure 23: Unrealized gains and losses by group
The maturing derivatives market
A striking feature of the 2020-23 cycle is that futures and options markets have become the go-to place for price exposure and liquidity. 2023 is proving to be an important year in this development, as the options market’s open interest has grown to rival or exceed the futures market in size.
Currently, both have open interest between $16 billion and $20 billion, with Deribit continuing to dominate the options space (90%+). Illustrating the growing interest in Bitcoin from institutional investors, traders and positions often use the options market to deploy more complex trading, risk management and hedging strategies.
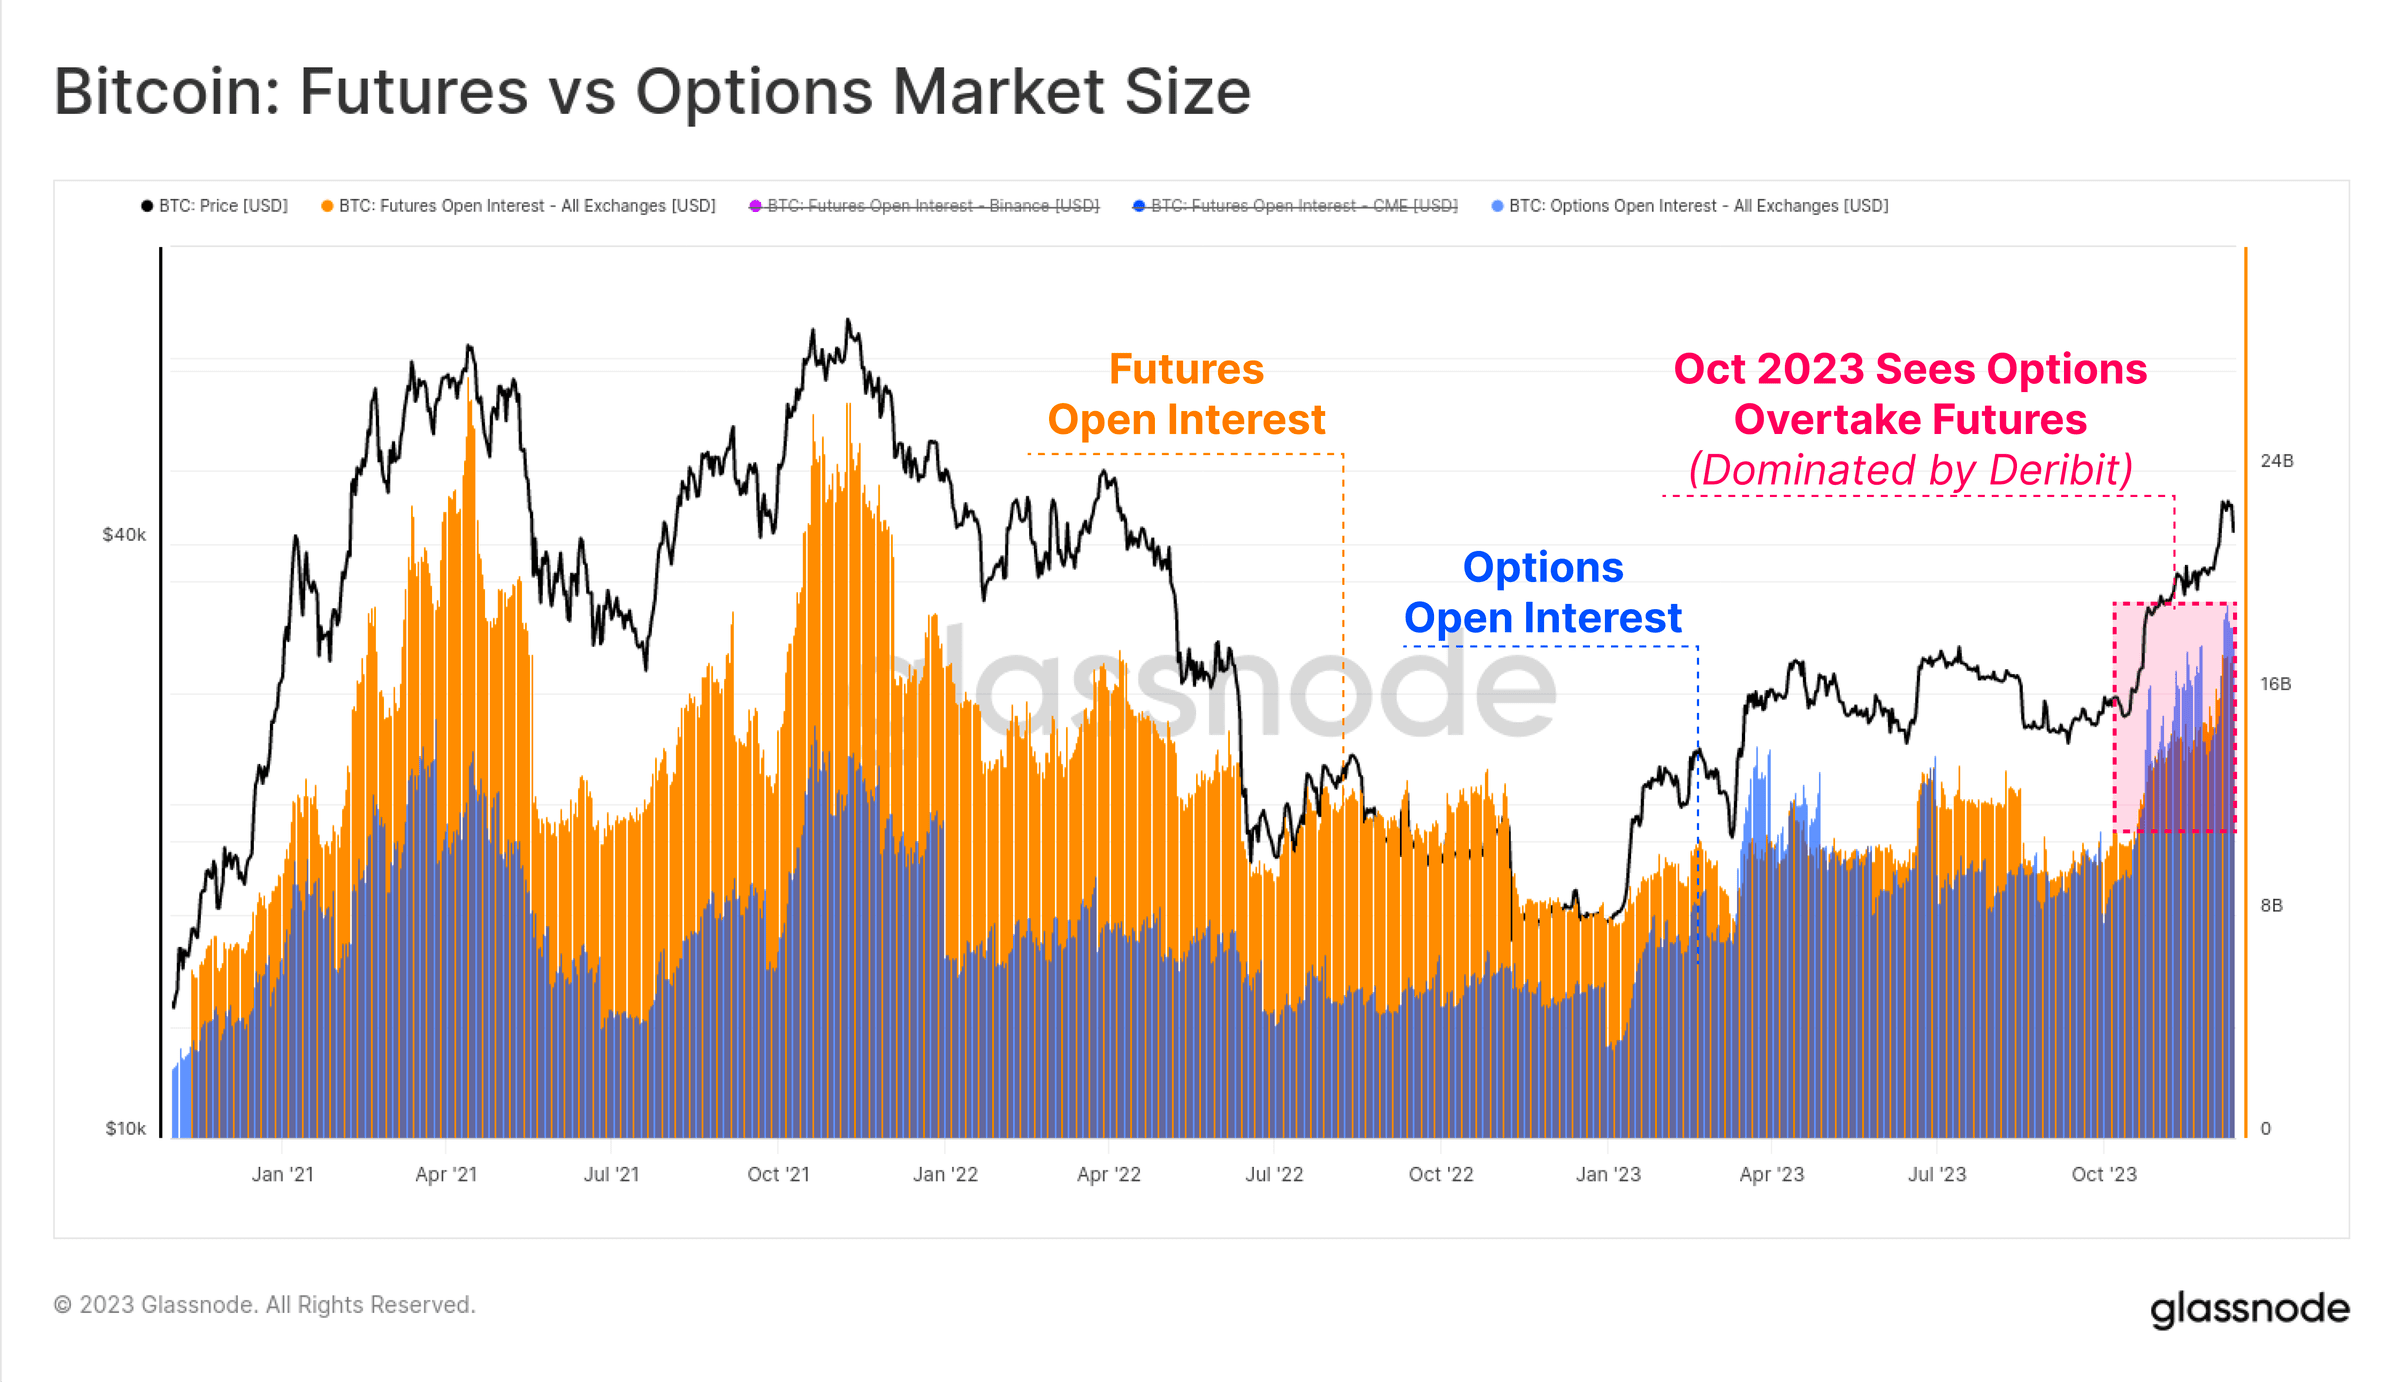 Figure 24: Bitcoin: Futures and Options Market Size
Notably, there's also been a shift in dominance within the futures market, with regulated Chicago Mercantile Exchange (CME) holding more open interest than offshore trading platform Binance for the first time in history. October once again appears to be an important moment in this transition, highlighting the influx of institutional capital.
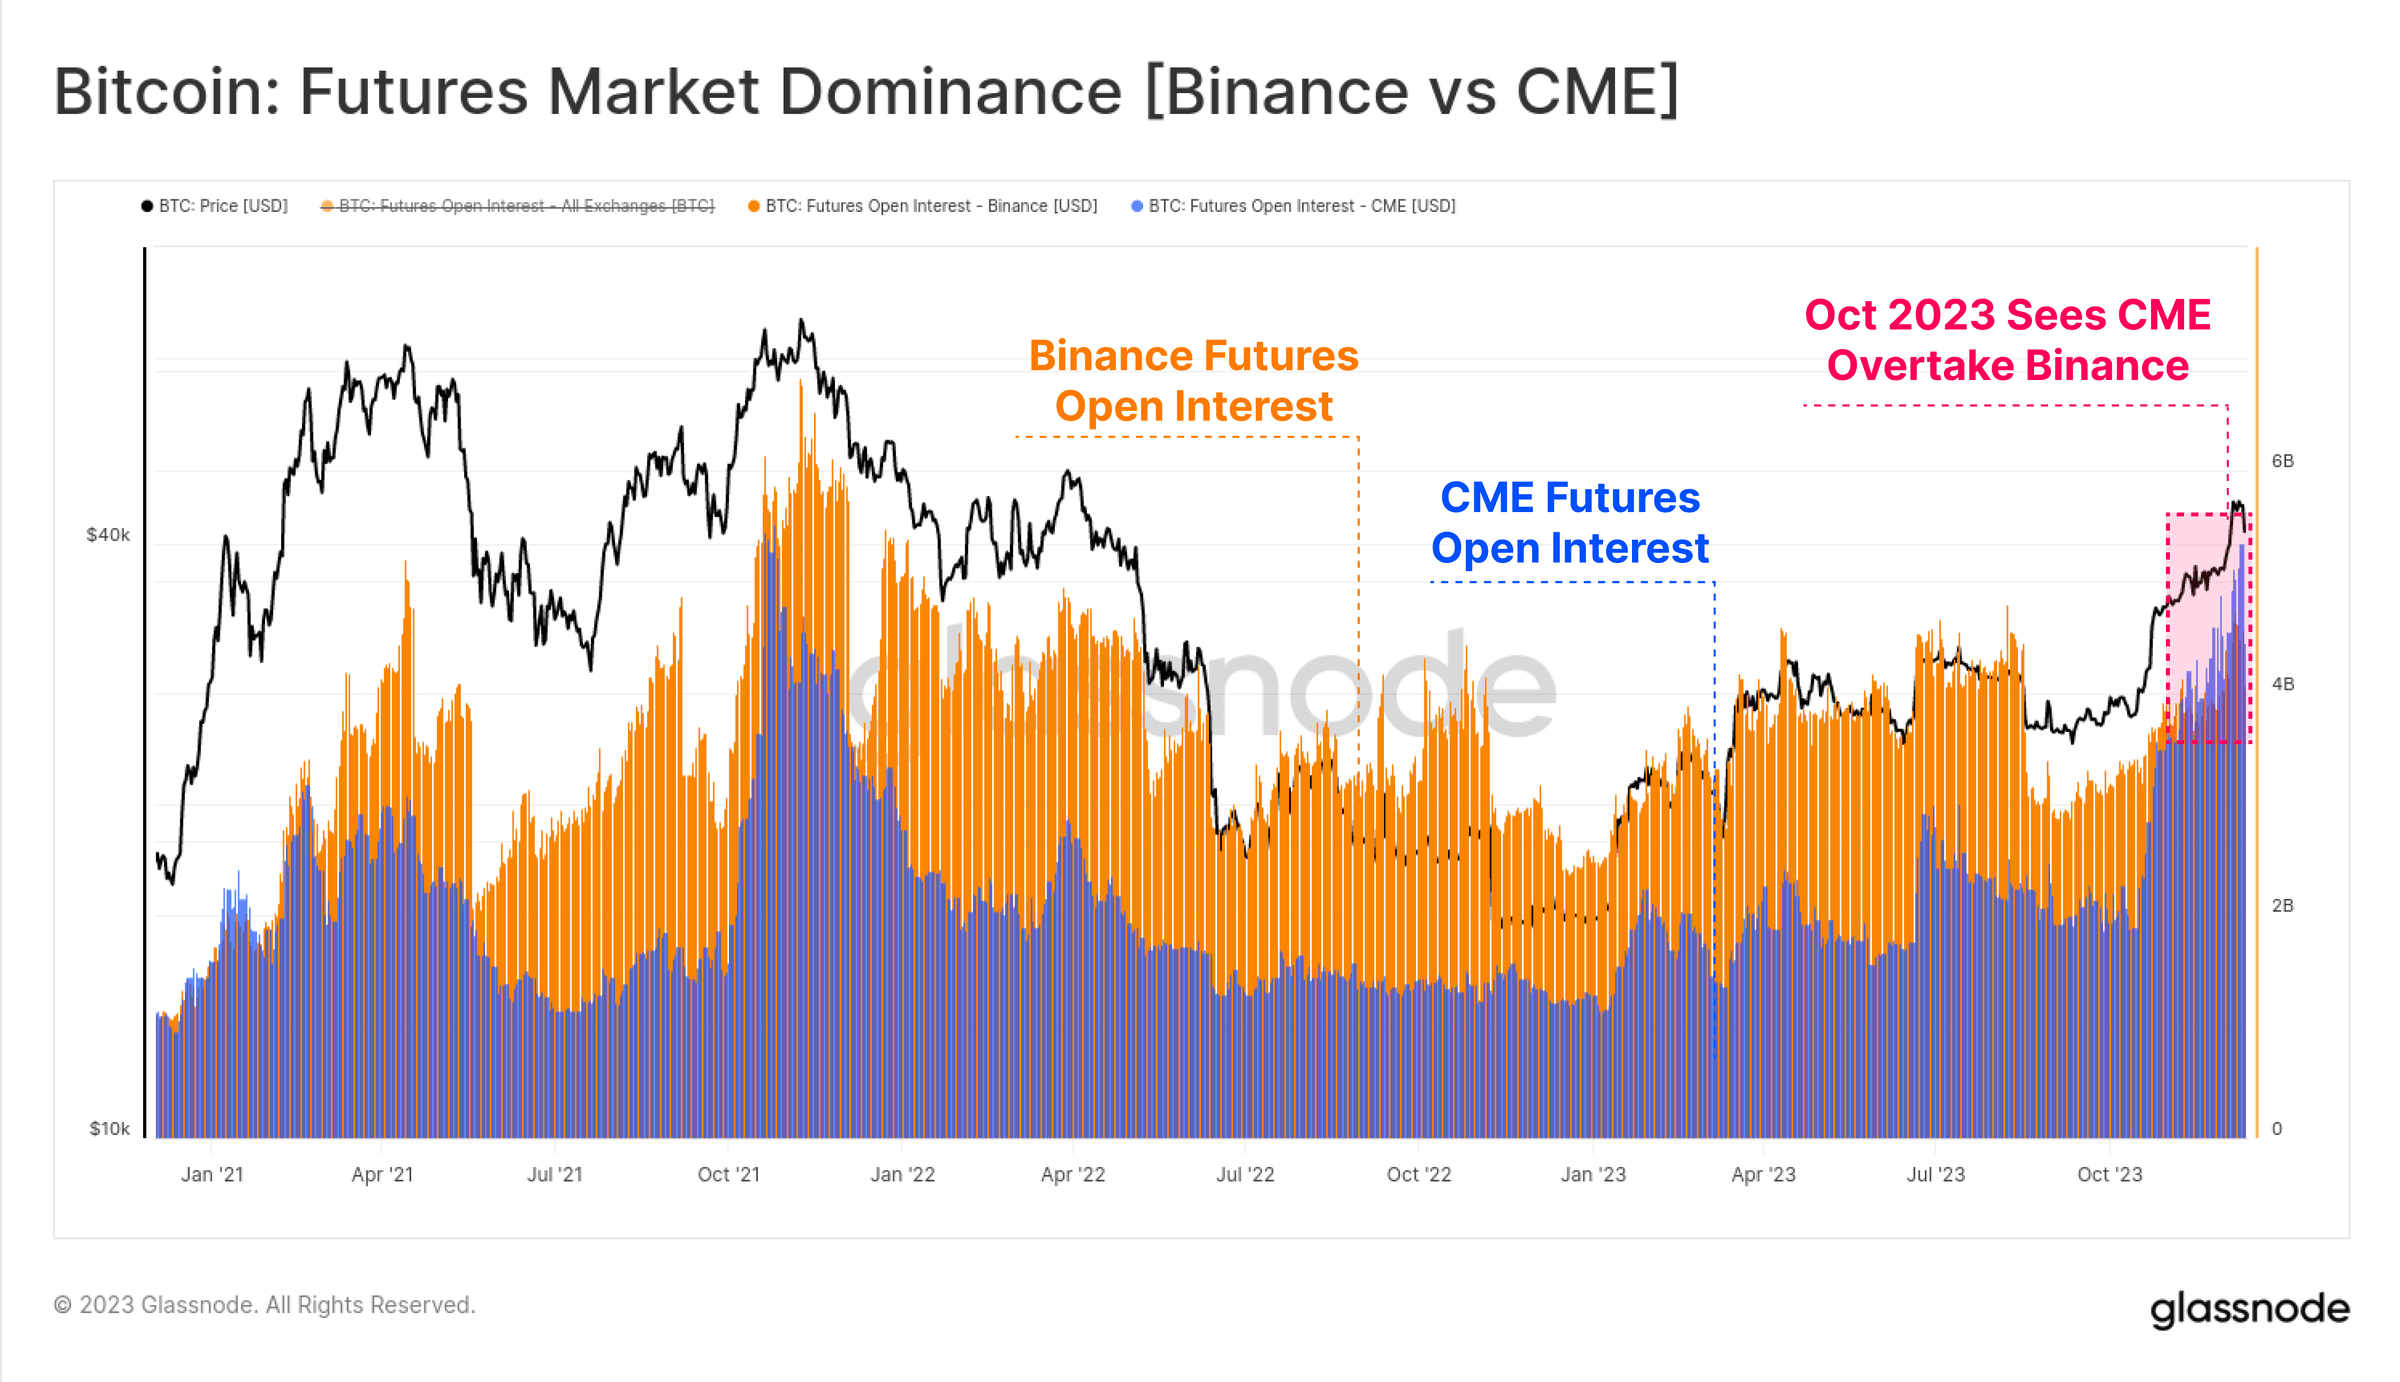 Figure 25: Futures market dominance (Binance vs CME)
Futures trading volumes for both BTC and ETH increased in October, with a total daily trading volume of $52 billion. Bitcoin contracts account for around 67% of trading volume, while Ethereum contracts account for 33%.
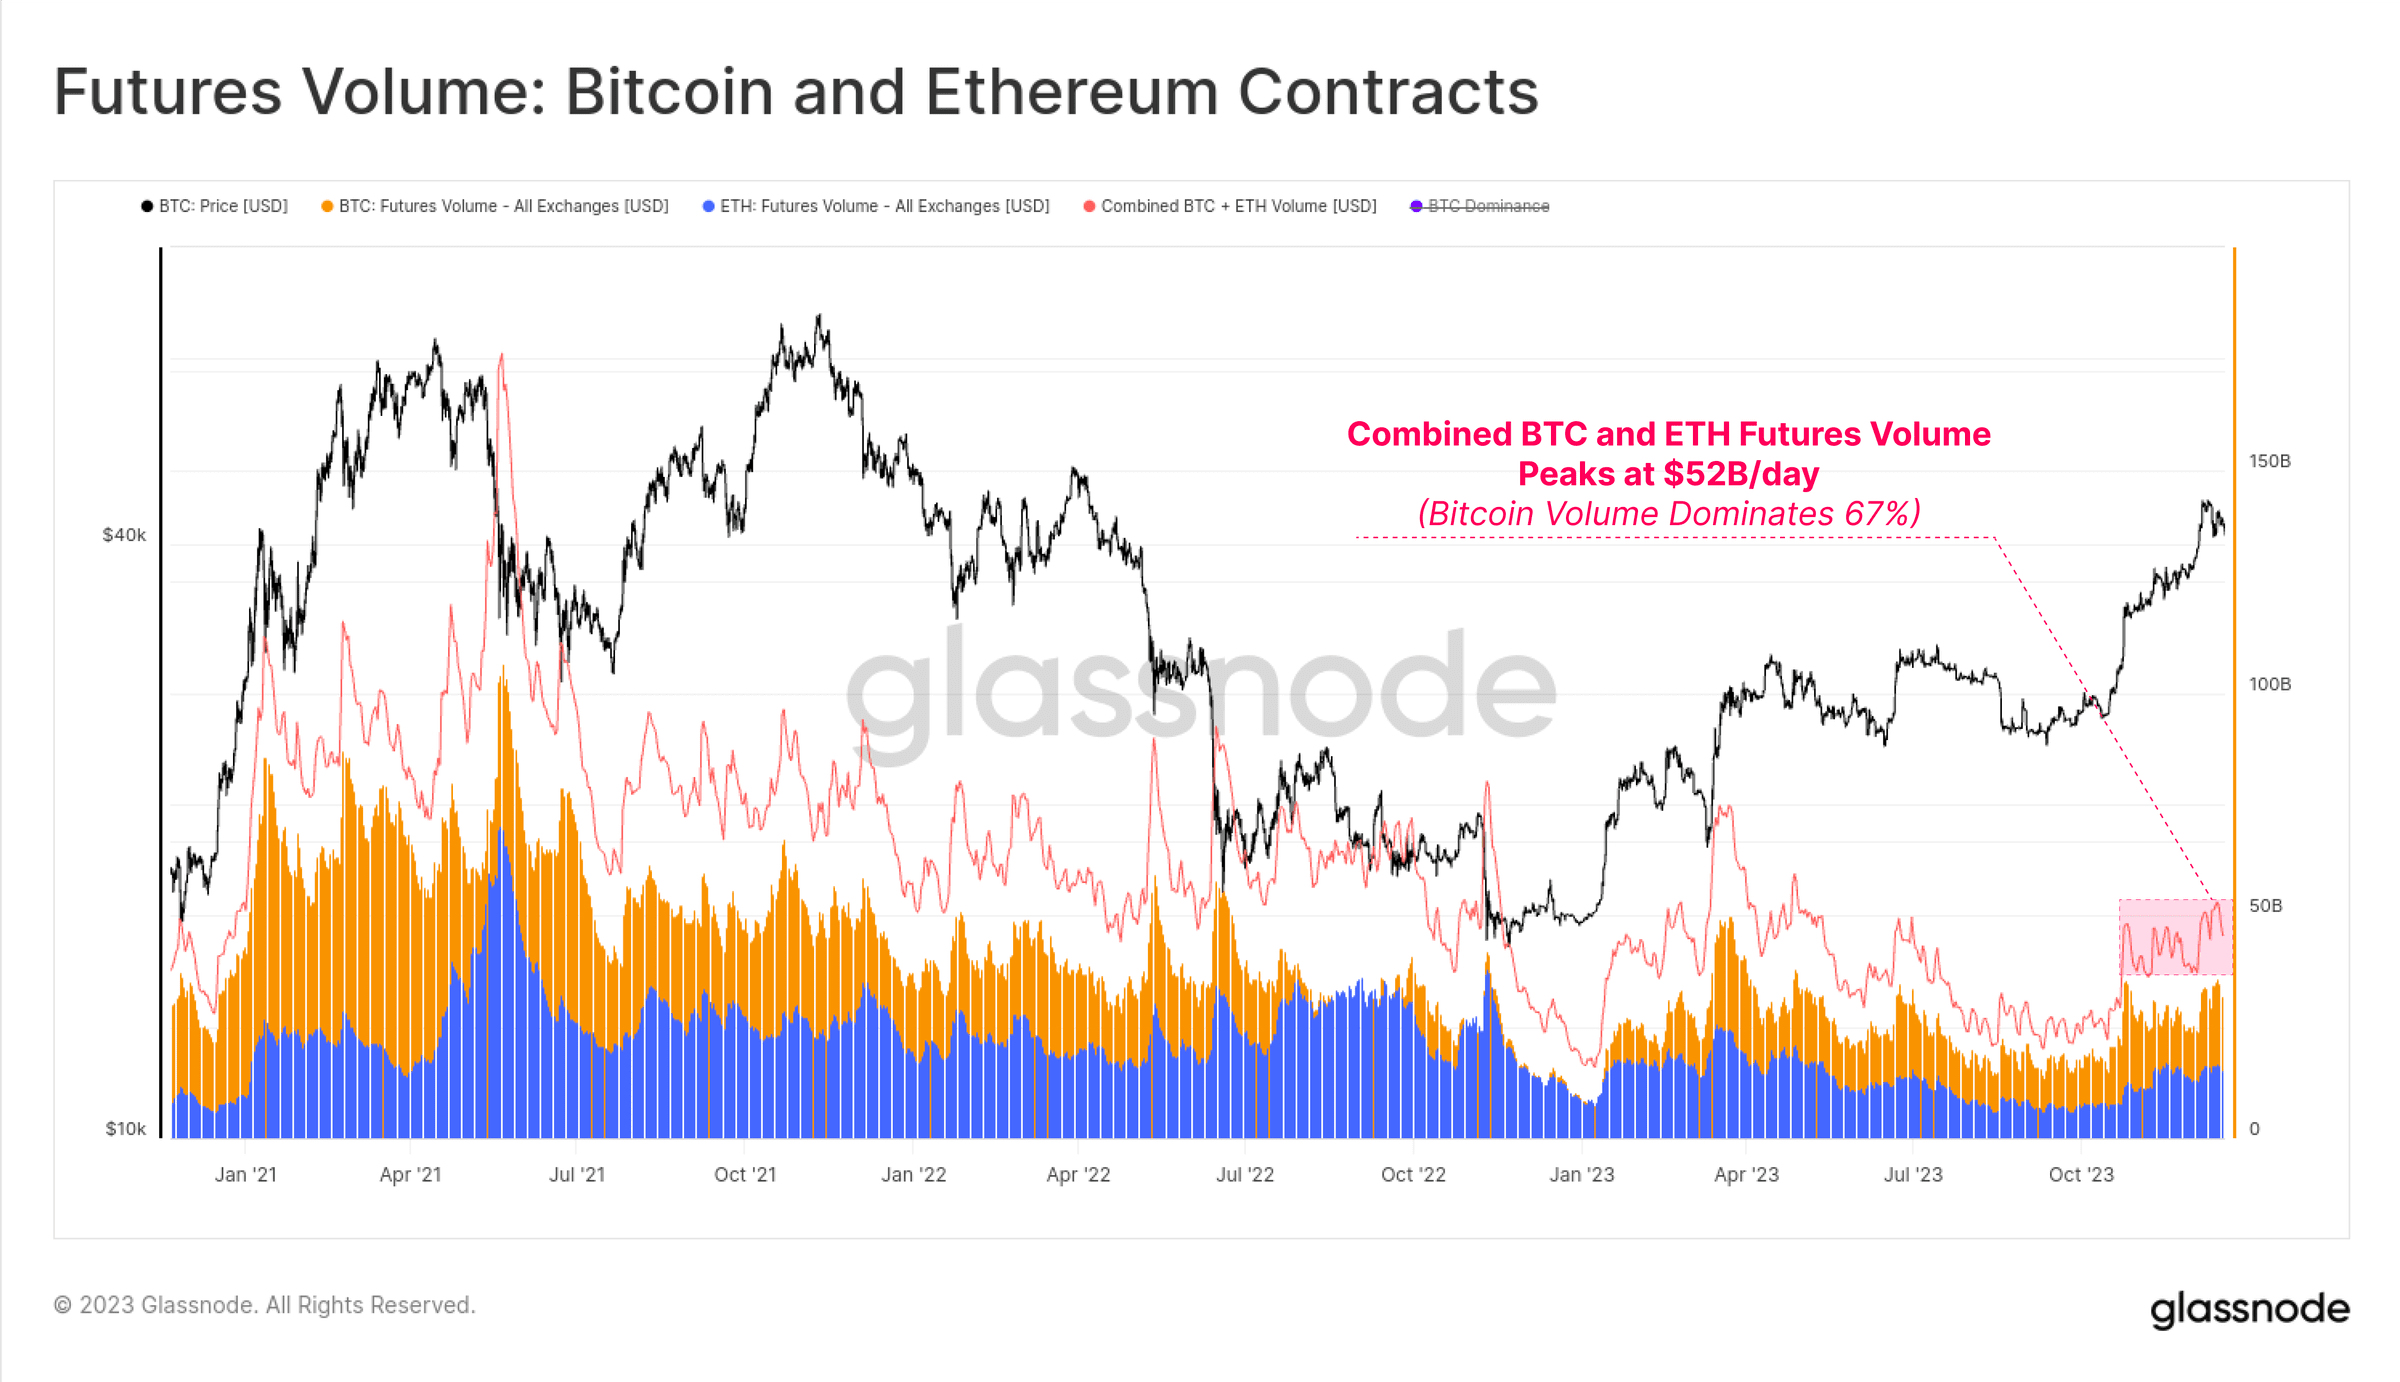 Figure 26: Futures Value: Bitcoin and Ethereum Contracts
Positive carry option returns in the futures market go through three distinct phases over the course of the year, which also tells the story of capital inflows into the sector:
From January to August, yields fluctuated around 5%. This is largely in line with short-term Treasury yields, making the product relatively unattractive given the additional risk and complexity of the trade.
From August to October, after a sell-off to $26,000, yields were below 3% and volatility was surprisingly low.
Since October, yields have topped 8%. With the futures benchmark currently holding 300 basis points above U.S. Treasuries, market maker capital now has momentum to return to the digital asset space.
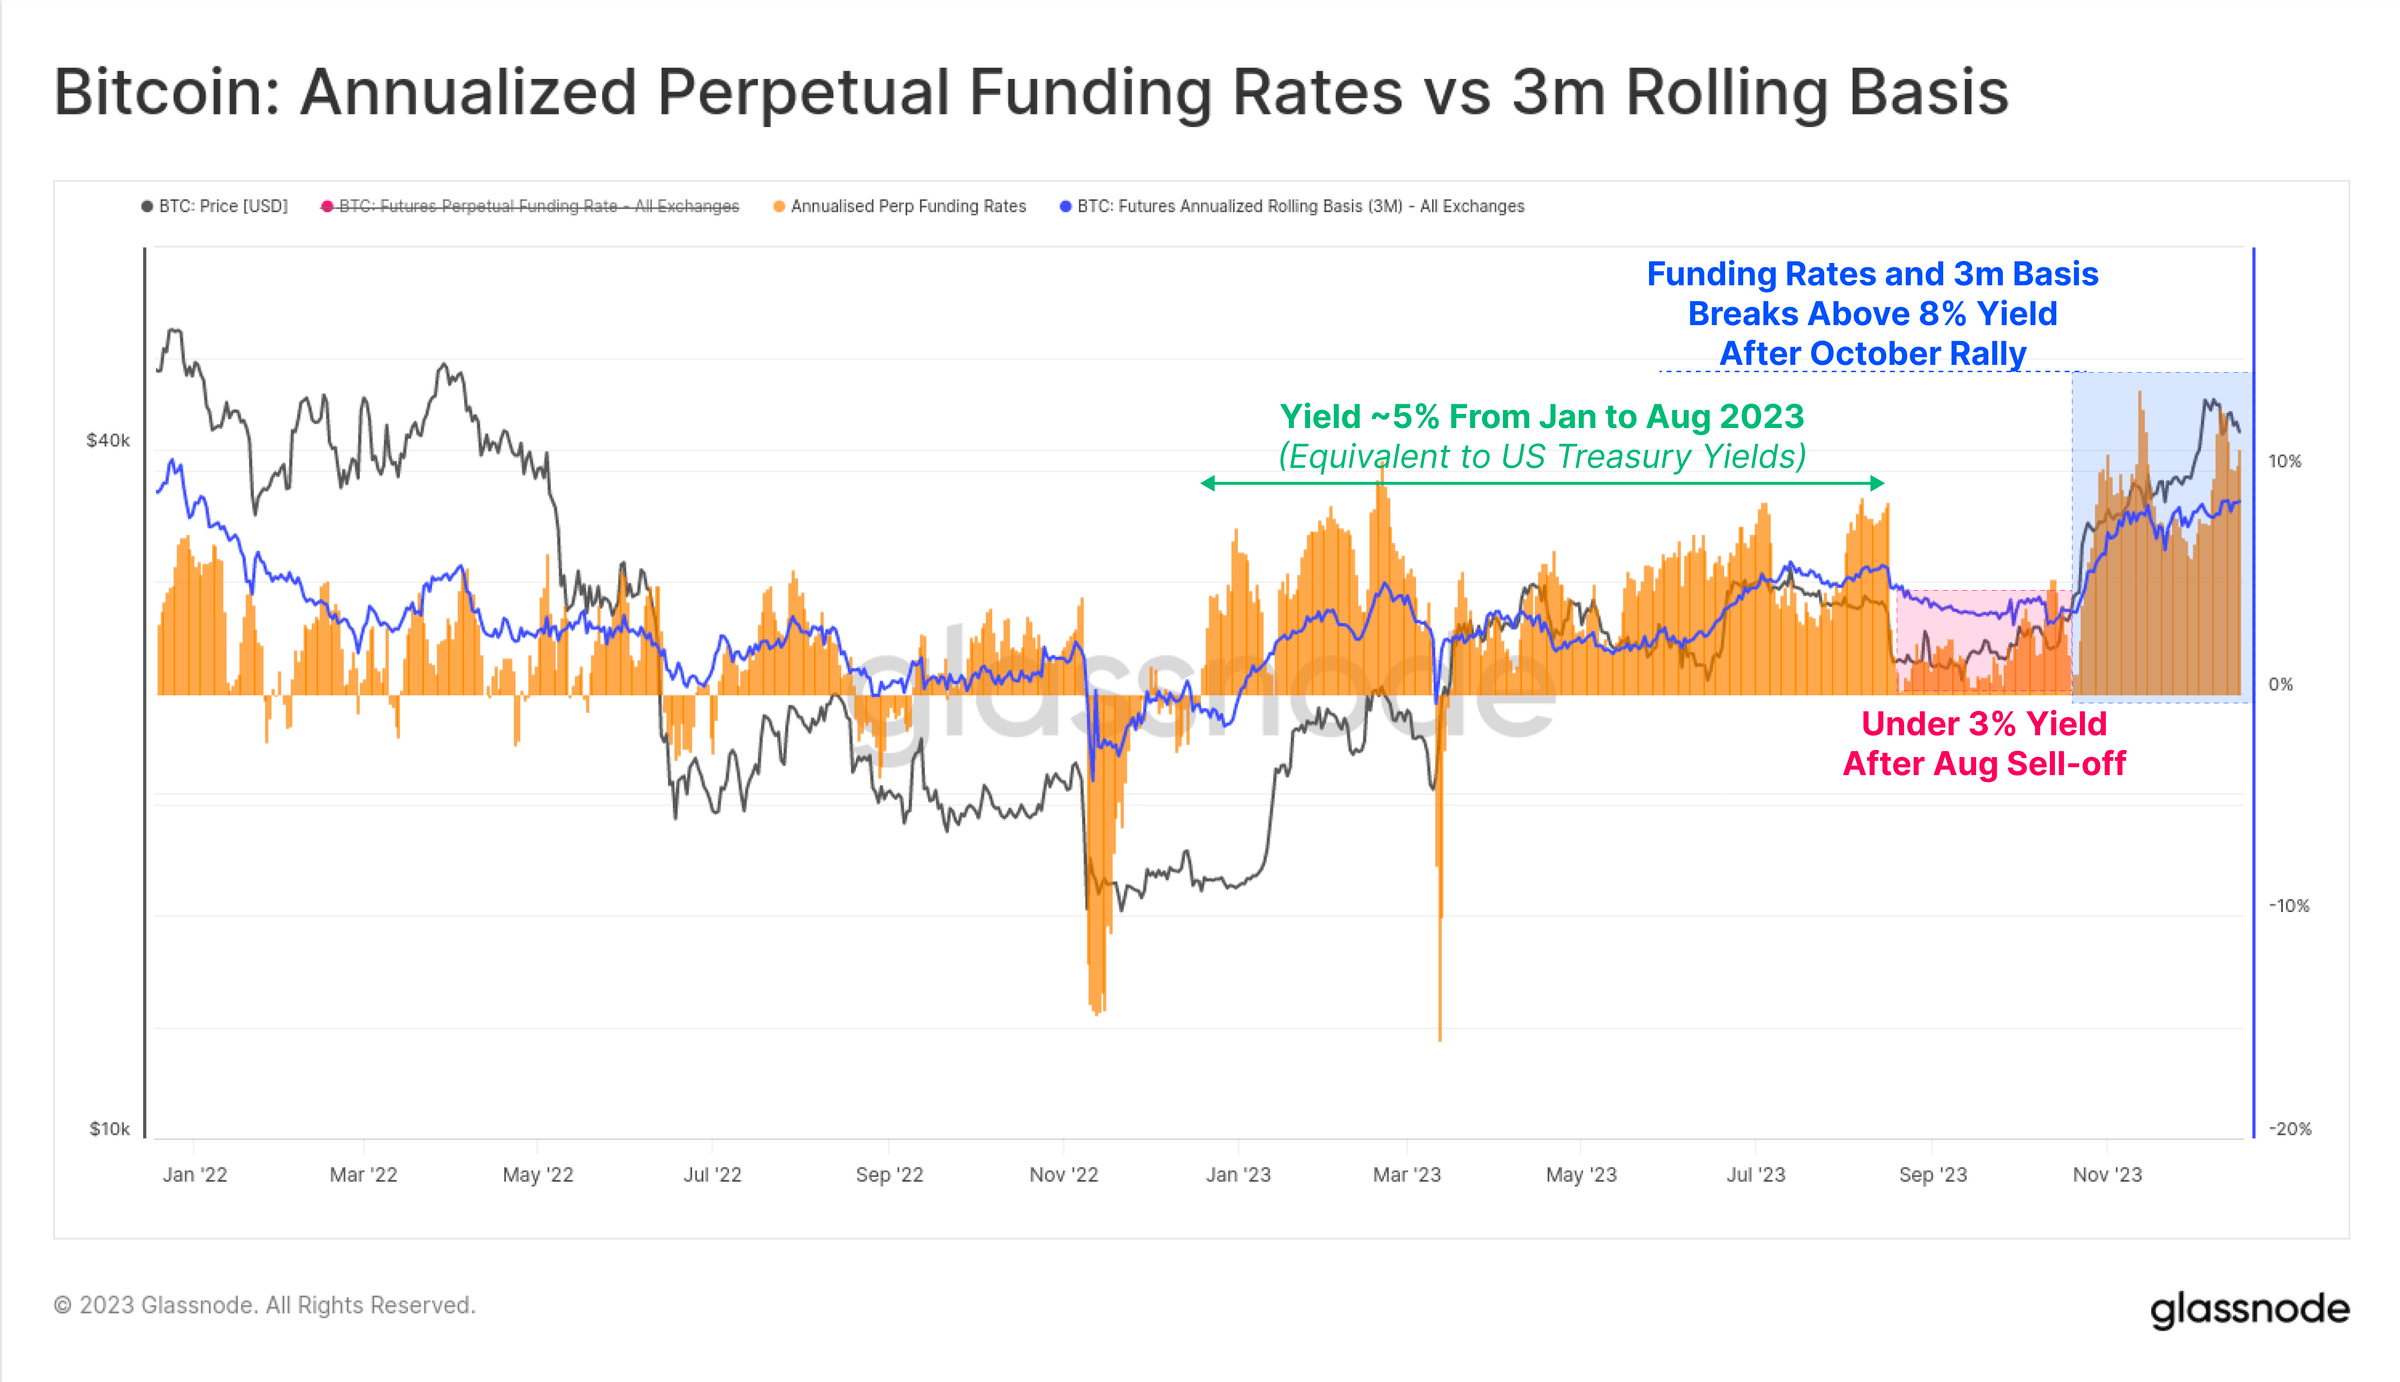 Figure 27: Bitcoin: Annualized Perpetual Financing Rate vs. 3-Month Rolling Benchmark
Stablecoin supply picks up
A relatively new phenomenon of the last cycle has been the outsized role that stablecoins have played in market structure, becoming traders’ medium of choice and a major source of market liquidity.
The total stablecoin supply has been declining since March 2022, down 26% from its peak, becoming a major drag on market liquidity. This is due to a combination of regulatory pressure (SEC alleges BUSD is a security), capital rotation (choosing US Treasuries over interest-free stablecoins), and waning investor appetite in the bear market.
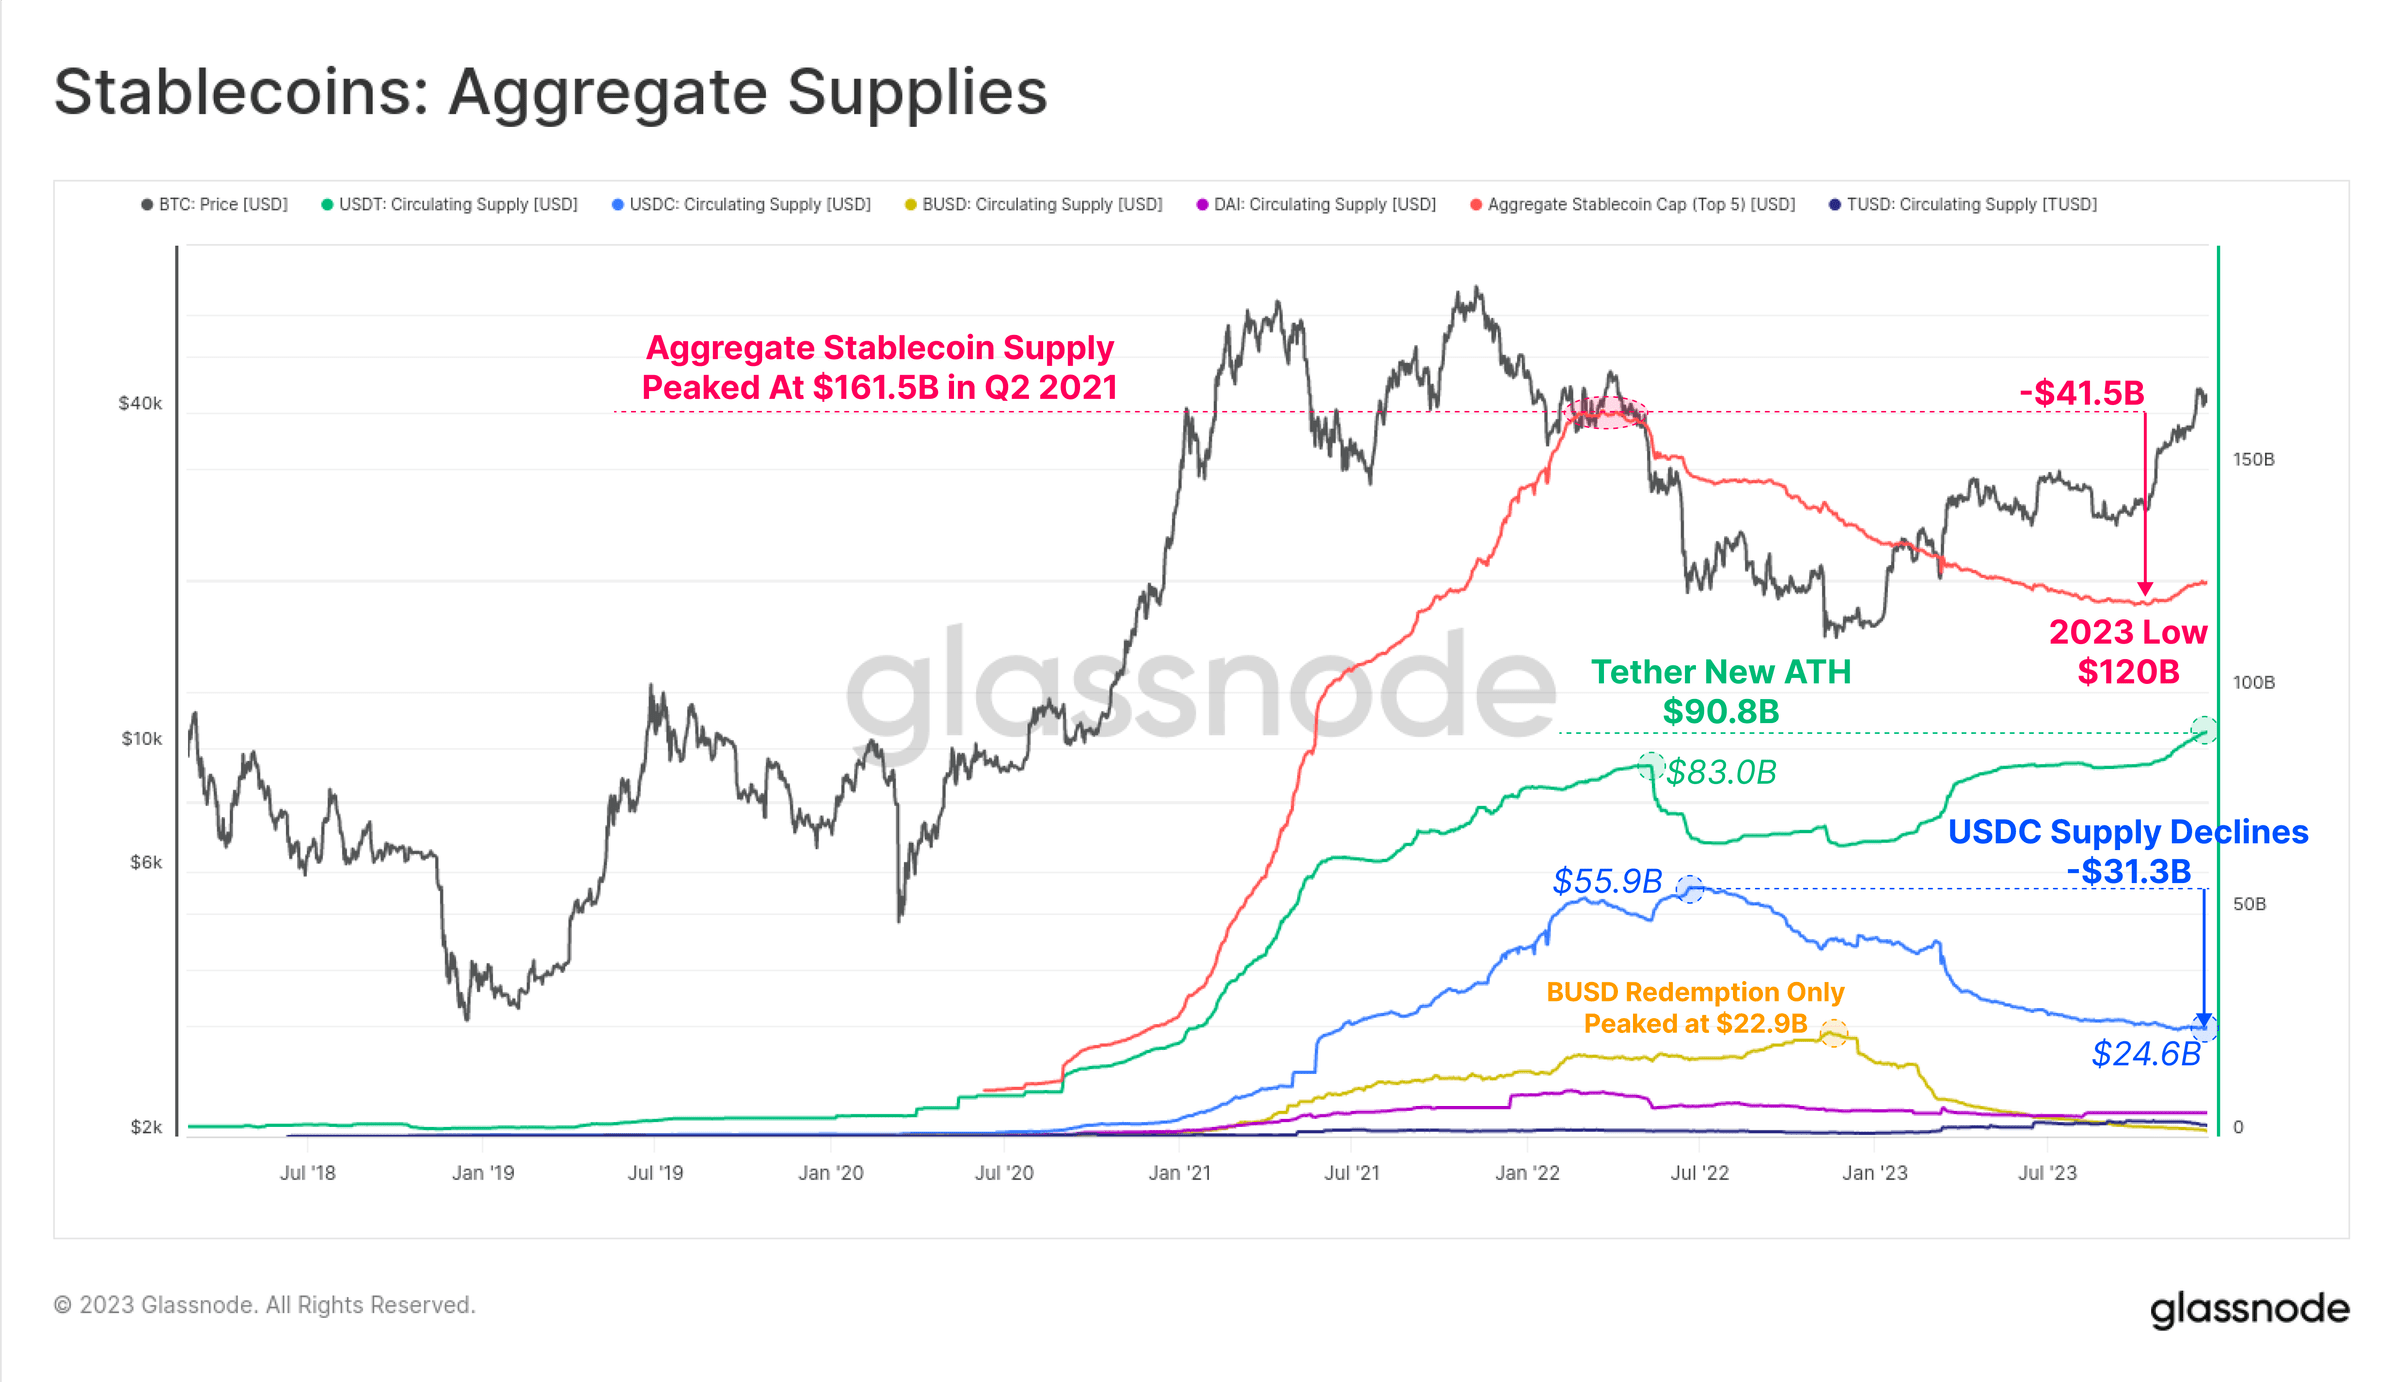 Figure 28: Stablecoins: Total Supply
However, October was a critical point, with total stablecoin supply bottoming out at $120 billion and supply beginning to grow at a rate of up to 3% per month. This was the first expansion in stablecoin supply since March 2022 and could be a sign of returning investor interest.
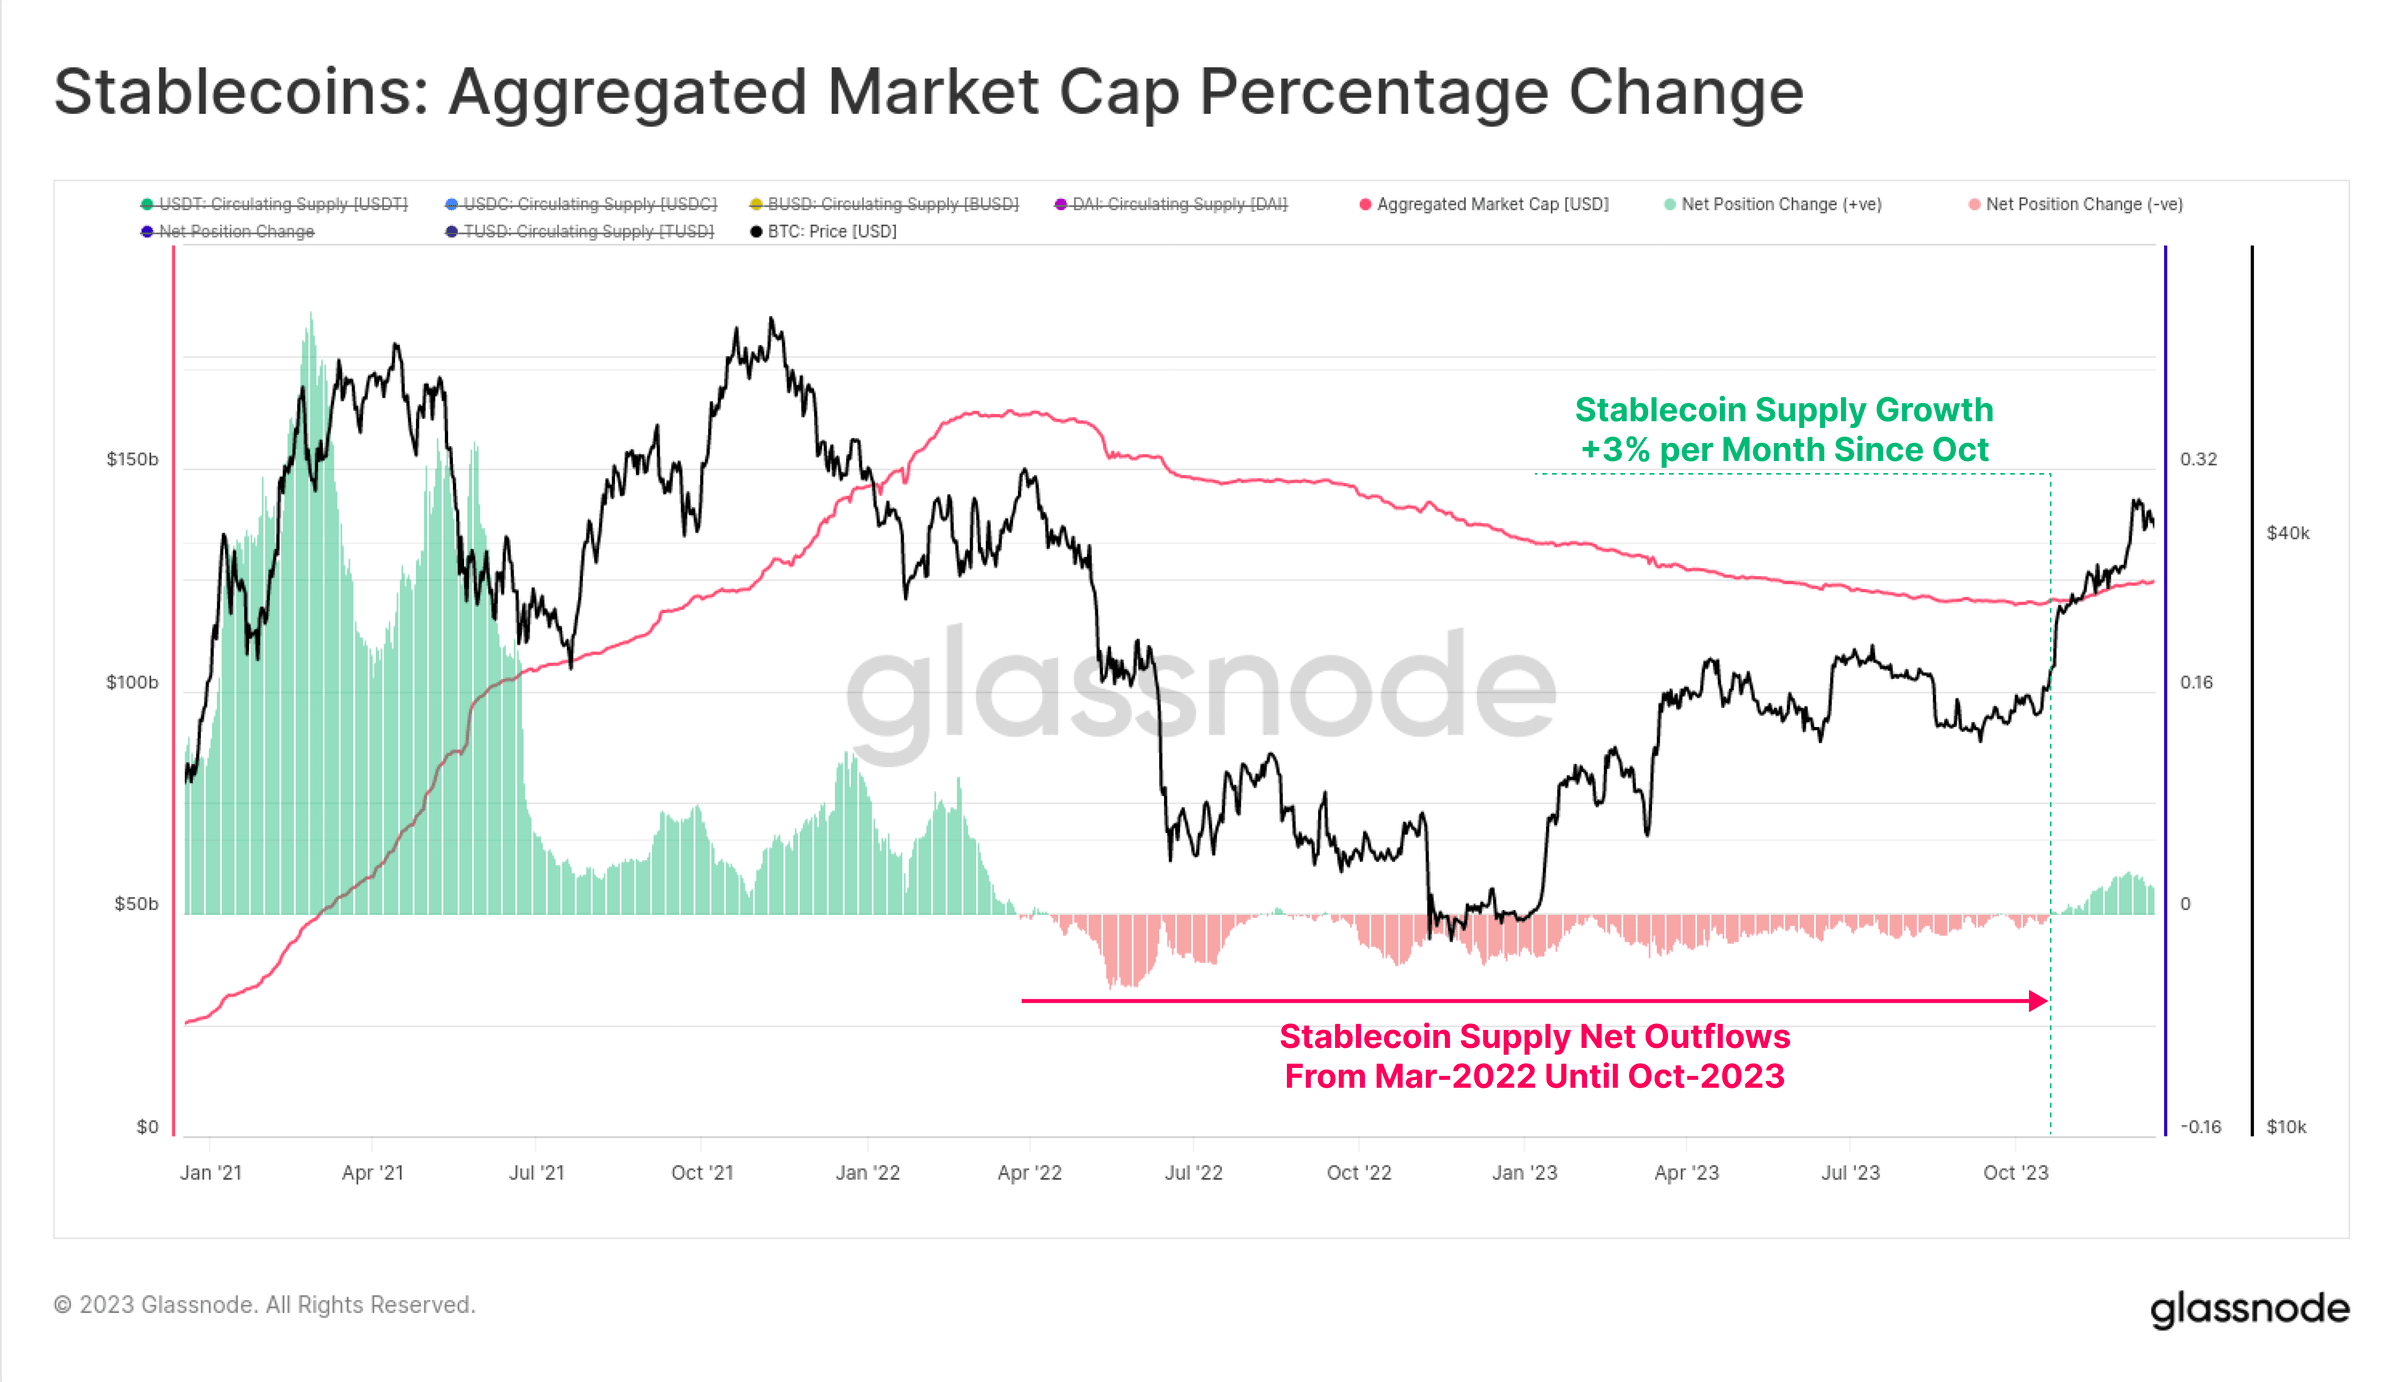 Figure 29: Stablecoins: Percent change in total market capitalization
The relative dominance among the various stablecoins has also changed significantly between 2022 and 2023. The dominance of previously rising stablecoins such as USDC and BUSD has shrunk significantly, with BUSD entering redemption-only mode, while USDC’s dominance has dropped from 37.8% to 19.6% since June 2022.
Tether (USDT) is once again the largest stablecoin, with total supply climbing to over $90.6 billion, accounting for 72.7% of the market.
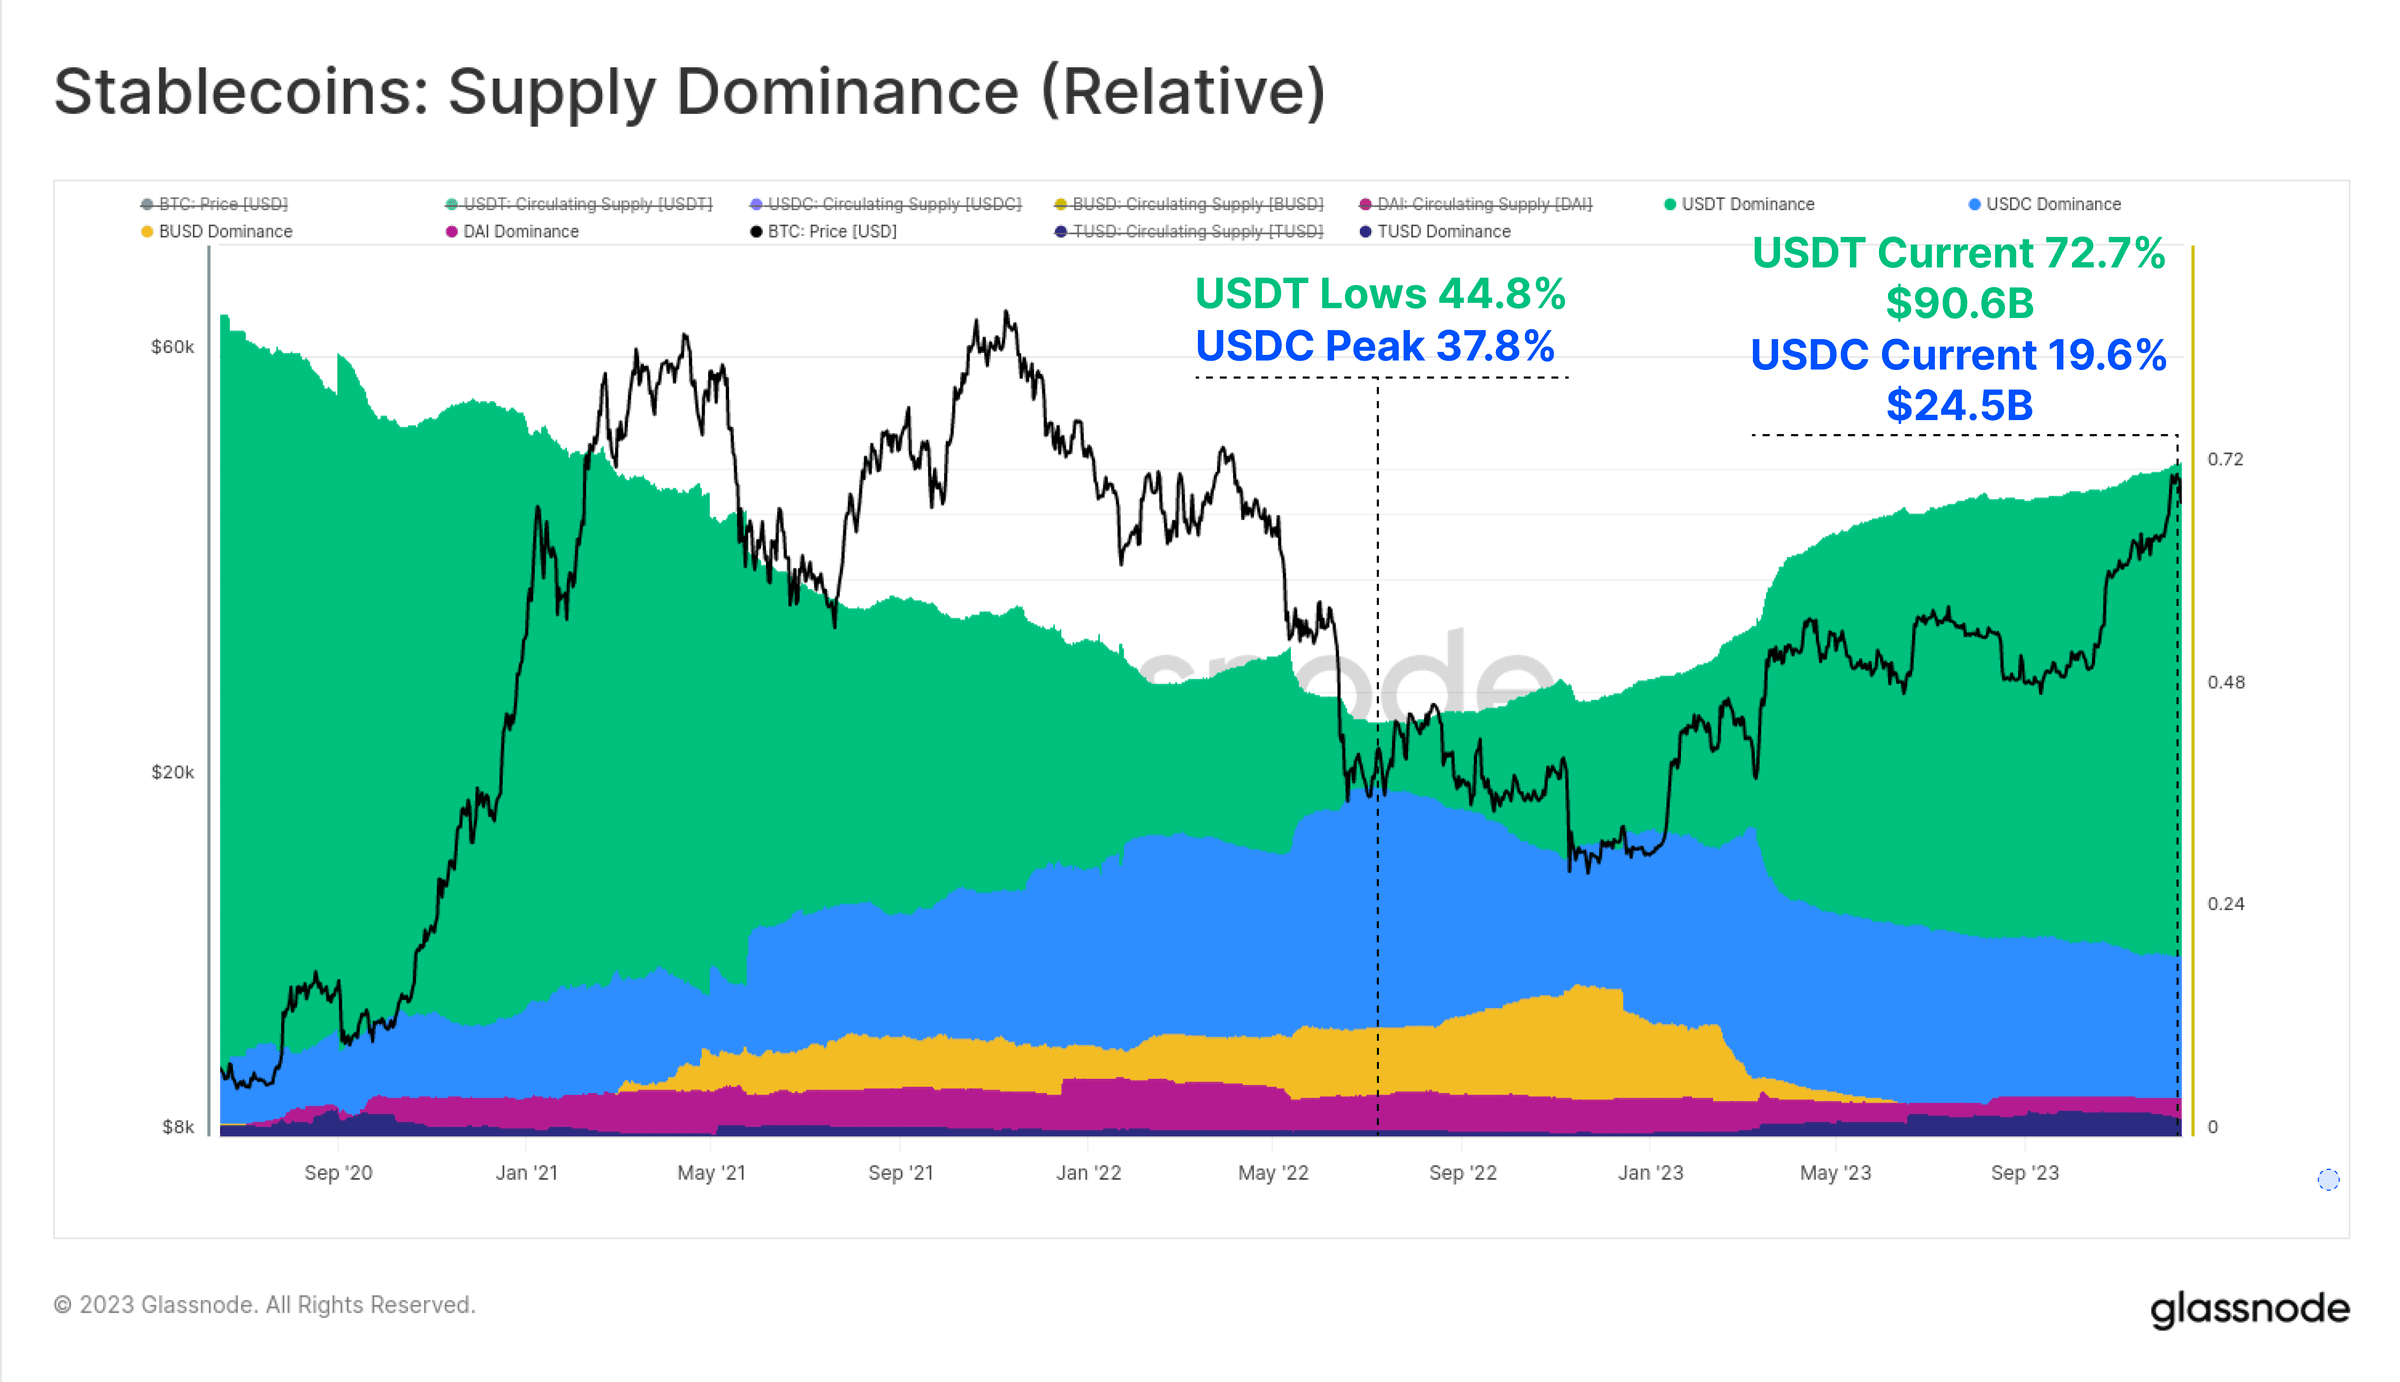 Figure 30: Stablecoins: supply share (relative)
Finally, we can compare the 30-day changes in realized market cap for BTC and ETH with stablecoins. These three indicators help visualize and measure relative capital flows and rotations between industries.
October was a critical moment again, with capital inflows turning positive for all three assets. This follows the market’s breakout of the key $30,000 level, expanding institutional interest in the derivatives market, and consistent net capital inflows across the three major digital assets.
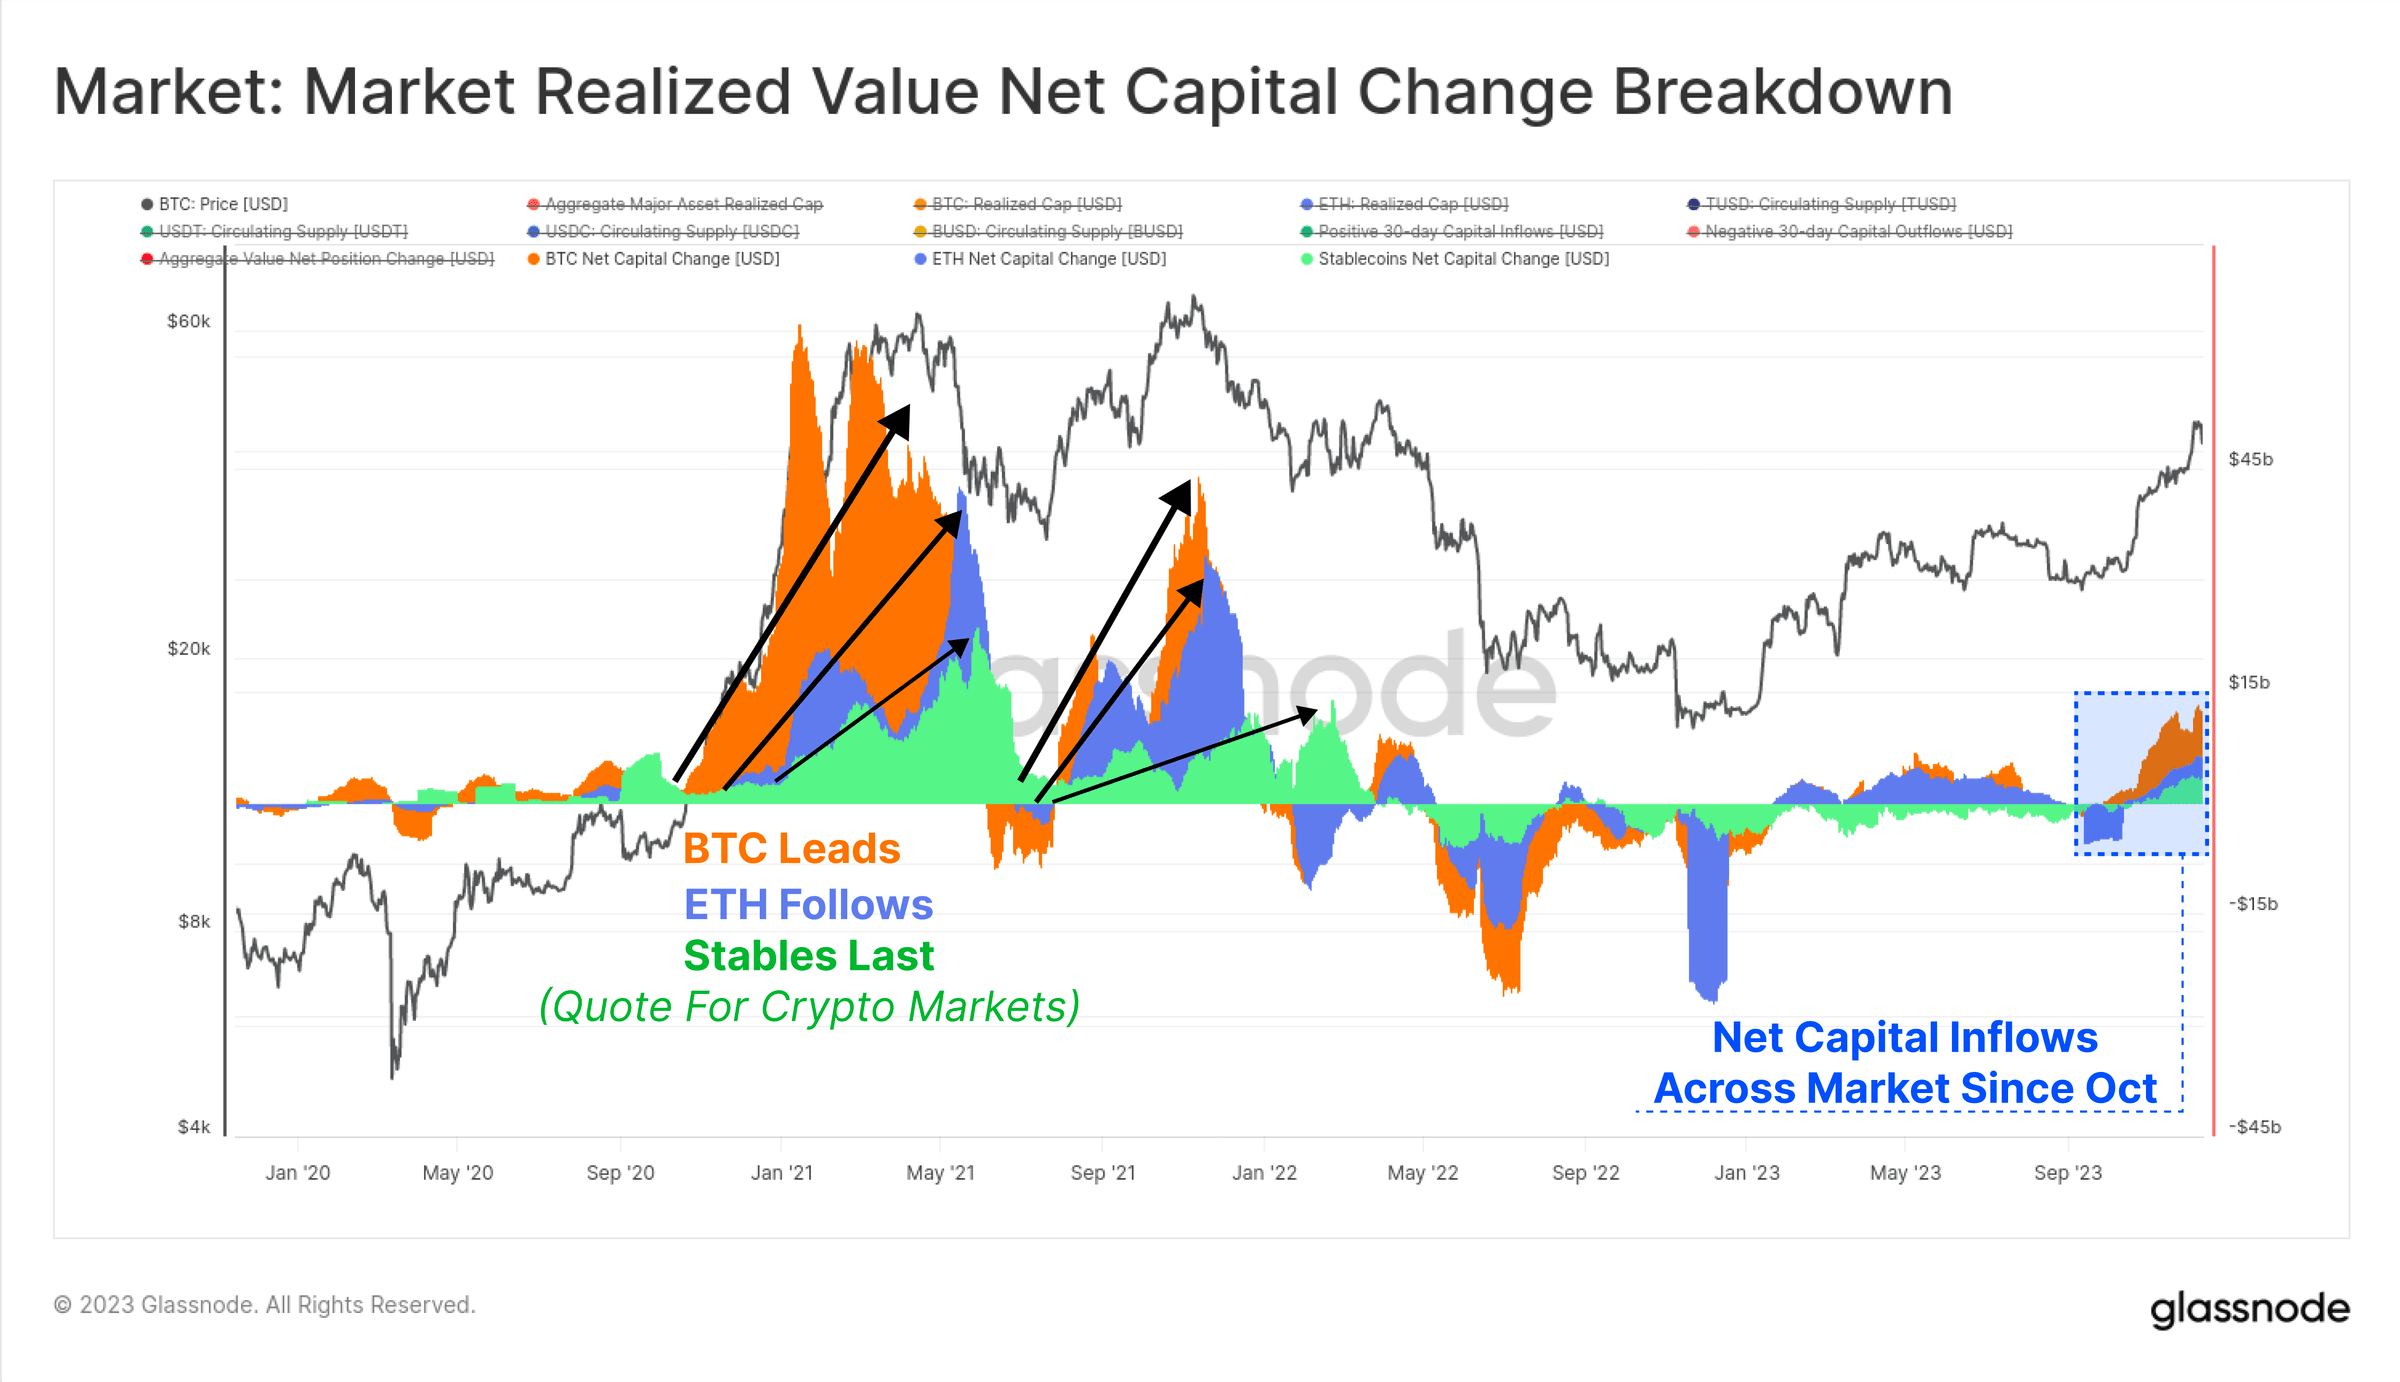 Figure 31: Market: Market Realized Value Net Capital
Summarize
2023 is a stark departure from the devastating deleveraging and market declines of 2022. Instead, this year has seen a renewed interest in digital assets, which can be attributed to their outperformance and the emergence of a new type of asset, Bitcoin Inscription.
Bitcoin supply is currently tightly held by long-term holders, and most investors are in profit on their Bitcoin holdings. With the increasing likelihood of a US Bitcoin ETF launching in early 2024, and the upcoming Bitcoin halving in April, the stage is set for an exciting year ahead.
Article source: https://insights.glassnode.com
Original author: Checkmate, Glassnode
Original link: https://insights.glassnode.com/the-week-onchain-week-51-2023/

