In the ever-changing landscape of digital currencies, BTC's position as an industry benchmark remains solid. Now, let's delve into the price trends of BTC/USDT over the past month to provide investors with decision-making references.
Real-time Data Insights
Currently, the price of BTC/USDT is fixed at $106,414.12, which shows a significant rise of 4.06% compared to the previous day. The closing price yesterday was $102,264.33, while the intraday high today reached $106,500.99, and the low dipped to $100,119.04. The trading volume and turnover are also substantial, with a trading volume of 48,067.04 BTC and a turnover of as high as 4.965 billion USDT, which fully demonstrates the market's attention and activity level for BTC.
Monthly Trend Review
Looking back over the past month, the price trend of BTC/USDT has been impressive, showing a strong upward momentum. Starting from $66,835.00 at the beginning of the month, it soared to $109,588.00 by the end of the month, an increase of over 60%. This significant price growth has not only attracted the attention of numerous investors but has also further solidified BTC's leading position in the digital currency market. During the continuous price rise, trading volume also showed a closely following trend; trading volume often increases along with price rises, while it contracts during short-term price adjustments. This phenomenon of synchronized price and volume movement clearly indicates a high enthusiasm for trading among market participants, with the market in a highly active state.
Technical Indicator Interpretation
From a technical indicator perspective, the short-term moving averages (like MA5, MA10) are firmly above the long-term moving averages (like MA20, MA50). This classic technical formation is usually seen as a strong signal that short-term bullish forces prevail in the market, indicating that BTC prices may continue to perform strongly in the short term. However, investors should be cautious as the current Relative Strength Index (RSI) and Stochastic Indicator (KDJ) have both entered the overbought region. This means that at the current price level, the bullish forces in the market have been relatively fully released, and the risk of a price pullback is gradually accumulating in the short term.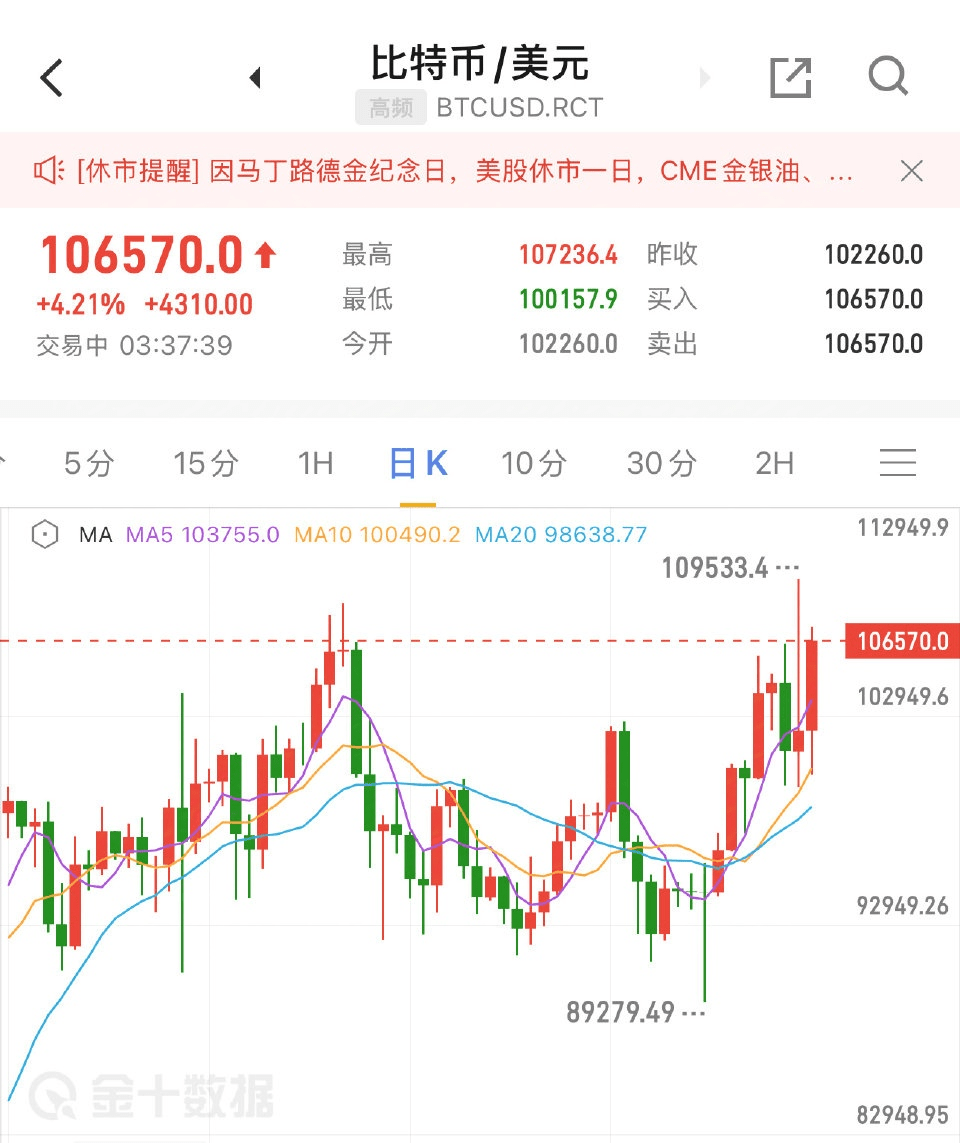
Trading Strategy Planning
1. Short-term Trading: Given the current market conditions, for investors who prefer short-term trading, it is advisable to closely monitor opportunities for price pullbacks. When prices pull back to around MA(5) or MA(10), if there are clear signals of a stop-loss, consider buying with a light position. During price increases, if encountering previous resistance levels, such as round numbers or previously dense trading areas, decisively sell to take profit. At the same time, it is essential to set a reasonable stop-loss level, suggesting that the stop-loss be placed 2%-3% below the purchase price to effectively control risk.
2. Medium to Long-term Trading: For medium to long-term investors who already hold BTC, based on BTC's strong long-term performance and the overall trend of the current market, it is advisable to continue holding firmly. When prices pull back to key support levels, such as around the monthly MA20 moving average, consider appropriately increasing positions to further average down costs and enhance long-term returns.
Key Points of Risk Management
Regardless of the trading strategy used, risk management is always the top priority in the investment process. Investors must set reasonable stop-loss levels, which should be adjusted based on individual risk tolerance and investment goals. Additionally, to reduce risk exposure to a single asset, it is recommended that investors diversify their investments, reasonably allocating funds to different types of digital currencies and traditional financial assets, thereby constructing a diversified investment portfolio to better cope with market uncertainties.
#加密市场回调 #币圈翻车日记:我的2024坑爹时刻 #加密友好Uyeda接掌SEC #特朗普就职后行情怎么走? #特朗普妻子发币 $BTC $ETH
