#BTC Analysis 📈
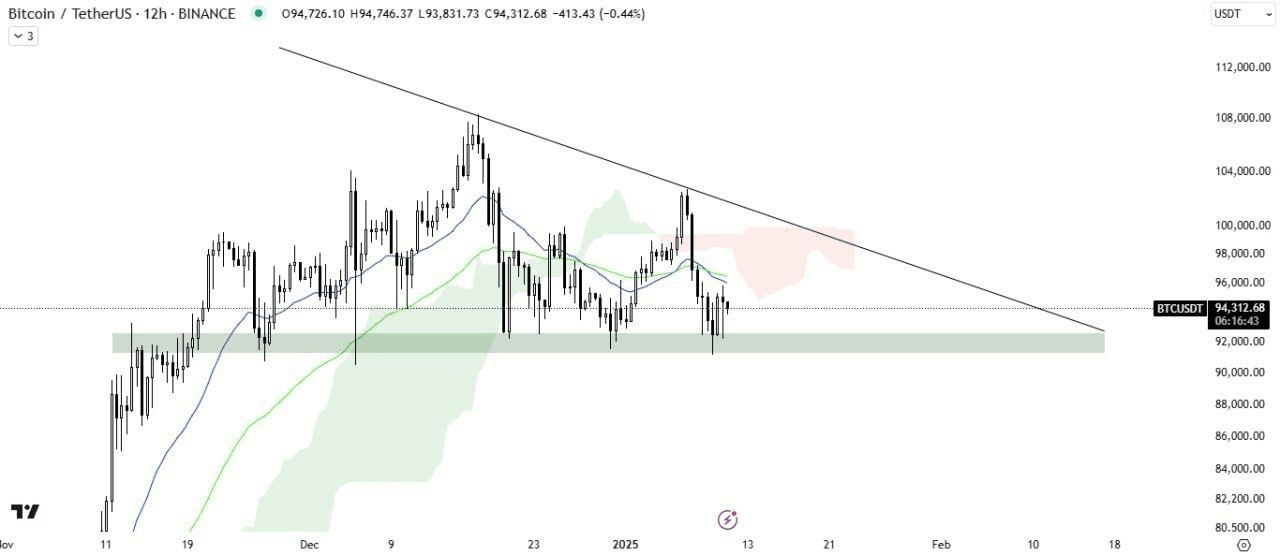
On the 12-hour timeframe, Bitcoin is trading inside a descending triangle pattern.
It is trading above the horizontal demand zone, which gives some risk in case of a breakdown below it.
Both the 21 days MA and 50 days MA indicators act as resistance above the current price area as well as the ichimoku cloud resistance.
A deeper correction could occur in case of a breakdown below the $92,000 support.